A Comprehensive Guide to GSEA and Pathway Analysis for Bulk RNA-seq Data
This article provides a complete resource for researchers and bioinformaticians applying Gene Set Enrichment Analysis (GSEA) to bulk RNA-seq data.
A Comprehensive Guide to GSEA and Pathway Analysis for Bulk RNA-seq Data
Abstract
This article provides a complete resource for researchers and bioinformaticians applying Gene Set Enrichment Analysis (GSEA) to bulk RNA-seq data. It covers foundational concepts, distinguishing pathway analysis from simple gene set testing, and offers a step-by-step methodological guide for implementation using popular tools and databases like MSigDB. The content addresses critical troubleshooting aspects, including the impact of small cohort sizes on result replicability and strategies for optimization. Finally, it guides the validation of findings and compares GSEA with other enrichment methods like over-representation analysis (ORA) and topology-based approaches, empowering scientists to generate robust, biologically interpretable results for biomedical and clinical research.
Understanding GSEA: From Core Concepts to Practical Applications in Transcriptomics
What is Gene Set Enrichment Analysis (GSEA)? Defining the Method and Its Purpose
Gene Set Enrichment Analysis (GSEA) is a computational method that determines whether an a priori defined set of genes shows statistically significant, concordant differences between two biological states (e.g., phenotypes) [1]. Unlike traditional single-gene analyses that focus on identifying individually significant genes, GSEA evaluates the collective behavior of groups of genes, providing a more holistic view of biological systems [2] [3]. This shift in perspective from individual genes to pathway-level analysis enables researchers to detect subtle but coordinated expression changes that might otherwise be overlooked when applying strict significance thresholds to individual genes [2] [3].
The methodology was first introduced by researchers at the Broad Institute to address the limitations of conventional approaches to analyzing data from high-throughput technologies like DNA microarrays and RNA sequencing [2] [3]. Prior to GSEA, analysis of gene expression datasets primarily focused on detecting differentially expressed genes (DEGs) across biological conditions, which often failed to capture the coordinated activity of genes functioning within biological pathways [2]. Since complex diseases typically involve synchronized modifications in the expression of numerous genes rather than isolated changes in single genes, GSEA provides a more biologically relevant framework for interpreting genomic data [2].
Core Principles and Methodology
Fundamental Concepts
GSEA operates on the fundamental principle that although large, biologically meaningful changes in a pathway can involve many genes, the expression changes of individual genes in that pathway may be small [3]. By aggregating these small effects across a gene set, GSEA can identify pathways that are consistently altered between biological states [3]. The analysis requires two primary inputs: (1) a collection of genes characterized by their known functions (gene sets), and (2) a matrix detailing gene expression levels across samples representing different biological states [2].
Gene sets are predefined collections of genes grouped based on their association with specific biological pathways, processes, molecular functions, or chromosomal locations [2]. These sets are typically derived from various biological databases that curate and annotate genes based on their functional roles. The Molecular Signatures Database (MSigDB) represents one of the most comprehensive resources for gene sets, containing thousands of annotated gene sets organized into multiple collections [1] [2]. Key MSigDB collections include:
- C1: Genes located in the same chromosome or cytogenetic band
- C2: Canonical pathways derived from established biological pathways
- C3: Gene sets sharing cis-regulatory motifs
- C4: Clusters of co-expressed genes identified computationally
- C5: Gene sets corresponding to Gene Ontology (GO) terms [2]
The GSEA Algorithm: A Three-Step Process
The standard GSEA methodology involves three sequential steps designed to identify, evaluate, and normalize enrichment signals [3] [4]:
Step 1: Calculation of Enrichment Score (ES) The algorithm first ranks all genes based on their correlation with a phenotype of interest, typically using metrics like fold change, signal-to-noise ratio, or t-statistics [2] [4]. The enrichment score (ES) is then computed by walking down the ranked list, increasing a running-sum statistic when a gene belongs to the set and decreasing it when the gene does not [4]. The ES represents the maximum deviation from zero encountered during this walk and reflects the degree to which genes in a gene set are overrepresented at the extremes (top or bottom) of the entire ranked list [4]. A simplified mathematical representation involves:
- P_hit(S,i): Cumulative sum of correlations for genes in set S up to position i
- P_miss(S,i): Cumulative sum for genes not in set S up to position i
- ES: Maximum deviation between Phit and Pmiss [3]
Step 2: Estimation of Statistical Significance The statistical significance of the ES is determined through permutation testing, which creates a null distribution for comparison [3] [4]. This process involves randomly shuffling phenotype labels (phenotype permutation) or creating random gene sets (gene_set permutation) and recalculating the ES for each permuted dataset [4]. The nominal p-value is derived from the proportion of permutations yielding an ES as strong or stronger than the observed ES [4]. For most analyses, 1000 permutations are recommended to generate a stable null distribution [5] [4].
Step 3: Adjustment for Multiple Hypothesis Testing When analyzing numerous gene sets simultaneously, GSEA normalizes the ES to account for differences in gene set sizes and correlations, producing Normalized Enrichment Scores (NES) that enable comparison across gene sets [4]. The method then adjusts for multiple hypothesis testing using False Discovery Rate (FDR) correction, with a common significance threshold being FDR q-value < 0.25 [5] [4].
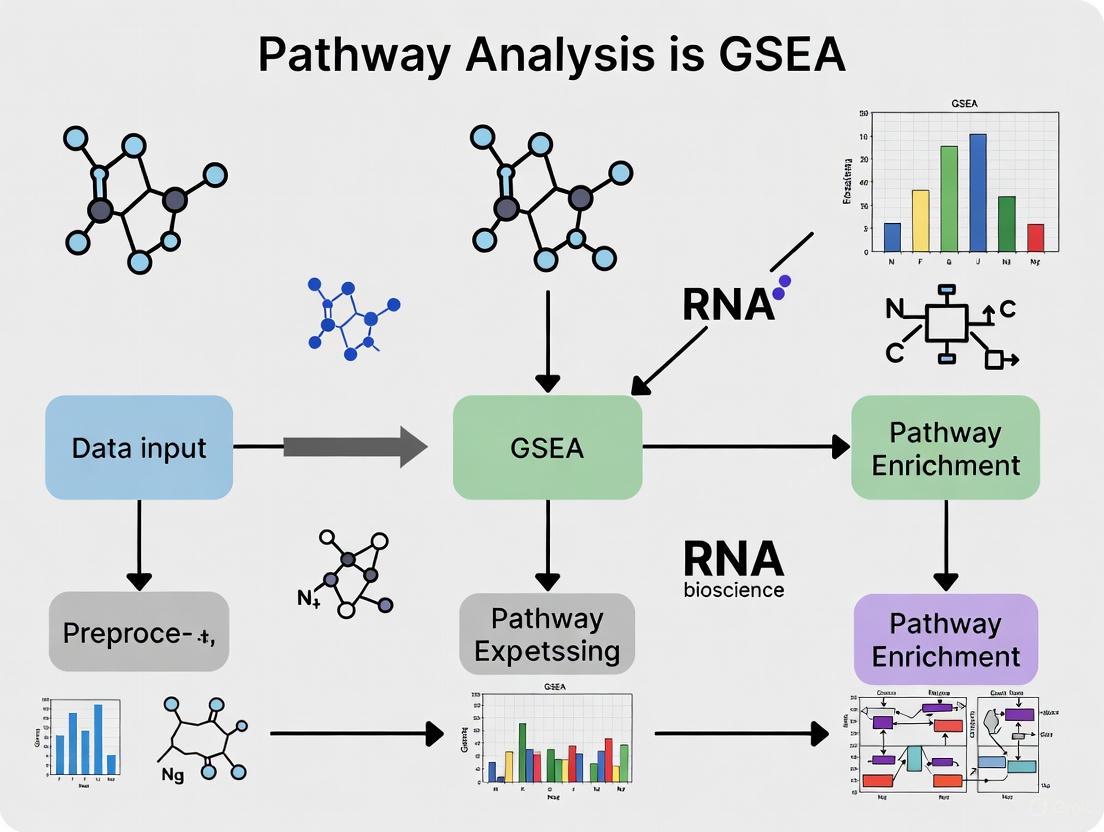
The following diagram illustrates the complete GSEA workflow from data preparation through result interpretation:
Experimental Protocols for GSEA Implementation
Standard GSEA Protocol for Bulk RNA-Seq Data
This protocol provides a step-by-step methodology for performing GSEA on bulk RNA-seq data, with an estimated completion time of approximately 4.5 hours [6]. The procedure assumes basic bioinformatics skills and requires pre-processed gene expression data.
Materials and Reagents:
- Normalized gene expression matrix (e.g., TPM, FPKM, or log-transformed counts)
- Phenotype labels defining biological states (e.g., case vs. control)
- Computer with internet access and appropriate software
Software Requirements:
- GSEA software (Java-based, available from Broad Institute) [1]
- Molecular Signatures Database (MSigDB) gene sets [1]
- R or Python environment (optional, for pre-processing)
Procedure:
Data Preparation and Formatting (30 minutes)
- Format expression data into GCT file format with genes as rows and samples as columns
- Prepare phenotype labels in CLS format, ensuring correct sample ordering
- Select appropriate gene sets from MSigDB based on biological question [6]
Parameter Configuration (15 minutes)
Algorithm Execution (2-4 hours, depending on dataset size)
- Run GSEA with specified parameters
- Monitor for completion and error messages
- Verify output file generation (HTML report, enrichment results)
Result Interpretation (30-60 minutes)
- Identify significantly enriched sets using thresholds (|NES| > 1, NOM p-val < 0.05, FDR q-val < 0.25) [5]
- Examine leading-edge genes that drive enrichment signals
- Generate enrichment plots for top significant gene sets
- Perform comparative analysis across conditions
Protocol for Single-Sample GSEA (ssGSEA) and GSVA
For analyses requiring pathway activity estimates in individual samples, single-sample methods like ssGSEA and Gene Set Variation Analysis (GSVA) provide valuable alternatives [8]. These methods transform a gene-by-sample expression matrix into a gene-set-by-sample matrix, enabling downstream analyses like clustering, classification, and survival analysis [8].
Procedure:
Install required R packages using BiocManager:
BiocManager::install("GSVA")Prepare input data as a normalized expression matrix with genes as rows and samples as columns
Define gene sets as a list object where each element is a vector of gene identifiers
Execute GSVA with appropriate parameters:
Use resulting enrichment scores for subsequent analyses including differential pathway expression between conditions [8]
Research Reagent Solutions
Table 1: Essential Research Reagents and Computational Tools for GSEA
| Resource Type | Examples | Function/Purpose | Availability |
|---|---|---|---|
| GSEA Software | GSEA Desktop, GSEA GenePattern | Core algorithm implementation | Free, Broad Institute [1] |
| Gene Set Databases | MSigDB, GO, KEGG, Reactome | Provide biologically defined gene sets | MSigDB free after registration [1] [2] |
| Alternative Tools | fgsea, ClusterProfiler, GSEApy | Faster implementations, R/Python integration | Open-source [2] [7] |
| Web-Based Platforms | Enrichr, WebGestalt, g:Profiler | User-friendly web interfaces | Free online tools [2] [3] |
| Visualization Software | Cytoscape, EnrichmentMap | Result interpretation and visualization | Open-source [6] |
Gene Set Collections and Databases
Table 2: Major Gene Set Databases for GSEA
| Database | Content Focus | Key Features | Common Use Cases |
|---|---|---|---|
| MSigDB [2] [7] | Comprehensive collection across multiple categories | Hallmark collections reduce redundancy; regularly updated | General purpose; cancer biology; immunology |
| Gene Ontology (GO) [6] | Biological Process, Molecular Function, Cellular Component | Hierarchical organization; standardized terms | Functional characterization of gene lists |
| Reactome [6] | Manually curated pathways | Detailed biochemical reactions; expert curation | Metabolic and signaling pathways |
| KEGG [6] | Pathways and diseases | Intuitive pathway diagrams; disease associations | Pathway mapping and visualization |
| WikiPathways [6] | Community-curated pathways | Collaborative curation model; diverse organisms | Community-driven research |
Technical Considerations and Best Practices
Experimental Design and Power Considerations
Recent research highlights significant challenges in replicating GSEA results from underpowered studies, particularly with small cohort sizes common in RNA-seq experiments [9]. While financial and practical constraints often limit sample sizes, studies with fewer than five replicates per condition demonstrate poor replicability [9]. Recommendations include:
- Minimum sample size: 6-12 biological replicates per condition for robust detection [9]
- Power assessment: Use bootstrapping procedures to estimate expected replicability [9]
- Heterogeneity consideration: Account for population heterogeneity in sample size planning [9]
Statistical Considerations
GSEA implementations employ different null hypothesis testing frameworks that impact interpretation:
- Competitive tests determine whether genes in a set are highly ranked relative to genes not in the set, with the sampling unit being genes [7]
- Self-contained tests evaluate whether genes in a set are differentially expressed without regard to other genes, with the sampling unit being subjects [7]
Most standard GSEA implementations use competitive tests, which are suitable for analyzing individual samples but require appropriate background gene sets [7]. Self-contained tests require multiple samples per group but accommodate inter-gene correlations [7].
Data Preprocessing and Quality Control
- Gene set filtering: Exclude gene sets with few overlapping genes (<10-15) as they adversely impact performance [7]
- Normalization consistency: Ensure compatibility between expression data normalization and GSEA parameters (e.g., kcdf="Gaussian" for log-transformed data) [8]
- Identifier mapping: Verify consistent gene identifiers across expression data, gene sets, and annotation files [4]
Applications in Biomedical Research
GSEA has become a cornerstone of modern bioinformatics, enabling mechanistic insights across diverse research domains [2]. Key applications include:
Cancer Research GSEA helps identify pathways involved in tumorigenesis and therapeutic resistance. For example, in gastric cancer research, GSEA has revealed the role of lysine metabolism-related genes in carcinogenesis, identifying potential metabolic targets [10].
Drug Discovery The method elucidates molecular mechanisms underlying drug responses, facilitating identification of novel drug targets and mechanisms of action [2] [10]. Drug sensitivity analysis coupled with GSEA can predict chemotherapeutic response based on pathway enrichment patterns [10].
Functional Genomics GSEA uncovers roles of specific gene clusters in biological processes, enhancing understanding of gene functions beyond what single-gene analyses can provide [2]. The approach has been successfully applied to diverse omics data types, including transcriptomics, proteomics, and genomics [6].
The following diagram illustrates the primary GSEA algorithm process from gene ranking through significance assessment:
Current Developments and Future Directions
The GSEA framework continues to evolve with regular updates to both software and gene set collections. Recent developments include:
- MSigDB 2025.1: Introduced the Mouse M7 collection of immunologic signature gene sets and provided updates for GO, Reactome, and WikiPathways [1]
- GSEA 4.4.0: Updated for Java 21 compatibility and addressed issues with recent MacOS versions [1]
- Single-cell adaptations: Methods like ssGSEA and GSVA now enable pathway-centric analysis of single-cell RNA-seq data [7] [8]
Future directions focus on improving statistical frameworks for low-sample-size scenarios, enhancing integration across multi-omics data types, and developing more sophisticated visualization tools for complex pathway interactions [6] [9]. As pathway enrichment methodology advances, GSEA remains an essential tool for extracting biological meaning from high-dimensional genomic data.
In the analysis of bulk RNA-seq data, moving from a list of differentially expressed genes to a mechanistic understanding of biological phenomena is a crucial step. Two primary methodologies dominate this space: gene set analysis and pathway analysis [11]. While these terms are often used interchangeably, they represent fundamentally different approaches with distinct assumptions, implementations, and biological interpretations. Understanding these differences is critical for researchers, scientists, and drug development professionals to select the appropriate method for their specific research questions and to accurately interpret the resulting biological insights. This article delineates the key conceptual distinctions between these approaches, provides practical protocols for their implementation, and discusses their implications for research outcomes.
Fundamental Conceptual Distinctions
Defining Pathways and Gene Sets
The core distinction between these analytical approaches begins with their underlying biological representations.
A biological pathway is "a series of interactions among molecules in a cell that leads to a certain product or a change in the cell" [11]. Pathways are typically described as complex graphs containing nodes (genes, proteins, metabolites) and edges (interactions, regulations) that capture the direction, type, and functional consequences of molecular relationships. Well-known pathway databases include KEGG, Reactome, Biocarta, and Panther [11] [6]. These representations preserve crucial biological knowledge about mechanisms, interactions, and dependencies.
In contrast, a gene set is fundamentally "an unordered and unstructured collection of genes" [11]. Gene sets may comprise genes sharing a common biological function, chromosomal location, or association with a specific disease, but they lack any representation of the relationships between these genes. The Molecular Signatures Database (MSigDB) contains over 10,000 such gene sets defined based on various criteria [11].
Table 1: Comparative Characteristics of Pathways and Gene Sets
| Feature | Pathway | Gene Set |
|---|---|---|
| Structure | Graph with nodes and edges | Flat, unordered list |
| Information captured | Interactions, regulations, directions | Membership only |
| Biological representation | Mechanistic model | Simple collection |
| Example databases | KEGG, Reactome, Panther | MSigDB, GO terms |
Information Utilization in Analytical Methods
The structural differences between pathways and gene sets directly impact how analytical methods utilize the available information.
Gene set analysis approaches, including Over-Representation Analysis (ORA) and Functional Class Scoring (FCS) methods like Gene Set Enrichment Analysis (GSEA), treat all genes within a set equally, disregarding their positional relationships and interaction dynamics [11]. These methods primarily operate on gene lists or rankings without incorporating biological knowledge about how genes within a pathway regulate one another.
Pathway analysis methods, particularly topology-based (TB) approaches, incorporate the structural information from pathway graphs, considering the positions, roles, and interactions of genes within these networks [11]. This allows these methods to model how perturbations might propagate through biological systems and predict downstream effects.
The following diagram illustrates the fundamental conceptual relationship between pathways and gene sets:
Methodological Approaches and Protocols
Over-Representation Analysis (ORA)
Conceptual Foundation ORA represents the first generation of gene set analysis methods. It tests whether genes from a predefined gene set are present in a list of differentially expressed genes more than would be expected by chance alone [12] [13]. The statistical foundation typically employs a hypergeometric test or Fisher's exact test on a 2×2 contingency table that cross-tabulates genes by their differential expression status and their membership in the gene set [12] [14].
Experimental Protocol
- Input Preparation: Generate a list of differentially expressed genes from bulk RNA-seq data using tools such as DESeq2 [15] or limma [16], applying significance thresholds (e.g., FDR < 0.05 and absolute fold change > 2) [12] [13].
- Background Definition: Define the background gene set, typically comprising all genes measured in the experiment [12].
- Gene Set Selection: Select appropriate gene set databases such as Gene Ontology (GO) or MSigDB [12] [6].
- Statistical Testing: Perform over-representation analysis using the
enrichGOfunction in clusterProfiler for GO terms [12] or theenricherfunction for custom gene sets [13]. - Multiple Testing Correction: Apply Benjamini-Hochberg FDR correction to account for false positives arising from testing multiple hypotheses [15].
- Result Visualization: Generate bar plots or dot plots showing significantly enriched gene sets [12].
Limitations ORA requires arbitrary significance thresholds for defining differentially expressed genes, ignores quantitative expression changes, and assumes independence between genes and pathways [17]. It cannot determine the direction of regulation (activation vs. suppression) and discards information from genes that don't meet the significance threshold [13].
Gene Set Enrichment Analysis (GSEA)
Conceptual Foundation GSEA represents a second-generation Functional Class Scoring approach that eliminates the dependency on arbitrary significance thresholds by considering all genes measured in an experiment [11] [17]. Instead of using a predetermined list of significant genes, GSEA operates on a ranked list of all genes based on their association with a phenotype of interest [18].
Experimental Protocol
- Gene Ranking: Rank all genes based on their differential expression, typically by signal-to-noise ratio, t-statistic, or log2 fold change [17] [18].
- Gene Set Collection: Select appropriate gene set databases such as MSigDB Hallmark collections [17].
- Enrichment Score Calculation: For each gene set, calculate an Enrichment Score (ES) that represents the degree to which genes in the set are overrepresented at the extremes (top or bottom) of the ranked list [17] [18].
- Significance Assessment: Determine statistical significance by comparing the observed ES to a null distribution generated by permuting sample labels [17].
- Normalization: Normalize ES to account for gene set size, producing Normalized Enrichment Scores (NES) that allow comparison across gene sets [18].
- Result Interpretation: Identify gene sets with significant FDR values and examine their NES direction (positive indicating up-regulation, negative indicating down-regulation) [18].
The following workflow illustrates the GSEA procedure:
Advantages and Limitations GSEA detects subtle but coordinated expression changes that might be missed by ORA, as it doesn't rely on arbitrary thresholds [17]. However, it remains a gene set method and therefore doesn't incorporate pathway topology [11]. The permutation process can be computationally intensive, and the method doesn't inherently address overlap between gene sets [17].
Topology-Based Pathway Analysis
Conceptual Foundation Topology-based pathway analysis incorporates the structural information from pathway graphs, including the positions of genes, interaction types, and signal flow directions [11]. These methods can predict how perturbations propagate through biological systems and identify likely affected downstream processes.
Experimental Protocol
- Pathway Database Selection: Select topology-rich pathway databases such as Reactome, KEGG, or Panther [6].
- Impact Analysis: Utilize tools that incorporate pathway topology, such as Pathway-Express, SPIA (Signaling Pathway Impact Analysis), or ROntoTools [11].
- Input Preparation: Provide gene expression changes with associated statistics as input.
- Pathway Perturbation Calculation: Compute a perturbation factor for each pathway that combines the expression changes of individual genes with their positional importance within the pathway [11].
- Statistical Assessment: Determine statistical significance through permutation testing or analytical approximations.
- Result Interpretation: Identify significantly perturbed pathways and examine the propagation of effects through pathway structures.
Advantages Topology-based methods can explain why changes in key upstream genes might have substantial downstream consequences, even when downstream genes show minimal expression changes [11]. They account for the biological context of genes within pathways, recognizing that certain positions (e.g., receptors at the pathway entrance) have greater influence than others [11].
Table 2: Methodological Comparison of Pathway Analysis Approaches
| Characteristic | ORA | GSEA | Topology-Based |
|---|---|---|---|
| Input requirement | List of significant DEGs | Ranked list of all genes | Gene expression statistics |
| Threshold dependency | High (requires cutoffs) | Low | Low |
| Information utilization | Set membership only | Set membership with ranking | Pathway structure & interactions |
| Directionality detection | No | Yes (via NES) | Yes |
| Computational intensity | Low | Medium | High |
| Biological mechanism | Limited | Limited | Comprehensive |
Practical Applications and Case Studies
Contextualizing Analytical Outcomes
The choice between gene set and pathway analysis methods has profound implications for biological interpretation. Consider the insulin signaling pathway: if the insulin receptor (INSR) is not present, the entire pathway may be shut down [11]. A topology-based pathway analysis could detect this profound impact from a single crucial change, while gene set methods would only note INSR's presence in a list of differentially expressed genes without recognizing its pivotal role [11].
Similarly, genes with multiple functions may play different roles in different pathways. For example, INSR appears in both insulin signaling and adherens junction pathways but plays a critical role in the former while being one of many redundant components in the latter [11]. Only topology-aware methods can distinguish between these contextual differences.
Practical Implementation Considerations
Selection Guidelines
- Use ORA when working with predefined gene lists from external sources or when computational resources are limited [18].
- Apply GSEA when analyzing entire expression datasets without predetermined thresholds or when seeking to detect subtle, coordinated changes across multiple genes in a pathway [17] [18].
- Implement topology-based pathway analysis when investigating specific mechanistic hypotheses or when pathway structure is likely to influence biological outcomes [11].
Complementary Use In practice, these approaches can be used complementarily. GSEA might identify pathways that are activated or repressed as a whole, while ORA could highlight specific pathways over-represented in extreme differentially expressed genes [18]. Topology-based analysis can then provide mechanistic insights into how identified pathways are perturbed.
The Scientist's Toolkit
Table 3: Essential Research Reagent Solutions for Pathway Analysis
| Tool/Category | Specific Examples | Function & Application |
|---|---|---|
| Differential Expression Tools | DESeq2 [15], limma [16] | Identify differentially expressed genes from bulk RNA-seq data |
| Pathway Analysis Software | clusterProfiler [12] [17], Pathway-Express [11], SPIA [11] | Perform various types of pathway and gene set analyses |
| Pathway Databases | KEGG [12], Reactome [6], MSigDB [11] [17] | Provide curated biological pathways and gene sets for analysis |
| Visualization Tools | Cytoscape [6], pathview [12], EnrichmentMap [6] | Visualize analysis results and pathway diagrams |
| RNA-seq Processing | nf-core/rnaseq [16], STAR [15] [16], Salmon [16] | Process raw sequencing data into gene expression counts |
Gene set analysis and pathway analysis represent distinct philosophical and methodological approaches to extracting biological meaning from bulk RNA-seq data. Gene set methods (ORA, GSEA) prioritize operational convenience and can identify broadly affected biological processes, while topology-based pathway analysis offers deeper mechanistic insights by incorporating the relational information between genes. The choice between these approaches should be guided by the specific research question, available data, and desired biological resolution. As these methods continue to evolve, researchers should remain apprised of new developments to maximize the biological insights gained from their transcriptomic studies.
Gene Set Enrichment Analysis (GSEA) is a computational method designed to determine whether an a priori defined set of genes shows statistically significant, concordant differences between two biological states (e.g., phenotypes) [1]. Unlike methods that focus on individual genes, GSEA evaluates the behavior of coordinated gene groups, capturing more subtle and biologically meaningful patterns in expression data. This methodology was developed to address the limitations of single-gene analyses, which can miss important biological effects when changes are modest but consistent across many genes in a pathway [19] [20]. The core of the GSEA algorithm is the Enrichment Score (ES), a metric that quantifies the degree to which a gene set is overrepresented at the extremes (top or bottom) of a ranked list of genes derived from a genome-wide expression experiment [19]. Understanding the calculation and interpretation of the ES is fundamental to the proper application of GSEA in biological research, particularly in the context of bulk RNA-seq data analysis for pathway-centric investigation.
Conceptual Foundation: From Single Genes to Gene Sets
The Limitation of Single-Gene Analyses
Traditional methods for analyzing gene expression data, such as over-representation analysis (ORA), rely on pre-selecting a list of significant differentially expressed genes (DEGs) based on arbitrary statistical cutoffs (e.g., FDR < 0.05, absolute fold-change > 2) [12] [19]. This approach has three major drawbacks:
- Arbitrary Thresholds: Important genes with moderate but coordinated changes may be excluded.
- Discarding Quantitative Data: The rich quantitative information from the experiment is reduced to a binary (significant/not significant) classification.
- Assumption of Independence: Statistical tests often assume gene independence, which is biologically unrealistic as genes function in coordinated networks [19].
GSEA overcomes these limitations by considering all genes from an experiment and their quantitative relationship to the phenotype of interest, without applying strict significance thresholds [21] [6].
The GSEA Approach
GSEA operates on a ranked gene list. All genes from a transcriptomic experiment are sorted based on their correlation with a phenotype [19] [20]. For example, in a bulk RNA-seq experiment comparing two conditions, genes can be ranked by the signal-to-noise ratio, fold change, or other metrics of differential expression [6]. The fundamental question GSEA asks is: Are the members of a pre-defined gene set (e.g., a pathway) randomly distributed throughout this ranked list, or are they concentrated at the top or bottom? A concentration at the top suggests the gene set is associated with the first phenotype (e.g., treatment), while a concentration at the bottom suggests association with the second phenotype (e.g., control) [21]. The Enrichment Score is the statistical value that answers this question.
The Enrichment Score (ES) Calculation: A Step-by-Step Algorithm
The calculation of the ES for a single gene set ( S ) follows a well-defined procedure, which can be broken down into three major steps.
Step 1: Calculate a Local (Gene-Level) Statistic and Rank the Genes
The first step is to compute a rank metric for each gene ( i ) in the expression dataset, which measures its association with the phenotype [19]. Let ( L ) be the total number of genes in the expression dataset.
- Input: Genome-wide expression data (e.g., from bulk RNA-seq) for two sample groups.
- Action: For each gene ( i ), calculate a correlation metric ( ri ). A common metric is the signal-to-noise ratio: ( ri = \frac{\mu{A} - \mu{B}}{\sigma{A} + \sigma{B}} ) where ( \mu{A} ) and ( \mu{B}} ) are the mean expression of gene ( i ) in group A and B, and ( \sigma{A} ) and ( \sigma{B}} ) are the standard deviations [20].
- Output: A ranked list of all genes ( L ), sorted from the most positively correlated with phenotype A to the most negatively correlated (or vice-versa) [19].
Step 2: Calculate a Global (Gene Set-Level) Statistic
This step involves walking down the ranked gene list ( L ) and updating a running sum statistic, the Enrichment Score (ES), which reflects the relative over-representation of genes in set ( S ) at the top or bottom of ( L ) [19].
Notation:
- ( N ): Total number of genes in ( L ).
- ( S ): The gene set of interest, containing ( N_H ) genes.
- ( \text{Hit}(i) ): The contribution to the running sum when a gene is in ( S ).
- ( \text{Miss}(i) ): The contribution to the running sum when a gene is not in ( S ).
The running sum ( RS ) is calculated iteratively for each position ( i ) in the ranked list ( L ):
[ RS(i) = RS(i-1) + \text{Hit}(i) - \text{Miss}(i) ]
Where: [ \text{Hit}(i) = \frac{|ri|^p}{\sum{gj \in S} |rj|^p} \quad \text{(if gene ( i ) is in ( S ))} ] [ \text{Miss}(i) = \frac{1}{N - N_H} \quad \text{(if gene ( i ) is not in ( S ))} ]
The exponent ( p ) is a weighting factor. By default, ( p=1 ), meaning the increments are proportional to the gene's correlation metric [19]. Setting ( p=0 ) reduces the calculation to the standard Kolmogorov-Smirnov statistic [19]. The initial value of the running sum is ( RS(0) = 0 ).
Step 3: Determine the Final Enrichment Score
The Enrichment Score ( ES ) for the gene set ( S ) is the maximum deviation of the running sum from zero encountered during the walk down the entire ranked list [19].
[ ES = \underset_{1 \le i \le N}{\text{max}} |RS(i)| ]
- A positive ES indicates the gene set is enriched at the top of the ranked list (associated with phenotype A).
- A negative ES indicates the gene set is enriched at the bottom of the ranked list (associated with phenotype B).
- An ES near zero indicates the genes in set ( S ) are randomly distributed throughout the ranked list.
The following diagram illustrates the logical workflow and mathematical relationships in the ES calculation algorithm:
Diagram 1: Logical workflow for calculating the GSEA Enrichment Score (ES).
Interpretation and Significance of the Enrichment Score
The GSEA Plot
The result of a GSEA analysis for a specific gene set is typically visualized using a three-panel plot [21].
- Top Panel - Enrichment Score Profile: This line chart plots the running enrichment score ( RS(i) ) as the calculation moves down the ranked list. The ES is the peak value of this plot. The point where the peak occurs is crucial, as the genes in the gene set appearing before this peak constitute the "leading-edge subset" – the core group of genes that contributes most to the enrichment signal [21] [22].
- Middle Panel - Gene Set Members: This barcode-like plot marks the positions of genes belonging to the set ( S ) within the ranked list ( L ). A cluster of lines at the beginning or end confirms the visual enrichment.
- Bottom Panel - Ranked List Metric: This plot shows the value of the rank metric (e.g., signal-to-noise ratio) for all genes in the sorted list, providing context for the gene-level data [21].
Determining Statistical Significance
The statistical significance (nominal p-value) of the observed ES is estimated using phenotype-based permutation testing [20]. This process involves:
- Randomly permuting the class labels (e.g., treatment vs. control) many times (e.g., 1000 permutations).
- Recalculating the ES for the gene set ( S ) for each permuted dataset, generating a null distribution of ES values.
- Comparing the actual ES from the real data to this null distribution. The nominal p-value is the proportion of permutations that yielded an ES as or more extreme than the observed ES.
Finally, the Enrichment Score is normalized (NES) by accounting for gene set size, and the NES is used to control the False Discovery Rate (FDR) across all tested gene sets [21] [20]. A common significance threshold is FDR q-value < 0.25 [21].
Practical Protocol: Performing GSEA on Bulk RNA-seq Data
This protocol provides a detailed methodology for applying GSEA to bulk RNA-seq data, from data preparation to interpretation of results.
Pre-analysis: Data Preparation and Ranking
Input Data: A gene expression matrix (e.g., counts, TPMs) from a bulk RNA-seq experiment with at least two sample groups for comparison.
Step 1: Normalization and Differential Expression
- Normalize the raw count data using a method appropriate for RNA-seq (e.g., TMM for edgeR, or the internal methods of DESeq2) [12].
- Perform a differential expression analysis between the two biological states of interest using tools like DESeq2, edgeR, or limma-voom.
- Output: A table of genes with statistics including log2 fold change, p-value, and adjusted p-value.
Step 2: Create a Ranked Gene List
- Extract a single ranking metric for every gene in the genome. A common and effective metric is the signed -log10(p-value). This metric incorporates both statistical significance and the direction of change. ( \text{Rank Metric} = \text{sign}(\text{logFC}) \times (-\text{log}_{10}(p\text{-value})) )
- Sort all genes from highest to lowest based on this metric. Genes at the top are significantly upregulated in class A, while genes at the bottom are significantly downregulated in class A [19].
Core Analysis: Running GSEA
Step 3: Select a Gene Set Database
- Choose a biologically relevant database such as the Molecular Signatures Database (MSigDB), which contains collections like the Hallmark gene sets, KEGG, and GO [1] [6] [20].
Step 4: Execute the GSEA Algorithm
- Use the GSEA software (v4.4.0 or higher) or the
fgseaR package [1]. - Inputs:
- The ranked list of genes from Step 2.
- The selected gene set database (in .gmt format).
- Parameters:
nperm: Number of permutations (use 1000 for a standard analysis).score type: Use weighted (the default, equivalent to p=1 in the ES formula) [19].
- Output: An enrichment results table containing ES, NES, nominal p-value, and FDR q-value for each tested gene set.
Post-analysis: Visualization and Interpretation
Step 5: Generate and Interpret GSEA Plots
- For significantly enriched gene sets, generate the three-panel GSEA plot.
- Identify the leading-edge subset of genes from the peak of the ES plot. These are the core contributors to the enrichment and are prime candidates for further investigation [21] [22].
Step 6: Use Visualization Tools (Optional)
- Import the GSEA results into a network visualization tool like Cytoscape with the EnrichmentMap app to create a network of enriched pathways, where clusters represent major underlying biological themes [6] [22].
Table 1: Key Parameters for the GSEA Algorithm
| Parameter | Description | Recommended Setting |
|---|---|---|
| Ranking Metric | The statistic used to sort all genes. | Signed -log10(p-value) or Signal2Noise |
| Weighting Exponent (p) | Controls how much the correlation metric influences the ES. | 1 (Weighted) |
| Number of Permutations | The number of label permutations to build the null distribution. | 1000 |
| Enrichment Statistic | The method for scoring the running sum. | Classic (for p=0) or Weighted (for p=1) |
| Normalization Mode | How the ES is normalized across gene sets of different sizes. | meandiv (Mean Division) |
Successful execution of a GSEA project requires a combination of software, data resources, and computational tools.
Table 2: Key Research Reagent Solutions for GSEA Analysis
| Item / Resource | Type | Primary Function | Example / Source |
|---|---|---|---|
| GSEA Software | Desktop Application | The primary platform for running the classical GSEA algorithm. | GSEA v4.4.0 from Broad Institute [1] |
| MSigDB | Gene Set Database | A comprehensive, curated collection of gene sets for enrichment testing. | Hallmark, C2 (Curated), C5 (GO) collections [1] [20] |
| fgsea R Package | R Software Package | A fast R implementation for running GSEA pre-ranked analysis programmatically. | Available via Bioconductor |
| Cytoscape | Network Visualization | An open-source platform for visualizing complex networks. | Cytoscape.org |
| EnrichmentMap App | Cytoscape Plugin | Creates a network from GSEA results, clustering related pathways. | Available via Cytoscape App Store [22] |
| clusterProfiler | R Software Package | An integrated toolkit for functional enrichment analysis, including ORA and GSEA. | Available via Bioconductor [12] |
Diagram: The Enrichment Score Calculation in Action
The following diagram provides a concrete, step-by-step visualization of how the running enrichment score is calculated for a small example gene set, illustrating the "walk" down the ranked list.
Diagram 2: A simplified, step-by-step example of the running Enrichment Score calculation.
Why Use GSEA? Advantages Over Single-Gene and Threshold-Based Methods
In the analysis of genome-scale experiments, such as bulk RNA-seq, researchers are often confronted with long lists of genes that require biological interpretation. Pathway enrichment analysis has emerged as a standard technique to address this challenge by summarizing large gene lists into a smaller set of more easily interpretable pathways, thus providing mechanistic insight into the underlying biology [6]. Two primary approaches dominate this field: Over-Representation Analysis (ORA), which relies on threshold-based methods to identify enriched pathways from a list of differentially expressed genes, and Gene Set Enrichment Analysis (GSEA), a more powerful method that considers the full ranking of genes without applying arbitrary thresholds [11] [7]. While conventional single-gene analysis methods focus on identifying individual genes with statistically significant expression changes, they often miss important biological effects that manifest through coordinated, subtle changes in groups of functionally related genes. This application note details why GSEA provides significant advantages over both single-gene analyses and threshold-based methods, particularly in the context of bulk RNA-seq data research.
Fundamental Advantages of the GSEA Approach
Elimination of Arbitrary Significance Thresholds
Unlike Over-Representation Analysis (ORA) methods that require a pre-defined threshold (e.g., FDR-adjusted p-value < 0.05 and fold-change > 2) to determine a list of differentially expressed genes, GSEA operates on a rank-ordered gene list without applying such arbitrary cut-offs [6] [11]. This threshold-free approach eliminates a major source of bias and information loss, as ORA techniques cannot distinguish between genes differentially expressed just above the detection threshold and those changing by many orders of magnitude [11]. By considering all genes in the experiment, GSEA maintains sensitivity to biological effects that might otherwise be missed when using strict significance thresholds.
Detection of Coordinated Subtle Changes
GSEA is specifically designed to detect situations where most or all genes in a predefined gene set exhibit small but coordinated expression changes. The fundamental hypothesis behind GSEA is that such coordinated changes in functionally related genes may be biologically important, even if no single gene meets strict significance thresholds after multiple testing corrections [11]. This approach leverages the biological insight that functionally related genes often participate in common pathways and may demonstrate concordant expression changes, providing greater sensitivity to detect subtle but consistent biological signals that would be missed when evaluating genes in isolation.
Utilization of Full Ranking Information
Whereas threshold-based methods discard valuable information about the magnitude and direction of gene expression changes after applying cut-offs, GSEA fully utilizes the continuous ranking metric (e.g., fold-change or signal-to-noise ratio) for all genes in the experiment [7]. The method tests whether members of a gene set tend to occur toward the top or bottom of the ranked list, indicating coordinate up- or down-regulation [1]. This preserved ranking information enables GSEA to distinguish between strong, consistent changes in gene sets versus random or inconsistent patterns, providing a more nuanced view of pathway activity.
Table 1: Comparative Analysis of Gene Set Analysis Methods
| Analysis Method | Input Requirements | Statistical Approach | Key Limitations |
|---|---|---|---|
| Single-Gene Analysis | Normalized expression data | Identifies individually significant genes using per-gene statistics | Ignores coordinated patterns; multiple testing burden; misses subtle effects |
| Over-Representation Analysis (ORA) | List of differentially expressed genes (threshold-dependent) | Tests for over-representation using hypergeometric or Fisher's exact test | Depends heavily on arbitrary thresholds; discards expression magnitude information |
| Gene Set Enrichment Analysis (GSEA) | Rank-ordered list of all genes (threshold-free) | Determines if gene sets show statistically significant, concordant differences between states | Requires predefined gene sets; computationally intensive |
GSEA Experimental Protocol and Workflow
Input Data Preparation
The initial step in GSEA involves preparing a ranked gene list from transcriptomic data. For bulk RNA-seq experiments, this typically involves:
- Data Preprocessing: Perform standard RNA-seq processing including quality control, read alignment, normalization, and gene-level quantification.
- Differential Expression Analysis: Calculate differential expression statistics (e.g., fold-change, signal-to-noise ratio) for all genes comparing biological states of interest.
- Gene Ranking: Rank all genes based on their association with the phenotype of interest, typically using a signed metric that preserves directionality (e.g., positive values for up-regulation, negative for down-regulation).
The ranked list should include all genes measured in the experiment, not just those meeting specific significance thresholds [6] [1].
Gene Set Selection and Curation
GSEA requires predefined gene sets representing biological pathways or processes. The Molecular Signatures Database (MSigDB) is the most comprehensive resource for this purpose, containing several curated collections [1] [7]:
- Hallmark Gene Sets: Well-defined biological states and processes with reduced redundancy.
- Canonical Pathways: Curated pathways from known databases such as KEGG, Reactome, and BioCarta.
- GO Gene Sets: Gene Ontology terms covering biological processes, molecular functions, and cellular components.
- Regulatory Target Sets: Gene sets representing targets of regulation by transcription factors or microRNAs.
Researchers should select gene set collections appropriate for their biological context and filter out sets with insufficient representation (<10-15 genes) in their data [7].
Enrichment Score Calculation Algorithm
The core GSEA algorithm involves the following computational steps [23] [1]:
Enrichment Score (ES) Calculation: For each gene set S, walk down the ranked list of genes, increasing a running-sum statistic when encountering a gene in S and decreasing it when encountering a gene not in S. The magnitude of change depends on the correlation between the gene and the phenotype. The ES is the maximum deviation from zero encountered during the walk.
Significance Estimation: Estimate the statistical significance of the ES against a null distribution generated by permuting gene labels (for competitive tests) or sample labels (for self-contained tests). Empirical p-values are calculated as the proportion of permutations yielding an ES equal to or more extreme than the observed ES.
Multiple Testing Correction: Adjust p-values for multiple hypothesis testing across all gene sets evaluated, typically using False Discovery Rate (FDR) correction. The recommended significance threshold is FDR < 0.25 [23].
Leading Edge Analysis: Identify the subset of genes in each significant gene set that contribute most to the enrichment signal, providing biological insights into potential key regulators or effectors.
Diagram 1: GSEA computational workflow for bulk RNA-seq data
Validation and Performance Evidence
Power and Sensitivity Advantages
Comparative studies have demonstrated that GSEA and related integrative methods provide substantial power gains over conventional single-gene analyses. In scRNA-seq studies (with implications for bulk RNA-seq), the integrative method iDEA showed up to 64% power gain over existing differential expression methods and up to five-fold power gain over existing GSE methods [24]. These power advantages are particularly evident when analyzing pathways with coordinated but subtle expression changes that would not meet significance thresholds in single-gene analyses.
Concordance with Experimental Validation
The biological relevance of GSEA findings has been substantiated through experimental validation studies. For instance, pathway activity scores derived from GSEA-based approaches have shown >90% concordance with experimentally validated drug mechanisms in patient-derived xenografts and estrogen receptor-positive breast cancer cell lines [25]. This high concordance rate demonstrates that GSEA identifies biologically meaningful pathway activities that translate to experimentally observable effects.
Table 2: Performance Metrics of GSEA Compared to Alternative Methods
| Performance Metric | Single-Gene Analysis | ORA Methods | GSEA |
|---|---|---|---|
| Sensitivity to Subtle Effects | Low | Moderate | High |
| Threshold Dependency | High | High | None |
| Biological Concordance | Variable | Moderate | High (>90%) |
| Multiple Testing Burden | Severe | Moderate | Mild |
| Power in Simulation Studies | Baseline | 1.2-1.5x | 1.6-5x |
Advanced Applications and Extensions
Drug Mechanism Enrichment Analysis (DMEA)
The GSEA framework has been successfully adapted for drug repurposing applications through Drug Mechanism Enrichment Analysis (DMEA). This approach groups drugs with shared mechanisms of action (MOAs) into sets and applies GSEA to rank-ordered drug lists, effectively increasing on-target signal while reducing off-target effects compared to individual drug analysis [23]. DMEA has demonstrated utility in identifying senolytic effects of EGFR inhibitors and other drug mechanisms, showing improved prioritization of therapeutic candidates over single-drug evaluation methods.
Integrative Analysis Frameworks
Recent methodological advances have developed Bayesian integrative frameworks that jointly model differential expression and gene set enrichment. The iDEA method exemplifies this approach, using a hierarchical Bayesian model to integrate DE and GSE analyses, which improves both the power of DE analysis and the accuracy of GSE analysis [24]. By borrowing information across genes and jointly modeling these interconnected analyses, such integrative approaches further enhance the advantages of the GSEA paradigm.
Discretization-Based Enhancements
Novel computational frameworks like gdGSE have emerged that employ discretized gene expression profiles to assess pathway activity, effectively mitigating discrepancies caused by data distributions [25]. This approach applies statistical thresholds to binarize gene expression matrices before converting them into gene set enrichment matrices, demonstrating robust extraction of biological insights from diverse bulk and single-cell gene expression datasets.
Diagram 2: Key advantages and extensions of the GSEA methodology
The Scientist's Toolkit: Essential Research Reagents
Table 3: Key Research Reagents and Computational Tools for GSEA
| Tool/Resource | Type | Primary Function | Access Information |
|---|---|---|---|
| GSEA Software | Desktop Application | Core enrichment analysis with visualization capabilities | https://www.gsea-msigdb.org/ [1] |
| MSigDB | Database | Curated gene set collections for enrichment analysis | https://www.gsea-msigdb.org/ [1] |
| Enrichr | Web Application | User-friendly enrichment analysis with multiple visualization options | https://maayanlab.cloud/enrichr/ [26] |
| iDEA | R Package | Integrative differential expression and gene set enrichment | www.xzlab.org/software.html [24] |
| fgsea | R Package | Fast implementation for pre-ranked gene set enrichment | https://pmc.ncbi.nlm.nih.gov/articles/PMC6607905/ [7] |
| DMEA | R Package/Web App | Drug mechanism enrichment analysis for repurposing | https://belindabgarana.github.io/DMEA [23] |
| gdGSE | R Package/Web App | Discretization-based pathway enrichment analysis | https://github.com/WangX-Lab/gdGSE [25] |
Gene Set Enrichment Analysis represents a fundamental advancement over both single-gene analysis and threshold-based methods for interpreting transcriptomic data. Its ability to detect coordinated biological effects without arbitrary thresholds, utilize complete ranking information, and provide robust pathway-level insights has established GSEA as an indispensable method in bulk RNA-seq research. The continued development of extensions and enhancements—including drug mechanism enrichment, integrative Bayesian frameworks, and discretization approaches—ensures that the GSEA paradigm remains at the forefront of functional genomics, enabling researchers to extract meaningful biological insights from complex genomic datasets.
In the analysis of bulk RNA-seq data within pathway-centric research, the step of generating a properly ranked gene list is a critical bridge between raw differential expression results and sophisticated interpretation methods like Gene Set Enrichment Analysis (GSEA). GSEA determines whether defined sets of genes exhibit statistically significant, concordant differences between two biological states by examining their distribution in a ranked gene list [1] [2]. The quality and biological relevance of this ranking directly control the power to uncover underlying mechanisms in studies of disease, drug responses, and basic biology. This protocol details the methodologies for transitioning from a completed differential expression analysis to a robust, hypothesis-ready ranked gene list, framed within the broader context of a GSEA-based research thesis.
Methodological Foundations: DGE Tools and Ranking Metrics
The first prerequisite is a completed Differential Gene Expression (DGE) analysis. DGE is a technique used to compare gene expression levels between two or more sample groups, such as healthy versus diseased tissues, to identify differentially expressed genes (DEGs) [27]. Multiple computational tools exist for this purpose, each with specific statistical approaches for modeling RNA-seq count data. The choice of tool can influence the resulting gene list; therefore, selecting one that is appropriate for your experimental design is paramount.
Table 1: Common Differential Gene Expression (DGE) Tools and Their Characteristics.
| DGE Tool | Underlying Distribution | Primary Normalization Method | Key Features |
|---|---|---|---|
| DESeq2 [27] [15] | Negative Binomial | Geometric mean (Deseq) [27] | Shrinkage variance with variance-based and Cook’s distance pre-filtering. |
| edgeR [27] | Negative Binomial | TMM (Trimmed Mean of M-values) [27] | Empirical Bayes estimate and a generalized linear model tailored to over-dispersed data. |
| limma [27] [16] | Log-normal | TMM (Trimmed Mean of M-values) [27] | A linear modeling framework, often with voom transformation for RNA-seq data. |
Once a DGE analysis is complete, the results table must be processed to create a ranked list. The ranking metric is crucial as it determines the position of genes in the list that GSEA will analyze. The following are common metrics used for ranking:
- Signal-to-Noise Ratio (SNR): A classic metric used in the original GSEA publication that considers the difference in means between two groups relative to the standard deviation within groups.
- Fold Change (FC): The ratio of expression values between two conditions. While simple, using fold change alone ignores variance and can elevate genes with high variability but low significance.
- t-statistic: Measures the size of the difference relative to the variability in the data. A form of the t-statistic is often the default output of DGE tools like
limma[16]. - p-value / Adjusted p-value (FDR): Ranks genes based on their statistical significance. However, this can prioritize genes with small, biologically irrelevant fold changes that are highly significant due to low variance.
For a biologically meaningful GSEA, it is often recommended to use a metric that incorporates both the magnitude of change (fold change) and a measure of its variance or significance. For instance, DESeq2 provides shrunken log2 fold changes, which are ideal for ranking as they reduce the noise associated with low-count genes [15].
Experimental Protocol: From Count Matrix to Ranked List
This protocol assumes you have a count matrix from an RNA-seq processing pipeline (e.g., nf-core/rnaseq [16] or a similar workflow using STAR alignment and Salmon quantification [28] [29]) and have identified your comparison groups.
Differential Expression Analysis with DESeq2
The following steps outline a standard DGE analysis using the DESeq2 package in R, which will produce the results needed for ranking.
- Data Input and Object Creation: Load your raw count matrix and sample metadata (colData) into R. The sample metadata must include the group assignments for your comparison. Create a
DESeqDataSetobject. - Normalization and Pre-filtering: DESeq2 internally corrects for library size and does not require pre-normalization of the count matrix [15]. However, it performs automatic filtering to remove genes with very low counts across all samples to increase the power of the analysis.
- Statistical Testing: Perform the differential expression testing. DESeq2 uses a negative binomial generalized linear model and the Wald test by default to calculate p-values [15].
- Log Fold Change Shrinkage: Apply an empirical Bayes shrinkage estimator to the log2 fold changes. This is a critical step for ranking, as it mitigates the effect of large but unreliable fold changes from low-count genes and improves the GSEA results [15].
Generating the Ranked Gene List
After obtaining the DGE results, the next step is to create the ranked list for GSEA.
- Extract the Ranking Metric: From the results object (
resLFC), extract the column containing the shrunken log2 fold changes. - Handle Missing and Problematic Values: Remove any genes where the fold change or p-value is
NA. Optionally, you may also choose to filter the list to include only genes that pass a specific significance threshold (e.g., FDR < 0.05) before ranking, though this is not strictly necessary for GSEA. - Sort the List: Sort the metric in descending order. For GSEA, the list should be ordered from the most upregulated genes (largest positive fold change) to the most downregulated genes (largest negative fold change).
- Format and Export: The final
ranked_gene_listis a named numeric vector where the names are gene identifiers (e.g., Ensembl ID, Entrez ID, or official gene symbol) and the values are the ranking metric. This list can now be saved as a plain text file (e.g.,.rnkformat) for direct input into GSEA software.
Table 2: The Scientist's Toolkit: Essential Research Reagents and Resources.
| Item / Resource | Function in the Workflow |
|---|---|
| DESeq2 (R/Bioconductor) [27] [15] | Performs statistical testing for differential expression and provides shrunken log2 fold changes for robust gene ranking. |
| edgeR (R/Bioconductor) [27] | An alternative to DESeq2 for DGE analysis using a negative binomial model, suitable for a wide range of experimental designs. |
| GSEA Software [1] [2] | The primary software for performing Gene Set Enrichment Analysis, which consumes the ranked gene list. |
| Molecular Signatures Database (MSigDB) [1] [2] | A curated collection of annotated gene sets (e.g., pathways, GO terms) used as input for GSEA to interpret the ranked list. |
| ENSEMBL / GENCODE Annotation [29] | Provides the reference genome and gene annotation files (.gtf) essential for read alignment and gene quantification in the initial RNA-seq pipeline. |
| STAR Aligner [28] [29] | A splice-aware aligner for mapping RNA-seq reads to a reference genome, a key step in generating the input count matrix. |
| Salmon [16] | A tool for transcript-level quantification from RNA-seq data that rapidly resolves read assignment uncertainty. |
Workflow Visualization
The following diagram illustrates the logical flow from raw sequencing data to a ranked gene list, highlighting the core focus of this protocol.
A Step-by-Step Workflow for Running GSEA on Your Bulk RNA-seq Data
In the analysis of bulk RNA-seq data, Gene Set Enrichment Analysis (GSEA) stands as a powerful, knowledge-based approach for interpreting gene expression patterns. Unlike simple overlap-based methods, GSEA evaluates data at the level of gene sets, allowing it to detect subtle but coordinated expression changes in biologically relevant pathways [30]. The reliability of any GSEA result, however, is critically dependent on the quality and correctness of its input. A properly formatted ranked gene list, utilizing consistent and accurate gene identifiers, is not merely a preliminary step but the very foundation upon which biologically meaningful conclusions are built. This protocol provides a detailed guide for researchers to curate this essential input, ensuring that subsequent pathway analysis is both robust and interpretable.
The GSEA Workflow: From Raw Data to Biological Insight
The following diagram illustrates the complete GSEA workflow, highlighting the central role of input curation, which is the focus of this Application Note.
Diagram 1: The complete GSEA workflow. The green node (Ranked Gene List Creation) represents the critical step detailed in this protocol.
Preparing the Ranked Gene List: A Step-by-Step Protocol
The standard input for a GSEA PreRanked analysis is a single text file containing a single column of gene identifiers and a corresponding ranking metric. The following section outlines the detailed methodology for its creation.
Step 1: Perform Differential Expression Analysis
Begin with a completed differential expression (DE) analysis of your bulk RNA-seq data. This analysis can be performed using established tools such as DESeq2 or edgeR, which are specifically designed to handle the count-based nature of RNA-seq data and are robust even with a limited number of replicates [31]. The output of this analysis should be a table containing, at a minimum, a gene identifier and a statistical measure for each gene, ready for the next step.
Step 2: Select the Ranking Metric
The choice of ranking metric determines which biological signals GSEA will amplify. The most common and biologically intuitive metric is the log2 fold change, which represents the magnitude and direction of expression change. To increase sensitivity, it is considered a best practice to subset the initial gene list by applying a mild fold-change filter (e.g., log2 fold change ≥ ± 0.15, representing a 10% or greater change) and a significance filter (e.g., adjusted p-value ≤ 0.05) [30]. This filter removes genes with negligible change and high variability, which contribute mostly noise to the ranking. The remaining genes are then ranked by their log2 fold change.
Step 3: Format the Input File
Create a tab-delimited plain text file (.txt or .rnk). The file must contain only two columns and no header line.
- Column 1: Gene identifiers (see Section 4 for identifier selection).
- Column 2: The numeric ranking metric (e.g., the signed log2 fold change).
An example of the first few lines of a correctly formatted .rnk file is shown below:
Choosing Gene Identifiers: A Critical Decision
The selection of a gene identifier type is a critical decision that directly impacts the success of the GSEA mapping process. Inconsistent or incorrect identifiers are a primary cause of analysis failure. The following table compares the most common and reliable identifier types for GSEA.
Table 1: Comparison of Common Gene Identifier Types for GSEA
| Identifier Type | Species | Format Example | Pros & Cons |
|---|---|---|---|
| Ensembl Gene ID | Human, Mouse, Rat | ENSG00000139618 (Human) | Pro: Highly stable, unique, and unambiguous. Recommended for most analyses. |
| Entrez Gene ID | Human, Mouse, Rat, and others | 6249 (Human RBP4) | Pro: Stable and widely supported. Con: Can be less intuitive than symbols. |
| Official Gene Symbol | All | RBP4 | Pro: Biologically intuitive and human-readable. Con: Can be ambiguous and change over time. Use with caution. |
Protocol for Identifier Conversion and Consistency
- Start from a Stable Source: Begin the RNA-seq analysis pipeline with a stable identifier like Ensembl Gene ID or Entrez Gene ID from the initial read quantification and alignment step [32].
- Maintain Consistency: Use the same identifier type throughout your entire analysis pipeline, from the count matrix to the final ranked list.
- Validate Before GSEA: Before running GSEA, perform a check to ensure your identifiers are recognized. The Molecular Signatures Database (MSigDB), which supplies the gene sets for GSEA, is pre-mapped against multiple common identifiers [1]. You can use the GSEA platform's built-in tools to check the overlap between your dataset's identifiers and the gene sets.
Table 2: Essential Tools and Resources for GSEA Input Preparation
| Tool / Resource | Function in Protocol | Key Features |
|---|---|---|
| DESeq2 / edgeR [31] | Performs the initial differential expression analysis to generate fold changes and p-values. | Uses negative binomial models; handles studies with low replicate numbers well. |
| R or Python Script | A custom script is used to filter, rank, and format the final .rnk file. |
Provides full control over the filtering thresholds and ranking metric. |
| MSigDB [1] | The database of gene sets used by GSEA to test for enrichment. | Provides collections like Hallmark, GO, and KEGG; use it to validate identifier recognition. |
| GSEA Software [1] [30] | The desktop application used to execute the PreRanked analysis. | Provides the user interface, analysis engine, and visualization tools for results. |
The meticulous preparation of the ranked gene list is a critical, non-negotiable phase in the GSEA workflow. By following this protocol—selecting an appropriate ranking metric, applying sensible pre-filtering, and most importantly, choosing and consistently using stable gene identifiers—researchers and drug developers can ensure that their subsequent pathway analysis is built upon a solid foundation. This rigor maximizes the potential to uncover true biological signal, thereby generating reliable and actionable insights from bulk RNA-seq data.
The Molecular Signatures Database (MSigDB) is one of the most widely used and comprehensive databases of annotated gene sets, specifically created for use with Gene Set Enrichment Analysis (GSEA) software [33]. In the analysis of bulk RNA-seq data, GSEA represents a powerful computational method that determines whether defined sets of genes show statistically significant, concordant differences between two biological states, moving beyond single-gene analysis to interpret expression data at the level of biologically relevant pathways and processes [1] [7]. The utility of GSEA and similar gene-set-based analysis methods depends entirely on the availability of independent, high-quality compendia of gene sets, a role filled by MSigDB [33].
As high-throughput technologies like RNA sequencing generate measurements for tens of thousands of genes, researchers face challenges in interpreting resulting gene lists. GSEA addresses this by focusing on coordinated differential expression of pre-defined groups of genes, producing results that can be more readily interpreted in terms of relevant biological processes [33]. Since its introduction, GSEA has become an essential part of the genomic analysis toolbox and has motivated the development of many similar approaches [33]. MSigDB provides the critical foundation for these analyses by supplying the curated gene sets that represent current biological knowledge.
The MSigDB is a resource of tens of thousands of annotated gene sets, divided into both Human and Mouse collections [34]. The database organizes these gene sets into multiple major collections, each with a specific focus and application. As of the latest versions, the Human MSigDB contains numerous collections designated H and C1 through C8, while the Mouse MSigDB (MSigDB) contains parallel collections designated MH and M1 through M8 [34] [35]. All gene sets in MSigDB are reviewed, curated, and annotated manually, represented as lists of human gene symbols from the HUGO Gene Nomenclature Committee [33].
A key strength of MSigDB is its regular updating cycle. The database team releases updated versions periodically, with MSigDB v2025.1 being the current version as of June 2025 [34] [1]. These updates include new gene sets, collection expansions, and updates to gene annotations using the latest Ensembl releases, ensuring researchers have access to current biological knowledge [1]. The following sections provide detailed descriptions of the primary collections available in MSigDB.
Table 1: Primary MSigDB Gene Set Collections
| Collection | Description | Number of Gene Sets (Human) | Use Cases |
|---|---|---|---|
| H: Hallmark | Refined gene sets representing specific well-defined biological states with reduced redundancy | 50 [36] | General starting point for most analyses [37] |
| C1: Positional | Genes grouped by their chromosomal location | 302 [36] | Identifying chromosomal aberrations, regional effects [37] |
| C2: Curated | Curated gene sets from online databases and literature | 7,561 total [36] | Context-specific signatures, canonical pathways [37] |
| C3: Regulatory | Potential targets of regulation by transcription factors or microRNAs | 3,713 total [36] | Linking expression changes to regulatory elements [37] |
| C4: Computational | Gene sets defined by computational analysis of cancer data | 1,006 [36] | Cancer-related studies [37] |
| C5: Ontology | Gene sets derived from Gene Ontology terms | 16,228 total [36] | Comprehensive functional analysis [7] |
| C6: Oncogenic | Gene sets representing signatures of oncogenic pathway activation | 189 [36] | Cancer pathway analysis [37] |
| C7: Immunologic | Gene sets representing immune cell states and perturbations | 5,219 [36] | Immunological research [7] |
| C8: Cell Type | Cell type signature gene sets from single-cell studies | 866 [36] | Cell type-specific analysis [37] |
The Hallmark Gene Set Collection: A Focused Starting Point
Rationale and Development
The Hallmark gene set collection was developed to address two significant challenges that emerged as MSigDB grew: redundancy across gene sets and heterogeneity within gene sets [33]. As MSigDB expanded beyond its original focus on metabolic disease and cancer to include more than 10,000 gene sets, representing a wider range of biological processes and diseases, these challenges reduced the database's utility [33]. Redundancy occurs when multiple gene sets share large proportions of their genes or represent similar biological processes, potentially dominating GSEA results and obscuring other relevant findings [33]. Heterogeneity refers to inconsistent behavior of genes within a single set, which can arise from context dependencies, multiple biological response modalities, or limitations in curation [33].
To address these issues, researchers used a hybrid approach combining automated computational procedures with manual expert curation to create the Hallmark collection [33]. The computational methodology identified gene set overlaps and generated coherent representatives, while manual curation applied domain expert knowledge to assign biological themes, identify appropriate expression data for refinement and validation, and properly annotate the final hallmarks [33]. This process began with 8,380 gene sets from MSigDB collections C1-C6, which were grouped into 600 clusters based on gene membership overlaps [33]. After manual review, 43 clusters were annotated with 50 clear biological themes, with seven clusters assigned two themes due to heterogeneity in their founder gene sets [33].
Composition and Features
The resulting Hallmark collection consists of 50 gene sets that summarize and represent specific well-defined biological states or processes while displaying coherent expression [33] [37]. Each hallmark is a "refined" gene set derived from multiple "founder" sets, with the final collection incorporating 4,022 of the original 8,380 MSigDB gene sets as founders [33]. The refinement process involved defining "raw" sets as the union of a cluster's gene sets, then excluding genes that did not well discriminate the relevant phenotype in expression datasets, ensuring only coordinately expressed and biologically relevant genes remained [33].
Table 2: Selected Hallmark Gene Sets and Their Characteristics
| Hallmark Name | Process Category | Description | Number of Founder Sets | Number of Genes |
|---|---|---|---|---|
| APOPTOSIS | Pathway | Programmed cell death; caspase pathway | 80 | 161 [33] |
| EPITHELIALMESENCHYMALTRANSITION | Development | Epithelial mesenchymal transition | 107 | 200 [33] |
| INTERFERONGAMMARESPONSE | Immune | Interferon gamma response | 82 | 200 [33] |
| INFLAMMATORY_RESPONSE | Immune | Inflammation | 120 | 200 [33] |
| HYPOXIA | Pathway | Response to hypoxia | 80 | 200 [33] |
| ANGIOGENESIS | Development | Blood vessel formation | 14 | 36 [33] |
| GLYCOLYSIS | Metabolic | Glycolysis and gluconeogenesis | 87 | 200 [33] |
| OXIDATIVE_PHOSPHORYLATION | Metabolic | Oxidative phosphorylation and citric acid cycle | 93 | 200 [33] |
| DNA_REPAIR | DNA Damage | DNA repair | 44 | 150 [33] |
| MYOGENESIS | Development | Muscle differentiation | 64 | 200 [33] |
The Hallmark collection is designed as the recommended starting point for exploring MSigDB and conducting GSEA [37]. By reducing both variation and redundancy, the hallmarks provide more refined and concise inputs for gene set enrichment analysis, offering a better-delineated biological space for interpretation [37]. Each hallmark gene set page provides links to its corresponding founder sets for more in-depth exploration, as well as links to microarray data used for refining and validating the hallmark signatures [37].
Detailed Guide to Major Collections
C2: Curated Gene Sets
The C2 collection represents one of the most extensive and widely used components of MSigDB, containing gene sets curated from various sources including online pathway databases and the biomedical literature [37]. Many sets are also contributed by individual domain experts [37]. The C2 collection is divided into two main subcollections: Chemical and Genetic Perturbations (CGP) and Canonical Pathways (CP) [37].
The CGP subcollection contains gene sets that represent expression signatures of genetic and chemical perturbations [37]. Unlike pathway databases that represent generic cellular processes, CGP aims to provide specific targeted signatures largely from perturbation experiments [37]. Many of these gene sets come in pairs (xxxUP and xxxDN) representing genes induced and repressed by particular perturbations [37]. The majority of CGP sets were curated from publications and include links to PubMed citations, source information, and corresponding raw data in repositories like GEO or ArrayExpress [37].
The CP subcollection contains pathway gene sets curated from multiple online databases, including:
- BioCarta: Now defunct, but legacy gene sets remain available [37]
- KEGG MEDICUS: Current KEGG pathway resource [37]
- Pathway Interaction Database (PID): Available via the NDEx database [37]
- Reactome: Comprehensive pathway knowledgebase, regularly updated [37]
- WikiPathways: Community-curated pathway resource [37]
- KEGG Legacy: Older KEGG subcollection, with newer KEGG MEDICUS sets recommended for current use [37]
C5: Ontology Gene Sets
The C5 collection contains gene sets derived from the Gene Ontology (GO) resource, which provides a controlled vocabulary for describing gene functions across three domains: biological process (BP), cellular component (CC), and molecular function (MF) [36] [38]. The GO collection is one of the most comprehensive in MSigDB, with 10,480 gene sets in the human version [36]. These include 7,583 BP sets, 1,042 CC sets, and 1,855 MF sets [36].
GO terms provide species-agnostic information about gene products, organizing knowledge into three domains [38]:
- Molecular Function: The molecular activities of individual gene products (e.g., kinase activity)
- Cellular Component: Where gene products are active (e.g., mitochondria)
- Biological Process: The pathways and larger processes to which gene product activity contributes (e.g., transport) [38]
The C5 collection is particularly valuable for comprehensive functional analysis, though its size can lead to redundancy in results, which tools like REVIGO or GOSemSim can address through semantic similarity reduction [38].
C3: Regulatory Target Gene Sets
The C3 collection contains gene sets representing potential targets of regulation by transcription factors or microRNAs [37]. These sets consist of genes grouped by shared regulatory elements they contain, representing known or likely cis-regulatory elements in promoters and 3'-UTRs [37]. The collection is divided into two subcollections: microRNA targets (MIR) and transcription factor targets (TFT) [37].
The MIR subcollection includes:
- miRDB: Computationally predicted human gene targets of miRNAs using the MirTarget algorithm, featuring high-confidence predictions [37]
- MIR_LEGACY: Older gene sets based on seed matching with microRNAs from miRBase v7.1 [37]
The TFT subcollection includes:
- GTRD: Genes predicted to contain transcription factor binding sites in their promoter regions, derived from the Gene Transcription Regulation Database [37]
- TFT_LEGACY: Older gene sets based on shared upstream cis-regulatory motifs [37]
These gene sets enable researchers to link changes in expression profiling experiments to putative cis-regulatory elements, providing mechanistic insights into observed expression patterns [37].
Specialized Collections: C6, C7, and C8
C6: Oncogenic Gene Sets contain signatures of oncogenic pathway activation, derived from knowledge of frequently mutated genes in cancer and their downstream targets [37]. This collection is particularly valuable for cancer research, with 189 gene sets in the human collection [36].
C7: Immunologic Gene Sets contain gene sets that represent cell states and perturbations within the immune system [36] [7]. This collection is extensive (5,219 gene sets in human) and includes the ImmuneSigDB subcollection and vaccine response gene sets (VAX) [36]. It is particularly recommended for immunological research [7].
C8: Cell Type Signature Gene Sets contain curated cluster markers for cell types identified in single-cell sequencing studies of human tissue [36] [37]. With 866 gene sets, this collection facilitates the interpretation of expression patterns in the context of specific cell types [36].
Experimental Protocols for GSEA Using MSigDB
Protocol 1: Standard GSEA Workflow with Hallmark Collections
Objective: To identify enriched biological processes in bulk RNA-seq data using the MSigDB Hallmark collection.
Materials and Reagents:
- GSEA Software: Available from the Broad Institute website [1]
- MSigDB Hallmark Collection: Downloadable after registration [34]
- Expression Dataset: Normalized bulk RNA-seq count data
- Phenotype Labels: File defining sample classes for comparison
Procedure:
- Data Preparation: Prepare your expression data in GCT format and phenotype labels in CLS format. Ensure data is properly normalized and filtered.
- Software Setup: Launch GSEA and load your expression dataset and phenotype labels.
- Parameter Configuration:
- Select the Hallmark gene set collection (HALLMARK)
- Choose the enrichment statistic (typically weighted)
- Set the metric for ranking genes (e.g., Signal2Noise for two-class comparisons)
- Define the number of permutations (recommended: 1000)
- Set the permutation type (recommended: phenotype for sample sizes >7)
- Run Analysis: Execute GSEA and monitor for completion.
- Interpret Results:
- Examine the Enrichment Score (ES) and Normalized Enrichment Score (NES)
- Review the False Discovery Rate (FDR) q-value
- Focus on gene sets with FDR < 0.25 (standard cutoff) [1]
- Explore leading edge analysis to identify core enriched genes
Troubleshooting Tip: If no gene sets meet significance thresholds, consider relaxing the FDR cutoff to 0.25 or examining nominal p-values for trends, as recommended in GSEA documentation [1].
Protocol 2: Custom Analysis with Multiple Collections
Objective: To perform comprehensive pathway analysis using multiple MSigDB collections for hypothesis generation.
Materials and Reagents:
- GSEA Software or fgsea R package for faster implementation [7]
- Multiple MSigDB Collections: Hallmark (H), C2 (Curated), C5 (GO)
- Pre-ranked Gene List: Generated from differential expression analysis
Procedure:
- Gene Ranking: Generate a ranked list of genes from your differential expression analysis using an appropriate statistic (e.g., t-statistic, log fold change).
- Collection Selection: Based on your research question:
- Analysis Execution:
- For GSEA: Run separate analyses for each collection
- For fgsea: Run all collections simultaneously using the fgsea R package [7]
- Result Integration:
- Combine results across collections
- Filter for FDR < 0.05 (stringent) or 0.25 (discovery)
- Identify consistent signals across multiple collections
- Visualization: Create enrichment plots for top results and generate summary tables.
Technical Consideration: When using large collections like C5 (GO), filter gene sets with low overlap (<10-15 genes) with your dataset, as small gene sets can adversely impact performance [7].
GSEA Workflow: Standard pathway analysis steps from data preparation to result interpretation.
Table 3: Essential Research Reagents and Computational Resources for MSigDB-GSEA Analysis
| Resource/Reagent | Type | Function/Purpose | Access Information |
|---|---|---|---|
| GSEA Desktop Application | Software | Primary tool for performing gene set enrichment analysis | Download from Broad Institute after registration [1] |
| MSigDB Gene Sets | Database | Curated gene sets for enrichment analysis | Available through GSEA interface or direct download [34] |
| fgsea R Package | Software | Faster implementation of GSEA algorithm for high-throughput analyses | Available through Bioconductor [7] |
| Ensembl Annotations | Database | Platform annotation authority for gene identifiers in MSigDB | MSigDB uses latest Ensembl version (v114 as of 2025.1) [37] |
| Reactome Pathway Database | Knowledgebase | Source for canonical pathway gene sets in C2 collection | reactome.org; integrated into MSigDB C2:CP collection [37] [38] |
| WikiPathways | Knowledgebase | Community-curated pathway resource for C2 collection | wikipathways.org; regularly updated in MSigDB [37] |
| Gene Ontology Resource | Ontology | Source for C5 collection gene sets | geneontology.org; comprehensive functional annotations [38] |
| ImmuneSigDB | Database | Immunological gene signatures within C7 collection | Integrated into MSigDB; specialized for immunology [37] |
Visualization and Interpretation of Results
Effective visualization is crucial for interpreting GSEA results. The standard enrichment plot generated by GSEA software displays three key components: the enrichment score profile, the position of gene set members along the ranked list, and the ranking metric scores [1]. These plots visualize where the genes in a particular gene set fall in the ranked list of all genes, showing whether they cluster at the top (positively enriched) or bottom (negatively enriched) [38].
When working with multiple significant gene sets, creating summary visualizations is essential:
- Enrichment Map Visualization: Cluster related gene sets based on overlap to reduce redundancy
- Bubble Plots: Display normalized enrichment scores, statistical significance, and other metrics
- Leading Edge Heatmaps: Visualize the core enriched genes across multiple significant gene sets
Statistical Interpretation Guidelines
Proper interpretation of GSEA results requires understanding key statistical measures:
- Normalized Enrichment Score (NES): Accounts for differences in gene set size and correlations, allowing comparison across gene sets. The sign indicates direction of enrichment.
- False Discovery Rate (FDR): The probability that a gene set with a given NES represents a false positive. Standard significance threshold is FDR < 0.25 [1].
- Nominal p-value: The statistical significance of the observed enrichment without multiple hypothesis correction.
- Family-Wise Error Rate (FWER): The probability that the gene set represents a false positive considering all tested sets.
For discovery analyses, the standard significance threshold of FDR < 0.25 is recommended, as it balances Type I and Type II error rates appropriately [1]. For validation studies, more stringent thresholds (e.g., FDR < 0.05) may be appropriate.
Collection Selection Guide: Recommended MSigDB collections for different research contexts.
Advanced Applications and Integration
Integration with Other Bioinformatics Tools
MSigDB gene sets can be integrated with numerous other bioinformatics tools beyond GSEA. The fgsea package provides a faster implementation of the GSEA algorithm suitable for high-throughput analyses [7]. GSVA (Gene Set Variation Analysis) is another popular method that uses MSigDB collections to estimate pathway activity in individual samples [7]. For single-cell RNA-seq data, tools like VISION, AUCell, and Pagoda2 can utilize MSigDB gene sets to infer pathway activities at single-cell resolution [7].
For network-based analyses, MSigDB integrates with the NDEx platform, allowing researchers to visualize gene sets in the context of biological networks [34] [38]. This enables examination of interactions and relationships between genes within significant gene sets, providing deeper mechanistic insights.
Custom Gene Set Creation and Contribution
Researchers can extend their analyses beyond the pre-defined collections in MSigDB by creating custom gene sets relevant to their specific research questions. The database also welcomes contributions from the research community, providing a mechanism for domain experts to share their curated gene sets [34]. Contributions can be submitted to genesets@broadinstitute.org for consideration, with proper attribution provided in the database [34].
When creating custom gene sets, several guidelines improve their utility:
- Provide clear, specific names and descriptions
- Include references to supporting literature
- Use standard gene nomenclature (HGNC symbols)
- Document the curation methodology
- Specify the biological context or conditions
This approach allows research communities to build specialized collections within their domains while leveraging the MSigDB infrastructure and integration with GSEA.
The Molecular Signatures Database represents an indispensable resource for pathway analysis of bulk RNA-seq data using Gene Set Enrichment Analysis. Its carefully organized collections, particularly the Hallmark gene sets with their reduced redundancy and improved coherence, provide researchers with a powerful framework for interpreting gene expression data in biological context. By following the protocols and guidelines outlined in this article, researchers can effectively navigate MSigDB's resources, select appropriate gene set collections for their specific research questions, and apply proper analytical techniques to extract meaningful biological insights from their transcriptomic data. As MSigDB continues to evolve with regular updates and new collections, it remains a cornerstone of modern computational biology and precision medicine research.
Gene Set Enrichment Analysis (GSEA) is a computational method that determines whether an a priori defined set of genes shows statistically significant, concordant differences between two biological states (e.g., phenotypes) [1]. Unlike methods that focus on individual genes, GSEA evaluates the expression of entire gene sets, making it particularly powerful for detecting subtle but coordinated changes in expression patterns that might be missed in single-gene analyses [6] [39]. This approach has become a cornerstone in the interpretation of bulk RNA-seq data, allowing researchers to gain mechanistic insight into gene lists generated from genome-scale experiments [6].
Within the context of pathway analysis for bulk RNA-seq research, GSEA offers distinct advantages. It does not require arbitrary significance thresholds for individual genes, instead leveraging the full ranking of genes based on their association with a phenotype [7] [40]. This protocol provides comprehensive guidance for implementing GSEA through two complementary approaches: the original Broad Institute software platform and popular R/packages, enabling researchers to select the workflow most appropriate for their technical environment and analytical needs.
Theoretical Foundation and Key Concepts
Statistical Hypotheses in Gene Set Testing
Gene set enrichment methods can be categorized based on their underlying null hypothesis:
Competitive tests: Determine whether genes in a set are more often differentially expressed than genes not in the set [7]. The null hypothesis states that "genes in a given gene set are at most as often differentially expressed as the genes not in the set." These tests permute gene labels and are implemented in pre-ranked GSEA approaches [40].
Self-contained tests: Assess whether genes in a set show evidence of differential expression without regard to other genes [7]. The null hypothesis states that "no genes in a given gene set are differentially expressed." These tests permute phenotype labels and require at least 7 samples per condition [40].
GSEA typically implements competitive testing, making it particularly suitable for experiments with smaller sample sizes where self-contained tests may be underpowered.
The GSEA Algorithm
The GSEA method operates through a structured analytical process [40]:
Ranking calculation: All genes are ranked based on their correlation with a phenotype or based on another metric of differential expression.
Enrichment score (ES) calculation: The ES reflects the degree to which a gene set is overrepresented at the extremes (top or bottom) of the ranked list. It is calculated by walking down the ranked list, increasing a running-sum statistic when encountering a gene in the set and decreasing it when encountering a gene not in the set.
Significance estimation: The nominal p-value for the ES is estimated by comparing it to an empirical null distribution generated by permuting the gene labels.
Multiple testing correction: False discovery rate (FDR) or Benjamini-Hochberg procedures adjust for testing multiple gene sets.
A key concept in GSEA interpretation is the leading edge—the subset of genes that appear at the point in the ranked list where the enrichment score reaches its maximum deviation from zero. These genes are primarily responsible for the enrichment signal and often represent core pathway components [39].
The Molecular Signatures Database (MSigDB)
The Molecular Signatures Database (MSigDB) is the primary resource of annotated gene sets for use with GSEA software, currently containing tens of thousands of gene sets divided into Human and Mouse collections [34]. The database is regularly updated, with the most recent release (MSigDB 2025.1) introducing new collections and updates [1].
Table: Major MSigDB Collections
| Collection | Description | Common Applications |
|---|---|---|
| Hallmark (H) | Curated, reduced redundancy signatures representing specific biological states | General studies; cancer research [7] |
| Curated (C2) | Gene sets from online pathway databases and domain experts | Pathway-focused analyses [7] |
| Regulatory (C3) | Gene sets representing potential transcription factor targets | Regulatory network analysis |
| Computational (C4) | Gene sets defined by computational analysis of large gene expression datasets | Cancer phenotype associations |
| GO (C5) | Gene Ontology gene sets representing biological processes, molecular functions, and cellular components | Functional enrichment analysis [7] |
| Oncogenic (C6) | Gene sets defined from cellular cancer pathways | Cancer mechanism studies |
| Immunologic (C7) | Gene sets representing immune cell signatures | Immunological studies [7] |
Research Reagent Solutions
Table: Essential Tools for GSEA Implementation
| Tool/Resource | Function | Access |
|---|---|---|
| GSEA Desktop Software | Graphical interface for running GSEA with visualization capabilities | Broad Institute website [1] |
| MSigDB Database | Collection of annotated gene sets for enrichment testing | MSigDB portal [34] |
| clusterProfiler R package | Functional enrichment analysis including ORA and GSEA methods | Bioconductor [40] |
| fgsea R package | Fast pre-ranked gene set enrichment analysis | Bioconductor [41] [42] |
| msigdbr R package | Access to MSigDB collections directly within R | CRAN [40] |
| org.Hs.eg.db/org.Mm.eg.db | Genome-wide annotation for human/mouse | Bioconductor [40] |
Protocol 1: GSEA Using Broad Institute Software
Software Installation and Setup
Registration and Download: Register for free on the GSEA website to download the GSEA desktop application [1]. The current version as of 2025 is GSEA 4.4.0, updated for Java 21 compatibility [1].
System Requirements: Ensure Java Runtime Environment (JRE) 21 or later is installed. The software includes bundled OpenJDK distributions for major operating systems [1].
Data Preparation: Format your expression dataset as a GCT (gene cluster text) file and phenotypes as a CLS (categorical class) file according to GSEA specifications.
Running the Analysis
The following workflow illustrates the complete GSEA process using Broad Institute software:
Parameter Configuration:
- Permutation type: Select "phenotype" for standard analyses or "gene_set" for small sample sizes
- Scoring scheme: Choose weighted (recommended), unweighted, or weighted_p2
- Gene set size filters: Exclude very small or very large gene sets (typically min=15, max=500 genes) [42]
- Collapsing mode: Specify how to handle multiple probes for a single gene
Execution and Monitoring: Run the analysis and monitor progress through the GSEA interface. Large datasets or many gene sets may require substantial computation time.
Interpretation of Results
Key results to examine after GSEA completion:
- Enrichment Score (ES): The primary statistic reflecting the degree of enrichment
- Normalized Enrichment Score (NES): Allows comparison across gene sets with different sizes
- False Discovery Rate (FDR): Adjusted p-value accounting for multiple hypothesis testing
- Leading edge genes: The subset of genes driving the enrichment signal
The GSEA software provides multiple visualization options, including enrichment plots that graphically represent the distribution of gene set members across the ranked list and the location of the maximum enrichment score.
Protocol 2: GSEA Using R/Packages
Package Installation and Setup
Install the required R packages using the following commands:
Data Preparation and Gene Ranking
The first critical step involves preparing a ranked gene list from differential expression results:
Table: Comparison of Gene Ranking Metrics for Pre-ranked GSEA
| Ranking Metric | Advantages | Limitations | Best Applications |
|---|---|---|---|
| Fold Change (shrunken) | Simple biological interpretation; preserves directionality | Ignores statistical significance | Exploratory analyses; strong effect sizes |
| Signed p-value | Combines magnitude and statistical significance | May overemphasize small effects with high precision | Balanced discovery approaches |
| Test statistic (e.g., t-statistic) | Incorporates effect size and variability | Interpretation less intuitive | When sample variability differs between conditions |
Retrieving Gene Sets
Access MSigDB collections directly within R:
Running Fast Pre-ranked GSEA (fgsea)
Execute the enrichment analysis using the optimized fgsea algorithm:
Alternative Implementation with clusterProfiler
clusterProfiler provides a unified framework for enrichment analyses:
The following diagram illustrates the complete R-based GSEA workflow:
Results Visualization and Interpretation
Creating Enrichment Plots
Visualize specific enriched pathways using enrichment plots:
Creating Dot Plots and Bar Plots
Use clusterProfiler's visualization capabilities:
Results Interpretation Guidelines
When interpreting GSEA results, consider the following aspects:
- Statistical significance: Focus on gene sets with FDR q-values < 0.25 (as recommended by Broad Institute) or more conservative thresholds (e.g., FDR < 0.05) for high-confidence results
- Biological consistency: Evaluate whether enriched pathways align with experimental expectations and existing knowledge
- Leading edge analysis: Examine the specific genes driving enrichment in significant pathways
- Directionality: Note whether pathways are enriched in positive (upregulated) or negative (downregulated) directions
Troubleshooting and Technical Considerations
Common Issues and Solutions
Table: Troubleshooting Guide for GSEA Implementation
| Problem | Potential Causes | Solutions |
|---|---|---|
| No significant gene sets | Inadequate sample size; weak biological effect; overly conservative correction | Verify experimental power; relax FDR threshold; check data quality and normalization |
| Too many significant gene sets | Insufficient multiple testing correction; biased ranking metric | Apply stricter FDR thresholds; validate with alternative ranking methods |
| Computational performance issues | Large gene sets; many permutations; insufficient memory | Increase memory allocation; filter gene sets by size; reduce permutation count for exploratory analysis |
| Ties in ranked list | Identical values for ranking metric | fgsea automatically handles small percentages of ties; investigate if extensive ties exist [42] |
Best Practices for Robust Analysis
Gene set size filtering: Exclude very small (<15 genes) and very large (>500 genes) gene sets to reduce false positives and increase interpretability [42].
Database selection: Choose gene set collections appropriate for your biological context—Hallmark collections for general analyses, C7 for immunological studies, C5 for comprehensive functional coverage [7].
Sensitivity analysis: Test multiple ranking metrics and parameter settings to ensure results are robust to analytical choices.
Biological validation: Corroborate GSEA findings with independent experimental evidence or literature support before drawing strong conclusions.
Comparison of Approaches and Applications
Software Selection Guidance
Table: Comparison of GSEA Implementation Options
| Feature | Broad Institute Software | R/packages (fgsea/clusterProfiler) |
|---|---|---|
| User interface | Graphical user interface | Command-line/programmatic |
| Learning curve | Steeper for beginners | Requires R proficiency |
| Customization | Limited to built-in options | High flexibility for advanced users |
| Visualization | Comprehensive built-in plots | Customizable using ggplot2 and extensions |
| Reproducibility | Manual workflow recording | Fully scripted and reproducible |
| Computational efficiency | Moderate | High (especially fgsea) |
| Integration with pipelines | Limited | Excellent with other bioinformatics workflows |
Advanced Applications
GSEA methodology extends beyond standard pathway analysis to several advanced applications:
- Time-series analyses: Applying GSEA to temporal data to identify dynamically regulated pathways
- Drug repositioning: Identifying compounds that reverse disease-associated gene expression signatures
- Cross-species comparisons: Using orthologous gene mappings to compare pathway conservation
- Multi-omics integration: Combining RNA-seq with proteomic or epigenetic data for comprehensive pathway assessment
The continued development of GSEA methods and resources ensures their ongoing relevance in bulk RNA-seq research, with recent advances focusing on improved statistical methods, expanded gene set collections, and enhanced visualization capabilities.
Gene Set Enrichment Analysis (GSEA) is a computational method that determines whether an a priori defined set of genes shows statistically significant, concordant differences between two biological states [1]. Unlike traditional enrichment methods that rely on arbitrary significance thresholds for individual genes, GSEA evaluates the ranking of all genes from a genome-wide expression experiment based on their correlation with biological phenotypes, assessing whether members of a gene set occur predominantly at the top or bottom of this ranked list [21] [43]. This approach captures subtle but coordinated expression changes in biologically relevant pathways that might be missed by methods focusing only on significantly differentially expressed genes [21].
The interpretation of GSEA results centers on three primary statistical outputs: the Normalized Enrichment Score (NES), which quantifies the degree to which a gene set is overrepresented at the extremes of the ranked list; the False Discovery Rate (FDR), which accounts for multiple hypothesis testing; and the Leading Edge Analysis, which identifies the core genes that drive the enrichment signal [44] [43]. For researchers working with bulk RNA-seq data, proper interpretation of these metrics is essential for drawing biologically meaningful conclusions about pathway activation or suppression in their experimental systems.
Key GSEA Output Metrics and Their Statistical Foundations
Enrichment Score (ES) and Normalized Enrichment Score (NES)
The Enrichment Score (ES) represents the maximum deviation from zero encountered when walking down the ranked gene list, increasing a running-sum statistic when a gene belongs to the set and decreasing it when the gene does not [43]. Table 1 summarizes the core metrics used in GSEA interpretation.
Table 1: Key GSEA Output Metrics and Interpretation Guidelines
| Metric | Description | Calculation | Interpretation |
|---|---|---|---|
| Enrichment Score (ES) | Maximum deviation from zero in running enrichment score | Calculated by walking down ranked list, increasing statistic when gene is in set, decreasing when not | Reflects degree of overrepresentation at top or bottom of ranked list [43] |
| Normalized Enrichment Score (NES) | ES normalized for gene set size and dependencies | ES divided by mean of ESs from permutations of the same dataset | Allows comparison across different gene sets; positive NES = enrichment at top, negative NES = enrichment at bottom [43] |
| Nominal P-value | Statistical significance of single gene set's ES | Based on permutation-generated null distribution | Probability under null of obtaining ES as strong or stronger than observed; significant if < 0.05 [43] |
| False Discovery Rate (FDR) | Adjusted significance accounting for multiple hypothesis testing | Proportion of false positives among gene sets with NES as or more extreme than current set | Standard cutoff: FDR < 0.25; more stringent: FDR < 0.05 [21] [43] |
| Leading Edge Subset | Core genes accounting for enrichment signal | Genes appearing between zero and point where running sum reaches maximum deviation | Represents core group responsible for gene set's enrichment signal [44] |
The ES calculation begins with the ranking of all genes based on their correlation with a phenotype of interest. GSEA then walks down this ranked list, increasing a running-sum statistic when it encounters a gene in the set and decreasing it for genes not in the set [43]. The magnitude of the increment depends on the correlation of the gene with the phenotype [43]. The ES is the maximum positive or negative deviation from zero encountered during this walk, representing the degree to which a gene set is overrepresented at the extremes of the ranked list.
The Normalized Enrichment Score (NES) adjusts the ES to account for differences in gene set sizes and correlations between gene sets and the expression dataset [43]. This normalization enables meaningful comparison of enrichment results across different gene sets. The NES is calculated by normalizing the ES relative to the mean of the ESs obtained from permutations of the dataset, effectively correcting for variations in gene set size [43]. A positive NES indicates enrichment at the top of the ranked list (correlated with the first phenotype in the comparison), while a negative NES indicates enrichment at the bottom (correlated with the second phenotype) [21].
Statistical Significance and Multiple Hypothesis Testing
GSEA estimates the statistical significance of the ES through a permutation-based approach, which generates a null distribution by repeatedly scrambling the phenotype labels and recalculating the ES for each permuted dataset [43]. The nominal p-value represents the probability under this null distribution of obtaining an ES as strong or stronger than the observed ES [43].
When analyzing multiple gene sets simultaneously, as is common with databases like MSigDB containing thousands of sets, GSEA addresses multiple hypothesis testing through the False Discovery Rate (FDR) [43]. The FDR represents the estimated probability that a gene set with a given NES represents a false positive finding [43]. The GSEA team recommends considering a set significantly enriched if its NES has an FDR q-value below 0.25, though many researchers apply more stringent cutoffs (e.g., FDR < 0.05) depending on their specific research context and objectives [21] [43].
Visualizing GSEA Results: Graphs and Workflows
Standard GSEA Enrichment Plot
The standard GSEA visualization consists of three panels that collectively illustrate the enrichment pattern of a gene set (Figure 1).
Figure 1: Components of a standard GSEA enrichment plot. The top panel shows the running enrichment score with its peak indicating the maximum deviation. The middle panel shows the position of gene set members in the ranked list. The bottom panel displays the correlation metric for all genes in the ranked list.
The top panel displays the running enrichment score as the analysis progresses down the ranked gene list. The point of maximum deviation (the peak) represents the enrichment score for that gene set [21]. Genes appearing before this peak for a positive ES constitute the "leading edge subset" - the core group responsible for the enrichment signal [44] [21].
The middle panel uses vertical lines to indicate the position of each gene set member within the overall ranked list. When these lines cluster predominantly at the beginning of the ranked list, the gene set is enriched in phenotype A; when they cluster at the end, the set is enriched in phenotype B [21].
The bottom panel displays the value of the ranking metric (often Signal2Noise ratio or fold change) for all genes in the dataset, transformed to z-scores for visualization. Red coloring indicates higher expression in phenotype A, while blue indicates higher expression in phenotype B [21].
Leading Edge Analysis and Visualization
The leading edge subset represents the core group of genes that accounts for the gene set's enrichment signal [44]. These genes appear in the ranked list between zero and the point at which the running enrichment score reaches its maximum deviation [44]. Figure 2 illustrates the conceptual workflow for identifying and interpreting leading edge subsets.
Figure 2: Workflow for leading edge analysis in GSEA. The process begins with gene ranking and proceeds through enrichment score calculation to identification of core genes that drive the enrichment signal.
The GSEALeadingEdgeViewer generates four specialized graphs to visualize the overlap between leading-edge subsets of selected gene sets [44]. This analysis helps researchers identify common genes that drive enrichment across multiple significant pathways, potentially revealing master regulators or core biological processes underlying the observed phenotypic differences.
Leading edge genes are particularly valuable for biological interpretation because they represent the specific genes within a pathway that are most responsible for its association with the phenotype. These genes often make promising candidates for further experimental validation or therapeutic targeting.
Protocol for GSEA Implementation with Bulk RNA-seq Data
Experimental Design and Data Preparation
Table 2 outlines the essential computational tools and resources required for implementing GSEA with bulk RNA-seq data.
Table 2: Research Reagent Solutions for GSEA with Bulk RNA-seq
| Category | Resource/Tool | Description | Application in GSEA |
|---|---|---|---|
| Analysis Software | GSEA Desktop Application | Java-based graphical interface for running GSEA | Primary analysis platform with embedded Java; available for Linux, Mac, Windows [45] |
| GenePattern GSEA Module | Cloud-accessible GSEA implementation | Alternative platform requiring internet connection [45] [43] | |
| Gene Set Databases | MSigDB (Molecular Signatures Database) | Curated collection of annotated gene sets | Primary source of biologically defined gene sets; regularly updated [1] [45] |
| Data Processing | Chip Annotation Files | Platform-specific identifier mapping files | Translates platform-specific gene identifiers to HGNC symbols [45] |
| CIBERSORTx | Computational deconvolution tool | Estimates immune cell infiltration from bulk RNA-seq data [46] | |
| File Formats | GCT, RES, PCL, TXT | Valid expression dataset formats | Contains genes, samples, expression values [45] |
| CLS | Phenotype labels format | Associates samples with phenotypes; categorical or continuous [45] | |
| GMT, GMX, GRP | Gene set database formats | Contains gene set definitions and member genes [45] |
Proper data preparation is critical for successful GSEA implementation. The analysis requires four primary file types: (1) an expression dataset file (GCT, RES, PCL, or TXT format) containing normalized expression values; (2) a phenotype labels file (CLS format) defining sample classes; (3) a gene sets database file (GMT, GMX, or GRP format); and (4) optionally, a chip annotation file that maps platform-specific identifiers to standard gene symbols [45].
For bulk RNA-seq data, consistent feature identifiers across all files are essential. The recommended approach involves collapsing probe sets to genes using HGNC gene symbols, which requires setting the "Collapse/Remap to gene symbols" parameter to "Collapse" and providing an appropriate chip annotation file [45]. This approach eliminates multiple probes for the same gene that could inflate enrichment scores and facilitates biological interpretation [45].
Step-by-Step GSEA Execution Protocol
Data Loading and Validation: Load the expression dataset, phenotype labels, and gene sets database into GSEA. Verify that feature identifiers are consistent across files and that phenotype labels correctly correspond to samples [45].
Parameter Configuration: Set key analysis parameters including:
- Collapse/Remap to gene symbols: Set to "Collapse" for RNA-seq data using gene symbols [45]
- Number of permutations: 1000 permutations recommended for final analysis [43]
- Permutation type: "Phenotype" for sample sizes ≥7 per group [43]
- Gene set size filters: Exclude very small and very large gene sets (default: min=15, max=500)
- Enrichment statistic: Choose based on data characteristics (default: weighted)
Analysis Execution and Monitoring: Run GSEA and monitor progress through the Processes pane. For large datasets, this may take several hours depending on computational resources [45].
Result Review: Examine the index.html summary file to identify significantly enriched gene sets using the FDR < 0.25 threshold [43]. The results table displays key metrics including ES, NES, nominal p-value, and FDR for each gene set [21].
Leading Edge Analysis: For significantly enriched gene sets, use the GSEALeadingEdgeViewer to visualize leading edge subsets and their overlaps [44]. Identify core enriched genes that appear across multiple significant pathways.
Interpretation and Validation Framework
Biological Contextualization: Interpret results in the context of experimental hypotheses and known biology. Consider whether enriched pathways align with expected biological mechanisms.
Multiple Testing Consideration: Focus interpretation on gene sets meeting FDR thresholds rather than nominal p-values to minimize false discoveries [43].
Directional Interpretation: Remember that positive NES indicates enrichment in the first phenotype class, while negative NES indicates enrichment in the second phenotype class [21].
Technical Validation: Where possible, validate key findings using orthogonal methods such as qPCR for individual genes or functional assays for pathway activity.
Integration with Complementary Analyses: Combine GSEA results with other bioinformatics approaches such as weighted gene co-expression network analysis (WGCNA) or protein-protein interaction networks to identify convergent biological themes [46].
Troubleshooting and Quality Assessment
Common issues in GSEA implementation include failure to collapse datasets properly when using gene symbols, incorrect phenotype labeling, and insufficient sample sizes for phenotype permutation [45] [43]. When sample sizes are small (<7 per group), consider using gene_set permutation instead of phenotype permutation [43].
Quality assessment should include evaluation of expression dataset distributions, verification of proper gene identifier mapping, and confirmation that running enrichment plots show clear peaks rather than flat profiles. Additionally, check that positive control gene sets with known relevance to the biological system show expected enrichment patterns.
The GSEA software is continuously updated, with the current version (as of March 2025) being GSEA 4.4.0, which updates the platform for Java 21 compatibility [1]. Researchers should ensure they are using current versions and consult the GSEA website and user guide for the most up-to-date documentation and best practices [45].
Single-sample Gene Set Enrichment Analysis (ssGSEA) represents a pivotal methodological advancement in pathway enrichment analysis, enabling researchers to quantify pathway activity at the resolution of individual samples. Unlike classical GSEA, which requires pre-defined sample groups, ssGSEA calculates separate enrichment scores for each sample and gene set pair, transforming molecular profiling data into pathway-centric activity measures. This approach facilitates the characterization of cellular states in terms of biological process activities rather than individual gene expression levels, providing a more interpretable framework for understanding phenotypic diversity. Within the broader context of pathway analysis for bulk RNA-seq data research, ssGSEA offers unique capabilities for sample stratification, biomarker discovery, and translational applications in drug development.
Pathway enrichment analysis has become an indispensable computational method for interpreting gene lists generated from genome-scale (omics) experiments, helping researchers extract mechanistic insights from complex molecular data [6]. By identifying biological pathways that are statistically overrepresented in a gene list compared to what would be expected by chance, this approach effectively reduces dimensionality while enhancing biological interpretability [6].
Gene Set Enrichment Analysis (GSEA) stands as one of the pioneering and most widely used methods for pathway analysis [47]. Classical GSEA operates by determining whether an a priori defined set of genes shows statistically significant, concordant differences between two biological states (e.g., phenotypes) [45] [1]. It assesses the distribution of genes from a predefined set within a ranked list of all genes measured in an experiment, typically ranked by their correlation with a phenotype or by differential expression magnitude [45]. The method generates a single enrichment score per gene set that represents the degree to which that gene set is overrepresented at the extremes (top or bottom) of the ranked list.
However, classical GSEA has a fundamental limitation: it requires sample grouping and generates one enrichment score per gene set across each phenotype comparison. This constraint motivated the development of single-sample GSEA (ssGSEA), which extends the framework to enable calculation of separate enrichment scores for each pairing of a sample and gene set [48]. This transformation allows researchers to characterize cell state in terms of the activity levels of biological processes and pathways rather than through the expression levels of individual genes [48].
The ssGSEA Methodology
Conceptual Foundation
Single-sample GSEA (ssGSEA) represents an extension of the GSEA algorithm that projects each sample within a dataset onto a space of gene set enrichment scores [48]. Where traditional GSEA generates a gene set's enrichment score with respect to phenotypic differences across a collection of samples, ssGSEA calculates a separate enrichment score for each pairing of sample and gene set, independent of phenotype labeling [48]. In this manner, ssGSEA transforms a single sample's gene expression profile to a gene set enrichment profile [48].
A gene set's enrichment score in ssGSEA represents the activity level of the biological process in which the gene set's members are coordinately up- or down-regulated [48]. This transformation allows researchers to characterize cell state in terms of the activity levels of biological processes and pathways rather than through the expression levels of individual genes [48]. As a practical matter, ssGSEA essentially reduces the dimensionality of the dataset from tens of thousands of genes to hundreds or thousands of pathway features, creating a more biologically interpretable set of features for downstream analytical methods [48].
Algorithmic Approach
The ssGSEA algorithm employs a multi-step process to calculate enrichment scores for each sample and gene set pair:
Input Processing: The method begins with an expression dataset (typically in GCT file format) containing gene expression values across multiple samples [48].
Gene Ranking: For each sample, genes are ranked by their expression values in increasing order [49] [48].
Enrichment Score Calculation: The enrichment score (ES) is computed as the maximum deviation from zero of a weighted Kolmogorov-Smirnov running sum statistic, similar to classical GSEA but applied to individual samples [48].
Normalization: Various normalization methods can be applied, with "rank" being the default approach, which normalizes expression data through ranking [48].
The algorithm uses a weighting exponent (typically set to 0.75) that emphasizes genes at the extremes of the ranked list [48]. This default value was selected after extensive testing, and module authors strongly recommend against changing it [48].
Key Differences from Classical GSEA
Table 1: Comparison between Classical GSEA and ssGSEA
| Feature | Classical GSEA | Single-Sample GSEA (ssGSEA) |
|---|---|---|
| Input Requirements | Requires sample groups/phenotypes | Works on individual samples without group labels |
| Output | One enrichment score per gene set per phenotype comparison | One enrichment score per sample per gene set |
| Biological Interpretation | Identifies pathways differentially enriched between conditions | Quantifies pathway activity in individual samples |
| Data Transformation | Ranks genes based on correlation with phenotype | Ranks genes based on expression within each sample |
| Downstream Applications | Group comparison, pathway discovery | Sample stratification, biomarker development, clustering |
| Visualization | Enrichment plots, heatmaps across groups | Heatmaps of pathway activity across individual samples |
Computational Implementation
Software Availability and Tools
Several computational implementations of ssGSEA are available to researchers, each with distinct features and interfaces:
Table 2: Software Tools for ssGSEA Analysis
| Tool/Platform | Implementation | Key Features | Access Method |
|---|---|---|---|
| GenePattern | ssGSEAProjection module | Web-based interface, no programming required | Graphical user interface [48] |
| gseapy | Python package | Extensive customization, integration with Python data science stack | Command-line/Python API [50] |
| GSVA | R/Bioconductor package | Multiple single-sample methods including ssGSEA | R programming interface [51] |
| CKG | Analytics platform | Integrated with knowledge graph, visualization tools | Python API [49] |
| Omics Playground | Web platform | User-friendly interface, multiple enrichment methods | Graphical user interface [52] |
Parameter Optimization
Successful implementation of ssGSEA requires careful consideration of several key parameters:
Gene Set Sizes: Most implementations enforce minimum and maximum gene set sizes to ensure statistical robustness while avoiding overly broad categories. Typical defaults are minsize=15 and maxsize=500 [50], though the GenePattern module uses a default minimum of 10 [48].
Weighting Exponent: The exponential weight (typically 0.75) employed in the calculation of enrichment scores strongly influences results [48].
Normalization Method: Sample normalization method can be set to "rank", "log", or "log_rank" depending on the data characteristics [50] [48].
Permutation Testing: For significance estimation, permutation_num can be set to ≥1000, though default ssGSEA typically uses 0 permutations [50].
Experimental Protocol
Sample Preparation and Data Generation
The initial stages of ssGSEA analysis mirror standard transcriptomic workflows:
Sample Collection: Obtain biological samples of interest (e.g., tumor biopsies, cell lines, tissue specimens).
RNA Extraction: Isolate high-quality RNA using standardized protocols appropriate for the sample type.
Library Preparation and Sequencing: Prepare RNA-seq libraries using validated kits and sequence on an appropriate platform to obtain sufficient coverage.
Quality Control: Assess RNA integrity, library quality, and sequencing metrics to ensure data reliability.
Read Alignment and Quantification: Align sequencing reads to an appropriate reference genome and generate gene-level count data using tools like STAR, HISAT2, or Salmon.
Data Preprocessing Pipeline
Proper preprocessing is critical for robust ssGSEA results:
Data Normalization: Apply appropriate normalization for RNA-seq data (e.g., TPM, FPKM, or variance-stabilizing transformations) to account for technical variability [51].
Gene Filtering: Filter out genes with low expression across samples to reduce noise.
Format Conversion: Prepare expression data in a format compatible with the chosen ssGSEA implementation (e.g., GCT file for GenePattern).
Gene Set Selection: Curate appropriate gene sets from databases such as MSigDB, KEGG, Reactome, or custom collections [52].
ssGSEA Projection Protocol
The core ssGSEA analysis follows these steps:
Input Data Preparation:
- Expression dataset in GCT format
- Gene sets database in GMT format
- Parameter configuration
Algorithm Execution:
- Load expression data and gene sets
- Set analysis parameters (normalization method, weighting exponent, min/max gene set size)
- Run ssGSEA projection
Output Generation:
- Projected enrichment scores in GCT format
- Visualization and diagnostic plots
- Optional statistical significance estimates
Downstream Analysis Workflow
Following ssGSEA projection, several analytical approaches can extract biological insights:
Differential Pathway Analysis: Identify pathways with significantly different enrichment scores between sample groups using standard statistical tests.
Clustering Analysis: Group samples based on their pathway enrichment profiles to identify novel subtypes.
Correlation Analysis: Examine relationships between pathway activities and clinical variables or other molecular measurements.
Visualization: Create heatmaps, scatter plots, and other visualizations to represent pathway activity patterns.
Research Reagent Solutions
Table 3: Essential Research Reagents and Resources for ssGSEA Analysis
| Resource Type | Specific Examples | Function/Purpose |
|---|---|---|
| Gene Set Databases | MSigDB, KEGG, Reactome, GO, WikiPathways | Provide curated gene sets representing biological pathways and processes [6] [52] |
| Analysis Software | GenePattern, gseapy, GSVA, Omics Playground | Implement ssGSEA algorithm and provide user interfaces [50] [48] [52] |
| Annotation Resources | Chip annotation files, org.Mm.eg.db, org.Hs.eg.db | Enable mapping between gene identifiers and functional annotations [45] |
| Visualization Tools | Cytoscape, EnrichmentMap, Pathview, ggplot2 | Create publication-quality visualizations of enrichment results [12] [6] [52] |
| Benchmark Datasets | TCGA RNA-seq data, example datasets from GSEA website | Provide positive controls and performance validation [47] |
Applications in Drug Development
ssGSEA offers particular utility throughout the drug development pipeline:
Biomarker Discovery: By quantifying pathway activities in individual patient samples, ssGSEA enables identification of pathway-based biomarkers for patient stratification [48].
Mechanism of Action Elucidation: Analysis of pathway activities in drug-treated versus control samples can reveal the biological pathways modulated by therapeutic compounds.
Clinical Trial Stratification: Enrichment scores for key pathways can serve as inclusion criteria or stratification factors in clinical trials.
Drug Repositioning: Comparison of pathway activation signatures across disease states can identify new indications for existing drugs.
Troubleshooting and Best Practices
Common Challenges and Solutions
Unstable Scores with Small Sample Sizes: Some single-sample scoring methods can be unstable when fewer than 25 samples are available [51]. Consider alternative methods like "singscore" that demonstrate greater stability with limited samples [51].
Batch Effects: Technical artifacts can confound pathway activity measurements. Apply appropriate batch correction methods before ssGSEA analysis.
Gene Set Selection Bias: Results depend heavily on the quality and comprehensiveness of gene sets used. Utilize multiple gene set collections and consider custom-defined sets relevant to specific biological contexts.
Normalization Artifacts: Different normalization methods can produce varying results. Compare multiple approaches and select the most biologically plausible one.
Performance Optimization
Computational Efficiency: For large datasets, utilize tools with parallel processing capabilities (e.g., gseapy with multiple threads) to reduce computation time [50].
Memory Management: Pre-filter gene sets and expression matrices to remove unnecessary elements when working with memory-intensive datasets.
Reproducibility: Set random seeds for permutation tests and document all parameters and software versions used in analyses.
Visualizations
Workflow Diagram
Analytical Relationships Diagram
Future Directions
The field of single-sample pathway analysis continues to evolve with several promising developments:
Multi-omics Integration: Extending ssGSEA to incorporate proteomic, epigenomic, and metabolomic data for comprehensive pathway activity assessment.
Dynamic Pathway Modeling: Incorporating temporal dimensions to model pathway activity changes over time or in response to perturbations.
Single-Cell Applications: Adapting ssGSEA for single-cell RNA-seq data to explore pathway heterogeneity at cellular resolution.
Machine Learning Integration: Combining ssGSEA features with advanced machine learning models for improved predictive modeling and biomarker discovery.
As pathway enrichment analysis methodologies continue to mature, ssGSEA remains a powerful approach for transforming high-dimensional molecular data into biologically interpretable pathway activity measures, enabling deeper insights into disease mechanisms and therapeutic opportunities.
Gene Set Enrichment Analysis (GSEA) is a computational method that determines whether an a priori defined set of genes shows statistically significant, concordant differences between two biological states (e.g., phenotypes) [1]. Unlike traditional enrichment methods that require a hard threshold for defining differential expression, GSEA operates on a genome-wide ranked gene list, thereby capturing subtle but coordinated expression changes in biological pathways that might otherwise be missed [21]. The interpretation of GSEA results relies heavily on effective visualization strategies, which allow researchers to discern complex biological patterns from the data. This protocol details the creation of standardized enrichment plots and the construction of integrative pathway maps using EnrichmentMap, providing a comprehensive framework for analyzing bulk RNA-seq data within drug development and basic research contexts [53] [6].
Theoretical Foundation: Principles of GSEA
Core Concepts and Advantages
GSEA evaluates the distribution of a pre-defined gene set (e.g., a pathway from the Molecular Signatures Database, MSigDB) within a genome-wide gene list ranked by correlation with a phenotype [21] [6]. Its key advantage over hypergeometric test-based methods is that it does not require an arbitrary significance cutoff for differential expression. This allows it to detect situations where all genes in a pathway show a small but consistent change in expression, which can be biologically important but might not yield individually significant genes [21]. The analysis identifies leading-edge genes—the subset of genes that appear at the peak of the enrichment score plot—which are often the core contributors to the pathway's enrichment and represent prime candidates for further investigation [6].
The GSEA Algorithm: A Three-Step Process
The GSEA methodology consists of three major computational steps [21]:
- Calculation of the Enrichment Score (ES): The ES quantifies the degree to which a gene set is overrepresented at the extremes (top or bottom) of the ranked list. It is calculated by walking down the ranked list, increasing a running-sum statistic when a gene in the set is encountered and decreasing it otherwise. The ES is the maximum deviation from zero encountered during the walk.
- Estimation of Significance: The significance of the observed ES is estimated by comparing it to a null distribution generated by permuting the phenotype labels (or, for pre-ranked lists, the genes themselves) many times (e.g., 1000 permutations). This yields a nominal p-value.
- Multiple Hypothesis Testing Correction: Because multiple gene sets are tested simultaneously, the nominal p-values are adjusted to control the False Discovery Rate (FDR), resulting in a q-value. A gene set is generally considered significantly enriched if it meets thresholds of Nominal p-value < 0.05 and FDR q-value < 0.25 [21].
Experimental Protocols and Workflows
Data Input Preparation
The initial and critical step is preparing the correct input data. For GSEA, this involves creating a ranked gene list (RNK file). This is a two-column text file where the first column contains gene identifiers (e.g., official symbols, ENSEMBL IDs) consistent with those in the pathway database, and the second column contains a ranking metric [53]. Typically, this metric is the signal-to-noise ratio or log2 fold change from a differential expression analysis of bulk RNA-seq data. The gene list must be sorted in decreasing order of this metric [53] [54].
Diagram: GSEA workflow from RNA-seq data to results visualization.
Protocol: Running GSEA with the Desktop Application
This protocol uses the official GSEA desktop application and the MSigDB database [1] [53].
Software and Data Setup:
- Register and Download: Register for free on the GSEA-MSigDB website (gsea-msigdb.org) and download the GSEA Java desktop application (e.g., GSEA 4.4.0) [1].
- Install Java: Ensure Java Version 8 or higher is installed on your system [53].
- Load Data: Launch GSEA. Click "Load Data," browse to your project data folder, and select your RNK file and the appropriate pathway gene set file (in GMT format, e.g., from MSigDB). A success message will confirm the files are loaded [53].
Run GSEA Preranked Analysis:
- In the GSEA interface, navigate to "Run GSEAPreranked" under the "Tools" menu [53].
- Set the mandatory parameters:
gene set database: Your loaded GMT file.number of permutations: 1000 is standard for initial analysis.
- Click "Run" to execute the analysis. The tool may take several minutes to complete, depending on the dataset and GMT file size [53].
Protocol: Running GSEA in R with clusterProfiler
For users operating within the R/Bioconductor environment, clusterProfiler provides a powerful alternative [54].
Package Installation and Setup:
Data Preparation and Analysis:
Visualization of GSEA Results
Interpreting the Standard GSEA Enrichment Plot
The canonical GSEA plot is a multi-panel figure that provides a comprehensive view of a single enriched gene set [21].
- Top Panel - Enrichment Score (ES) Profile: This line graph plots the running enrichment score as the analysis progresses down the ranked gene list. The ES is the maximum point of the plot (the peak). The sign of the ES indicates the direction of enrichment; a positive ES means the gene set is enriched at the top of the list (correlated with the first phenotype), while a negative ES means it is enriched at the bottom (correlated with the second phenotype). The leading-edge subset comprises the genes that contribute to the ES peak [21].
- Middle Panel - Gene Set Members: This barcode-like plot marks the positions of the genes belonging to the gene set within the global ranked list. A cluster of lines at the top or bottom confirms the visual basis for the enrichment.
- Bottom Panel - Ranked List Metric: This plot shows the value of the ranking metric (e.g., log2 fold change) for all genes in the dataset, providing context for the gene ranking.
Diagram: Components of a standard GSEA enrichment plot.
Protocol: Creating an Enrichment Map in Cytoscape
An EnrichmentMap provides a powerful, high-level visualization of multiple enriched pathways and their relationships, overcoming the challenge of interpreting long lists of significant gene sets [53] [6].
Software and Installation:
- Download and install the latest version of Cytoscape.
- Within Cytoscape, go to
Apps -> App Storeand install the "EnrichmentMap Pipeline Collection," which includes EnrichmentMap, clusterMaker2, AutoAnnotate, and WordCloud [53].
Building the Map:
- Prepare the GSEA result file (the
gsea_report_*.xls). - In Cytoscape, go to
Apps -> EnrichmentMap -> Create Enrichment Map. - In the dialog box, load your GSEA result file as the "Enrichments (GMT/GMX/TXT)."
- Set the
Analysis Typeto "Generic/GSEA." - Load the same GMT gene set file used in the GSEA analysis under the "Gene Sets" tab.
- Click "Build" to generate the network.
- Prepare the GSEA result file (the
Interpreting and Enhancing the Map:
- Nodes: Represent enriched gene sets. The size is proportional to the number of genes in the set.
- Edges: Connect overlapping gene sets. The thickness is proportional to the overlap coefficient (Jaccard coefficient), indicating the number of shared genes.
- Clustering: Use
Apps -> clusterMaker2to automatically cluster highly interconnected nodes. - Annotation: Use
Apps -> AutoAnnotateto generate summary labels for each cluster based on the most common terms in the constituent gene sets, revealing broad biological themes.
Diagram: EnrichmentMap showing clustered pathways and their relationships.
Additional Visualizations with clusterProfiler
The clusterProfiler and enrichplot R packages offer a suite of visualization functions [54].
- Dot Plot: Displays the enrichment statistics (e.g., NES, q-value) for the top gene sets in a simple, comparable format.
- Ridge Plot: Shows the distribution of the ranking metric (log2 fold change) for genes in the top enriched gene sets, helping to interpret up/down-regulated pathways.
- Category Netplot (cnetplot): Depicts the linkages between genes and biological concepts as a network, which is helpful for seeing which specific genes are involved in multiple enriched pathways.
Table: Key software and data resources for GSEA and visualization.
| Resource Name | Type | Function / Description | Source / URL |
|---|---|---|---|
| GSEA Desktop App | Software | The primary, user-friendly Java application for running GSEA. | gsea-msigdb.org [1] |
| Molecular Signatures Database (MSigDB) | Database | A comprehensive, curated collection of gene sets for use with GSEA, including Hallmark, GO, and pathway sets. | gsea-msigdb.org [1] [6] |
| Cytoscape | Software | An open-source platform for complex network analysis and visualization. | cytoscape.org [53] [6] |
| EnrichmentMap | Cytoscape App | A Cytoscape app that automatically visualizes GSEA results as a network of overlapping gene sets. | Cytoscape App Store [53] |
| clusterProfiler | R Package | A powerful Bioconductor package for performing and visualizing GSEA and other enrichment analyses in R. | bioconductor.org [54] |
| STAGEs | Web Tool | An integrative web platform for visualization and pathway analysis (Enrichr & GSEA) without coding. | Scientific Reports, 2023 [55] |
| g:Profiler | Web Tool | A web-based tool for thresholded pathway enrichment analysis of flat gene lists. | biit.cs.ut.ee/gprofiler/ [53] [6] |
Table: Critical parameters for interpreting GSEA results.
| GSEA Result Metric | Description | Interpretation Guide |
|---|---|---|
| Enrichment Score (ES) | Reflects the degree to which a gene set is overrepresented at the top or bottom of the ranked list. | The sign indicates direction: Positive ES = enrichment in phenotype A (top of list). Negative ES = enrichment in phenotype B (bottom of list). |
| Normalized ES (NES) | The ES normalized for the size of the gene set, allowing for comparison across different gene sets. | Used to rank the results. A higher absolute NES indicates a stronger enrichment. |
| Nominal p-value | The statistical significance of the observed ES, estimated by permutation testing. | A standard threshold is p-value < 0.05. |
| FDR q-value | The p-value adjusted for multiple hypothesis testing to control the False Discovery Rate. | The standard threshold for significance in GSEA is FDR q-value < 0.25 [21]. A lower FDR indicates higher confidence. |
| Leading Edge | The subset of genes in the gene set that contribute most to the ES. | These are considered the core enriched genes and are often the most biologically relevant for follow-up studies [6]. |
Optimizing GSEA: Overcoming Common Pitfalls and Ensuring Robust Results
Gene Set Enrichment Analysis (GSEA) has become a cornerstone of functional interpretation in bulk RNA-sequencing (RNA-Seq) studies, allowing researchers to identify coordinated biological pathway changes from transcriptomic data. However, the reliability of GSEA findings is fundamentally constrained by the statistical power of the underlying differential expression analysis, which is directly dependent on biological replication. In contemporary research, practical and financial constraints often limit cohort sizes, creating a critical tension between experimental feasibility and biological reproducibility.
Recent investigations have revealed alarming evidence regarding the replicability of transcriptomic research. A comprehensive analysis involving 18,000 subsampled RNA-Seq experiments demonstrated that differential expression and enrichment analysis results from underpowered experiments are unlikely to replicate well [56]. This reproducibility crisis is particularly pronounced in preclinical research, where a large-scale replication project achieved only a 46% success rate when attempting to replicate 158 effects from 50 experiments in high-impact cancer biology papers [56]. Furthermore, a survey of available literature indicates that actual cohort sizes often fall short of recommended minimums, with approximately 50% of human RNA-Seq studies employing six or fewer replicates per condition, a figure that rises to 90% for non-human samples [56].
This Application Note examines how limited biological replication impacts GSEA findings and provides practical solutions to enhance the robustness of pathway analysis conclusions within the context of bulk RNA-Seq research.
Quantitative Evidence: The Impact of Cohort Size on Analytical Outcomes
Statistical Power and Replicability Metrics
Statistical power in RNA-Seq experiments naturally increases with biological replication, yet most studies operate with insufficient power. A survey by Baccarella et al. reports that about 50% of 100 randomly selected RNA-Seq experiments with human samples fall at or below six replicates per condition [56]. More generally, as much as half of biomedical studies have statistical power in the 0-20% range, well below the conventional standard of 80% [56].
Table 1: Recommended vs. Actual Cohort Sizes in RNA-Seq Studies
| Recommendation Source | Recommended Minimum Replicates | Typical Threshold | Evidence from Literature |
|---|---|---|---|
| Schurch et al. | 6 for robust DEG detection | FDR < 0.05 | Increases to 12 replicates to identify majority of DEGs for all fold changes [56] |
| Lamarre et al. | 5-7 | FDR 0.05-0.01 | Optimal FDR threshold is (2^{-n}) for replication number n [56] |
| Bacarella et al. | 7 | - | Cautioned against fewer due to high heterogeneity between analysis results [56] |
| Ching et al. | ~10 | 80% power | Dependent on data set characteristics; around ten needed for ≥80% power [56] |
| Actual Usage | 3-6 | - | 50% of human studies use ≤6 replicates; 90% of non-human studies use ≤6 [56] |
The consequences of underpowered designs are profound. Analysis of subsampled experiments reveals that while underpowered studies with few replicates lead to poorly replicable results, this does not necessarily mean the results are wrong. Depending on dataset characteristics, results may contain a large or small number of false positives [56]. Importantly, precision can remain high even when recall and replicability are low—10 out of 18 datasets achieved high median precision despite low recall and replicability for cohorts with more than five replicates [56].
Replicability Across Experimental Contexts
The reproducibility challenges extend across multiple research domains. In single-cell RNA-seq studies of neurodegenerative diseases, the replicability of differentially expressed genes (DEGs) varies substantially by condition. While DEGs from individual Parkinson's (PD), Huntington's (HD), and COVID-19 datasets had moderate predictive power for case-control status of other datasets, DEGs from Alzheimer's (AD) and Schizophrenia (SCZ) datasets had poor predictive power [57]. Strikingly, when using a strict FDR cutoff of 0.05, over 85% of the AD DEGs detected in one individual dataset failed to reproduce in any of the 16 others [57].
Table 2: Replicability of DEG Findings Across Disease Contexts
| Disease Context | Number of Studies | Replicability of DEGs | Notable Findings |
|---|---|---|---|
| Alzheimer's Disease | 17 snRNA-seq studies | Very low (<0.1% reproduced in >3 studies) | Over 85% of DEGs from one study failed to replicate in others [57] |
| Parkinson's Disease | 6 snRNA-seq studies | Moderate | Better predictive power than AD/SCZ [57] |
| Huntington's Disease | 4 snRNA-seq studies | Moderate | Better predictive power than AD/SCZ [57] |
| Schizophrenia | 3 snRNA-seq studies | Poor | Very few DEGs identified with strict FDR cutoff [57] |
| COVID-19 | 16 scRNA-seq studies | Moderate (positive control) | Known strong transcriptional response [57] |
Methodological Framework: Experimental Protocols for Robust GSEA
Bootstrap Resampling Procedure for Replicability Assessment
To assist researchers constrained by small cohort sizes in estimating expected performance, a simple bootstrapping procedure strongly correlates with observed replicability and precision metrics [56]. The following protocol provides a standardized approach:
Protocol 1: Bootstrap Resampling for Replicability Assessment
Input Preparation: Begin with your complete gene expression matrix (samples × genes) and phenotypic data defining experimental groups.
Subsampling Strategy: For a target cohort size N (where N is smaller than your actual sample size), randomly select N samples from each condition 100 times to create 100 subsampled experiments [56].
Differential Expression Analysis: For each subsampled experiment, perform differential expression analysis using your standard pipeline (e.g., DESeq2, edgeR, or limma).
GSEA Execution: Conduct Gene Set Enrichment Analysis for each differential expression result using your preferred gene set database (e.g., MSigDB, KEGG, Reactome).
Overlap Quantification: Calculate the Jaccard index or overlap coefficient for significant gene sets across the subsampled experiments:
- Jaccard index = |A ∩ B| / |A ∪ B|
- Where A and B represent significant gene sets from two subsampled experiments
Precision and Recall Estimation: Compare results from subsampled experiments to those derived from the full dataset (when available) or use stability metrics across subsamples.
Performance Prediction: Use the variance in results across bootstrap iterations to estimate expected replicability in future validation studies.
Figure 1: Bootstrap resampling workflow for assessing GSEA replicability. The process involves iterative subsampling of the original dataset followed by complete differential expression and enrichment analysis to quantify result stability.
Recall and Discrimination Evaluation for Pathway Analysis Methods
Beyond bootstrap resampling, the dual metrics of recall and discrimination provide a complementary approach to evaluate pathway analysis methods without reliance on unverified gold standards [58]:
Protocol 2: Recall and Discrimination Assessment
Recall Calculation:
- Randomly resample one large dataset consisting of many samples to form a group of smaller sub-datasets representing the same experimental condition
- Apply GSEA to both the original large dataset and the sub-datasets
- Calculate recall as the consistency of perturbed pathways identified in the original dataset versus sub-datasets
Discrimination Calculation:
- Use two large datasets from different conditions
- Resample each dataset as when calculating recall
- Measure the degree to which perturbed pathways identified in one experimental condition differ from those identified in another condition
Interpretation: Effective pathway analysis methods should demonstrate both high recall (consistency across same-condition datasets) and high discrimination (specificity across different conditions) [58].
Technical Considerations in GSEA Implementation
Pathway Database Selection and Granularity
The choice of pathway database significantly influences GSEA results, with effects that can dwarf those of statistical corrections. Studies demonstrate that alternative pathway definitions can alter enrichment p-values by up to nine orders of magnitude, whereas statistical corrections typically alter enrichment p-values by only two orders of magnitude [59].
The size and granularity of pathway definitions substantially impact enrichment statistics. Smaller, more specific pathway definitions (e.g., from EcoCyc) typically produce stronger enrichment p-values than larger, broader pathway definitions (e.g., from KEGG) [59]. To attain a given enrichment p-value, KEGG-based enrichment analyses require 1.3–2.0 times as many significantly expressed genes as EcoCyc-based analyses [59].
Table 3: Impact of Pathway Database Selection on Enrichment Results
| Database Attribute | Fine-Grained Databases (e.g., EcoCyc) | Broad Databases (e.g., KEGG) |
|---|---|---|
| Typical Pathway Size | Smaller pathways (e.g., 3-15 genes) | Larger pathways (e.g., 34-400 genes) |
| Biological Specificity | Clear correspondence to single biological processes | Often combine multiple biological processes (up to 21 in one KEGG pathway) |
| Enrichment p-values | Generally stronger for same number of significant genes | Generally weaker, requiring more genes for equivalent significance |
| Interpretability | High - results clearly point to specific processes | Lower - difficult to determine which subprocess is driving enrichment |
| Required Input | Fewer significantly expressed genes needed | 1.3-2.0× more genes needed for same p-value [59] |
Alternative Methods for Single-Sample Pathway Analysis
For studies with extremely limited sample sizes, single-sample pathway analysis methods offer an alternative approach. The Pathway Activation for Single Sample (PASS) framework utilizes pathway information in a single-sample way to better recognize differences between similar complex diseases [60]. This method:
- Constructs a fully connected network for each pathway
- Evaluates perturbation of edges caused by introduction of each disease sample
- Assesses statistical difference of gene expression between a single disease sample and normal samples
- Applies an AUCpath method to evaluate pathway activation from both node and edge perspectives [60]
This approach converts high-dimensional, small-sample gene expression matrices into PASS matrices that can be used for classification, potentially overcoming limitations of conventional GSEA with minimal samples.
Table 4: Research Reagent Solutions for Robust GSEA
| Resource Category | Specific Tools/Databases | Function/Purpose | Key Considerations |
|---|---|---|---|
| Pathway Databases | MSigDB, KEGG, Reactome, EcoCyc, Gene Ontology | Provide curated gene sets for enrichment analysis | Database choice significantly impacts results; consider granularity and biological accuracy [58] [59] |
| Differential Expression Tools | DESeq2, edgeR, limma | Identify significantly differentially expressed genes | Use pseudo-bulking approaches for single-cell data; select methods that control false discovery rates [57] |
| Enrichment Analysis Algorithms | GSEA, ORA, GSA, AFC | Identify enriched biological pathways | Methods vary in sensitivity/specificity; evaluate using recall and discrimination metrics [58] |
| Replicability Assessment | BootstrapSeq (custom scripts) | Estimate replicability of findings through resampling | Simple bootstrapping procedures correlate strongly with observed replicability [56] |
| Meta-Analysis Tools | SumRank (non-parametric) | Combine information across multiple datasets | Prioritizes DEGs with reproducible signals across datasets [57] |
Figure 2: Ecosystem of computational resources for robust GSEA. The workflow illustrates how various tools and databases interact throughout the analysis pipeline from raw data to interpretable, replicable results.
The replicability challenge in GSEA findings from small cohort sizes requires multifaceted solutions. Based on current evidence, we recommend:
Increase Biological Replication: Prioritize sample size over sequencing depth where possible, aiming for at least 10-12 replicates per condition for robust detection of differentially expressed genes [56].
Implement Resampling Validation: Apply bootstrap procedures to estimate replicability before proceeding with costly validation experiments [56].
Select Appropriate Pathway Databases: Choose databases with pathway granularity appropriate to your biological questions and interpret results in the context of database characteristics [59].
Utilize Meta-Analysis When Possible: Combine information across multiple datasets using methods like SumRank to identify robust signals [57].
Report Analytical Transparency: Clearly document all analytical choices including pathway databases, statistical thresholds, and reproducibility assessments.
These practices will enhance the reliability of GSEA findings and strengthen biological conclusions derived from transcriptomic studies with limited cohort sizes.
For researchers analyzing bulk RNA-seq data, a critical step following the identification of differentially expressed genes is pathway enrichment analysis. This approach helps determine whether predefined sets of biologically related genes show statistically significant, concordant differences between two biological states. The Molecular Signatures Database (MSigDB) has emerged as one of the most comprehensive resources for gene sets, currently containing over 35,000 annotated gene sets divided into nine major collections [61]. However, this very abundance creates a fundamental challenge: with thousands of overlapping and redundant gene sets available, researchers often face lengthy, repetitive enrichment results that obscure true biological signals rather than revealing them [33].
The MSigDB Hallmark (H) gene set collection was developed specifically to address this challenge. This collection consists of 50 refined gene sets that summarize and represent specific, well-defined biological states or processes while displaying coherent expression [61]. Unlike other collections derived from single sources, the hallmarks are generated through a hybrid approach that combines automated computational methods with manual expert curation, effectively reducing noise and redundancy while providing a better-delineated biological space for Gene Set Enrichment Analysis (GSEA) [33] [37].
Understanding MSigDB Collections: A Comparative Analysis
The MSigDB organizes its gene sets into distinct collections, each designed for specific analytical purposes. Understanding these categories is essential for selecting the most appropriate gene sets for a given research question.
Table 1: MSigDB Human Gene Set Collections
| Collection | Number of Gene Sets | Description | Primary Use Cases |
|---|---|---|---|
| H (Hallmark) | 50 | Refined sets representing specific well-defined biological states/processes with coherent expression | General-purpose enrichment analysis; ideal starting point |
| C1 (Positional) | 302 | Genes grouped by their location on human chromosomes | Identifying regional effects (e.g., chromosomal amplifications, deletions) |
| C2 (Curated) | 7,561 | Curated from online pathway databases and literature | Detailed investigation of specific pathways or perturbations |
| C3 (Regulatory) | 3,713 | Potential targets of regulation by transcription factors or microRNAs | Studying transcriptional and post-transcriptional regulation |
| C4 (Computational) | 1,006 | Defined by mining cancer-oriented expression data | Cancer-focused research; identifying cancer-specific signatures |
| C5 (Ontology) | 16,228 | Genes annotated by the same Gene Ontology (GO) term | Comprehensive GO term enrichment analysis |
| C6 (Oncogenic) | 189 | Signatures of cellular pathways often dysregulated in cancer | Oncology research; identifying dysregulated cancer pathways |
| C7 (Immunologic) | 5,219 | Cell states and perturbations within the immune system | Immunology studies; characterizing immune responses |
| C8 (Cell Type) | 866 | Curated cluster markers from single-cell sequencing studies | Cell type identification and characterization |
The Hallmark collection occupies a unique position within this ecosystem. While the C2 (Curated) and C5 (Ontology) collections can contain thousands of gene sets with substantial redundancy, the Hallmark collection provides a distilled set of coherent signatures that effectively summarize most of the relevant biological information from their "founder" sets [33] [62]. For instance, the HALLMARKEPITHELIALMESENCHYMALTRANSITION gene set consolidates information from 107 original gene sets, while HALLMARKINTERFERONGAMMARESPONSE incorporates signals from 82 founder sets [33].
The Hallmark Advantage: Scientific Rationale and Generation Methodology
Addressing Redundancy and Heterogeneity
The Hallmark gene set collection was developed to overcome two significant challenges in large-scale gene set databases: redundancy and heterogeneity. Redundancy occurs when multiple gene sets share substantial overlap in their gene membership or represent similar biological processes, leading to repetitive enrichment results that can dominate analysis outputs and obscure other relevant findings [33]. Heterogeneity refers to the inconsistent behavior of genes within a single set, which can result from context dependencies, multiple biological response modalities, or limitations in the original curation process [33].
The Hallmark approach addresses these issues by creating gene sets that emphasize coordinate expression - genes that consistently behave in a synchronized manner across multiple experimental contexts. This ensures that each Hallmark gene set represents a robust, consistently observable biological state or process rather than an artificially constructed grouping based solely on annotation or literature mining.
Generation Protocol: Computational Refinement and Expert Curation
The generation of Hallmark gene sets follows a rigorous multi-step protocol that combines computational methods with biological expertise:
Cluster Identification: The process began with 8,380 gene sets from MSigDB collections C1-C6. Using consensus clustering based on gene membership overlaps, these were grouped into 600 clusters [33].
Expert Annotation: Researchers manually reviewed these clusters and annotated 43 of them with 50 clear biological themes. Seven clusters were assigned to two themes due to the heterogeneity of their founder gene sets [33].
Raw Set Formation: For each candidate hallmark, a "raw" gene set was defined as the union of all gene sets within its associated cluster [33].
Expression-Based Refinement: Each raw set was refined using gene expression profiles from datasets relevant to the corresponding biological theme. This step excluded genes that did not effectively discriminate the relevant phenotype, retaining only coordinately expressed and biologically relevant genes [33].
Independent Validation: A final validation procedure determined whether each refined hallmark performed as expected in independent datasets not used during the refinement process [33].
This hybrid methodology produced 50 Hallmark gene sets derived from 4,022 of the original 8,380 MSigDB gene sets, effectively consolidating biological information while enhancing analytical specificity [33].
Diagram 1: Hallmark Gene Set Generation Workflow. This four-phase process combines computational methods with expert curation to produce biologically coherent gene signatures.
Table 2: Representative Hallmark Gene Sets and Their Founder Set Composition
| Hallmark Name | Process Category | Number of Founder Sets | Number of Genes | Biological Description |
|---|---|---|---|---|
| HALLMARKEPITHELIALMESENCHYMAL_TRANSITION | Development | 107 | 200 | Genes defining the transition from epithelial to mesenchymal states |
| HALLMARKINTERFERONGAMMA_RESPONSE | Immune | 82 | 200 | Genes responsive to interferon-gamma signaling |
| HALLMARKINTERFERONALPHA_RESPONSE | Immune | 82 | 97 | Genes responsive to interferon-alpha signaling |
| HALLMARK_APOPTOSIS | Pathway | 80 | 161 | Genes involved in programmed cell death |
| HALLMARK_ANGIOGENESIS | Development | 14 | 36 | Genes involved in blood vessel formation |
| HALLMARKOXIDATIVEPHOSPHORYLATION | Metabolic | 93 | 200 | Genes involved in mitochondrial ATP production |
| HALLMARK_GLYCOLYSIS | Metabolic | 87 | 200 | Genes involved in glycolytic pathway |
| HALLMARKDNAREPAIR | DNA Damage | 44 | 150 | Genes involved in DNA repair mechanisms |
| HALLMARKAPICALJUNCTION | Cellular Component | 37 | 200 | Genes defining apical junction complex |
Practical Application: Implementing Hallmark Analysis in Bulk RNA-seq Studies
Experimental Protocol: Hallmark-Based GSEA
Implementing a hallmark-based GSEA involves a structured workflow that transforms raw RNA-seq data into biologically interpretable results:
Table 3: Key Research Reagent Solutions for Hallmark GSEA
| Resource | Type | Function | Access Information |
|---|---|---|---|
| MSigDB Hallmark Collection | Gene Set Database | Provides 50 refined biological signatures for enrichment testing | Available at gsea-msigdb.org after registration |
| GSEA Software | Analysis Platform | Performs gene set enrichment analysis using various algorithms | Java application downloadable from Broad Institute |
| fgsea R Package | Computational Tool | Fast implementation of GSEA algorithm for large datasets | Available via Bioconductor |
| msigdbr R Package | Data Interface | Provides MSigDB gene sets in R-friendly data frame format | Available via CRAN |
| clusterProfiler | Analysis Package | Comprehensive tool for enrichment analyses in R | Available via Bioconductor |
Step 1: Data Preparation and Quality Control Begin with a processed bulk RNA-seq dataset containing normalized gene expression values (typically TPM, FPKM, or variance-stabilized counts) and sample phenotype labels. Ensure proper normalization and batch effect correction have been applied. The dataset should include gene identifiers that can be mapped to standard gene symbols (e.g., HGNC) [52].
Step 2: Differential Expression Analysis Perform differential expression analysis between experimental conditions using appropriate statistical methods (e.g., DESeq2, edgeR, or limma). Generate a ranked list of genes based on their differential expression metrics. The ranking metric can be signal-to-noise ratio, t-statistic, or fold change, but must incorporate both the magnitude and significance of expression changes [52] [63].
Step 3: Gene Set Enrichment Analysis Implementation Execute the GSEA algorithm using the ranked gene list and the Hallmark gene set collection. The core GSEA method determines whether members of a gene set are randomly distributed throughout the ranked list or primarily found at the top or bottom [1]. Key parameters include:
- Number of permutations (typically 1,000)
- Enrichment statistic (weighted or classic)
- Metric for ranking genes
Step 4: Results Interpretation and Multiple Testing Correction Analyze the enrichment scores (ES), normalized enrichment scores (NES), and false discovery rates (FDR) for each Hallmark gene set. Hallmark sets with FDR < 0.25 are generally considered significant, though more stringent thresholds (FDR < 0.05) may be appropriate for confirmatory studies [1]. Focus on both the statistical significance and the direction of enrichment (positive or negative NES) to interpret biological activation or suppression.
Step 5: Validation and Cross-Reference For significant hallmark hits, investigate the corresponding founder sets in MSigDB to obtain more detailed biological context. This hierarchical approach allows researchers to move from general biological themes (hallmarks) to specific mechanisms and pathways [37].
Workflow Visualization: From RNA-seq Data to Biological Insight
Diagram 2: End-to-End Hallmark GSEA Workflow for Bulk RNA-seq Data. This analytical pipeline transforms raw expression data into biologically interpretable results using the curated Hallmark collection.
Case Study: Hallmark Analysis in Cancer Research
To illustrate the practical utility of the Hallmark collection, consider a pan-cancer analysis of survival-associated genes across 12 solid tumor types [64]. Researchers consolidated data from seven projects to identify 6,763 genes associated with 10 cancer hallmarks, then performed enrichment analysis of prognostic genes.
The analysis revealed distinct patterns of hallmark activation across cancer types:
- "Tissue invasion and metastasis" was most prominent in stomach, pancreatic, bladder, and ovarian cancers
- "Sustained angiogenesis" was significantly enriched in lung squamous cell carcinomas
- "Genome instability" showed strong enrichment in lung adenocarcinomas and cancers of the liver, pancreas, and kidney
- Pancreatic cancers displayed the highest enrichment of multiple hallmarks, emphasizing the disease's complexity
- In melanomas and cancers of the liver, prostate, and kidney, a single hallmark was enriched among prognostic survival markers [64]
This application demonstrates how the Hallmark collection enables clear biological interpretation across diverse cancer types, revealing both common and unique pathway activations that might be obscured when using larger, more redundant gene set collections.
Best Practices and Strategic Recommendations
When to Use the Hallmark Collection
The Hallmark gene set collection is particularly advantageous in these scenarios:
- Initial Exploratory Analysis: As a first pass through transcriptomic data to identify major biological themes without being overwhelmed by redundant results [37]
- Multi-study Comparisons: When integrating results across multiple experiments or datasets, where consistent biological themes are more valuable than highly specific mechanisms
- Hypothesis Generation: In discovery-phase research where the goal is to identify promising biological directions for further investigation
- Educational Contexts: When teaching concepts of pathway analysis, as the limited number of non-redundant sets simplifies interpretation
Complementary Use with Other MSigDB Collections
For comprehensive analysis, researchers should adopt a hierarchical approach:
- Begin with the Hallmark collection to identify overarching biological themes
- For significant hallmarks, investigate the corresponding C2 (Curated) and C5 (Ontology) founder sets to elucidate specific mechanisms
- Use C6 (Oncogenic) and C4 (Computational) collections for cancer-specific investigations
- Employ C7 (Immunologic) sets for studies involving immune responses or immunotherapy
- Utilize C8 (Cell Type) signatures when deconvoluting cellular heterogeneity in bulk RNA-seq data
Methodological Considerations
- Sample Size: GSEA generally requires at least 5-7 samples per phenotype for reliable results
- Ranking Metric Selection: The choice of gene ranking metric (signal-to-noise ratio, t-statistic, fold change) can influence results; consider trying multiple metrics for robust findings
- Visualization: Use enrichment plots to verify the distribution of gene set members across the ranked list and avoid relying solely on numerical scores
- Multiple Testing: Apply appropriate FDR corrections, recognizing that the Hallmark collection's limited size (50 sets) reduces the severity of multiple testing corrections compared to larger collections
The MSigDB Hallmark gene set collection represents a significant advancement in gene set enrichment methodology, addressing fundamental challenges of redundancy and heterogeneity that plague larger collections. Through its sophisticated generation process combining computational refinement with expert curation, the Hallmark collection provides researchers with a powerful tool for extracting clear biological signals from complex transcriptomic data.
For the drug development professional, these refined signatures offer a more reliable foundation for identifying pathway-level drug effects, understanding mechanism of action, and discovering biomarkers. For the basic researcher, they provide a coherent framework for interpreting bulk RNA-seq data in the context of established biological processes. As a starting point for exploration and a reference point for validation, the Hallmark collection has established itself as an indispensable resource in the genomic analysis toolkit.
The strategic application of these gene sets within a hierarchical analytical framework - moving from hallmarks to specific founder sets - enables researchers to balance biological breadth with mechanistic specificity, ultimately accelerating the translation of genomic data into biological insight and therapeutic innovation.
Gene Set Enrichment Analysis (GSEA) is a computational method that determines whether an a priori defined set of genes shows statistically significant, concordant differences between two biological states [1]. Unlike methods that focus on individual genes, GSEA evaluates changes in expression at the level of defined gene sets, such as pathways or ontological categories, providing a more biologically interpretable analysis of genome-wide expression data [6]. This approach is particularly valuable for bulk RNA-seq studies where coordinated subtle changes across multiple genes in a pathway may be biologically important but fail to reach significance when genes are considered individually [17] [6].
The power and accuracy of GSEA depend critically on appropriate parameter selection. This application note provides detailed protocols and best practices for three fundamental parameters in GSEA: permutation type, normalization mode, and scoring scheme. Proper configuration of these parameters ensures that results reflect true biological signals rather than analytical artifacts, making parameter selection a crucial step in pathway analysis of bulk RNA-seq data.
Core GSEA Parameters: Theoretical Foundations and Practical Considerations
Permutation Type: Gene Set versus Phenotype
The permutation type determines how the null distribution is generated for statistical testing in GSEA. This choice fundamentally affects the validity of enrichment p-values.
- Gene Set Permutation: This approach creates the null distribution by randomly permuting gene labels while preserving the correlation structure of the expression data. It is the default and only option in GSEA Preranked [65] and is generally more appropriate for RNA-seq data where the number of samples may be limited.
- Phenotype Permutation: This method creates the null distribution by permuting sample labels (phenotypes) while maintaining the complete gene set structure. This approach preserves gene-gene correlations but requires an adequate number of samples (typically ≥7 per group) to generate a sufficient number of possible permutations [66].
Table 1: Comparison of Permutation Types in GSEA
| Permutation Type | Methodology | Minimum Sample Requirements | Advantages | Limitations |
|---|---|---|---|---|
| Gene Set | Permutes gene labels across gene sets | No strict minimum | Robust with small sample sizes; only option for preranked analysis | May lose gene-gene correlation structure |
| Phenotype | Permutes sample labels between phenotypes | ~7 per group recommended | Preserves gene-gene correlations; more biologically accurate null distribution | Requires adequate sample size for sufficient permutations |
Normalization Mode: Mean Division versus None
Normalization mode controls whether enrichment scores (ES) are adjusted to account for differences in gene set size and composition.
- Mean Division (meandiv): This is the default and recommended normalization mode [65]. It normalizes the enrichment score for each gene set by accounting for the number of genes in the set, generating a Normalized Enrichment Score (NES). The NES enables valid comparison of enrichment scores across gene sets of different sizes, as it reflects the degree of enrichment relative to what might be expected by chance for a set of that size.
- None: When normalization is turned off, the analysis reports the raw enrichment score (ES) without adjustment for gene set size. This mode is generally not recommended for comparative analyses, as larger gene sets tend to produce higher absolute enrichment scores simply due to their size, potentially leading to misinterpretation of results.
Scoring Scheme: Weighted versus Classic Enrichment Statistics
The scoring scheme (also referred to as the enrichment statistic) determines how genes contribute to the running sum calculation that generates the enrichment score.
- Weighted (p=1): This is the default scoring scheme [65]. It uses a weighted Kolmogorov-Smirnov-like statistic that increments the running sum by the absolute value of the ranking metric when a gene belongs to the set. This approach gives more weight to genes that are more strongly correlated with the phenotype, making it particularly sensitive to pathways where the most significant genes show coordinated expression changes.
- Classic (p=0): This scheme uses a standard Kolmogorov-Smirnov statistic that increments the running sum by a fixed amount for each gene in the set, regardless of its ranking metric value. This more conservative approach may be preferable when the ranking metric does not intuitively support the weighted approach or when you want to reduce the influence of extreme outliers [65].
- Other weighted schemes: Intermediate values (e.g., p=1.5, p=2) are also available, which provide a spectrum between the classic and fully weighted approaches.
Table 2: Scoring Schemes in GSEA
| Scoring Scheme | Parameter Value | Application | Effect on Analysis |
|---|---|---|---|
| Classic | p=0 | Conservative analysis; ranking metric doesn't support weighting | All genes in set contribute equally to enrichment score |
| Weighted | p=1 | Default [65]; most common usage for expression data | Genes with stronger correlations contribute more to enrichment score |
| Weighted_p1.5 | p=1.5 | Moderate weighting; balance between sensitivity and conservatism | Intermediate weighting of gene contributions |
| Weighted_p2 | p=2 | Strong weighting; emphasis on top-ranking genes | Strongest emphasis on genes with highest ranking metric values |
Experimental Protocols for Parameter Optimization
Protocol 1: Standard GSEA with Phenotype Permutation
This protocol is designed for datasets with sufficient sample size (≥7 per group) and uses the most biologically accurate permutation approach.
Input Requirements:
- Expression dataset in GCT format
- Phenotype labels in CLS format
- Gene set database in GMT format
Procedure:
- Data Preparation: Format your normalized RNA-seq count data as a GCT file and phenotype labels as a CLS file.
- Parameter Configuration:
permutation_type:phenotypenormalization_mode:meandivscoring_scheme:weightedmin_size:15(exclude gene sets smaller than this)max_size:500(exclude gene sets larger than this)
- Execution: Run GSEA with 1000 permutations for robust p-value estimation.
- Validation: Check that the number of distinct permutations possible with your sample size exceeds the number of permutations performed.
Protocol 2: PreRanked GSEA with Gene Set Permutation
This protocol is designed for datasets with limited sample size or when using custom ranking metrics.
Input Requirements:
- Pre-ranked gene list in RNK format (e.g., from differential expression analysis)
- Gene set database in GMT format
Procedure:
- Generate Ranked List: Create an RNK file containing genes ranked by a relevant statistic (e.g., log2 fold change, t-statistic, or -log10(p-value) from differential expression analysis).
- Critical Validation: Ensure the ranked list contains no duplicate ranking values, as these may lead to arbitrary gene ordering and erroneous results [65].
- Parameter Configuration:
permutation_type:gene_set(only option for preranked)normalization_mode:meandivscoring_scheme:weighted(orclassicif ranking metric doesn't support weighting)min_size:15max_size:500
- Execution: Run GSEAPreranked with 1000 permutations.
- Result Interpretation: Focus on Normalized Enrichment Scores (NES) and FDR q-values rather than raw enrichment scores.
Table 3: Key Research Reagent Solutions for GSEA
| Resource Category | Specific Tools/Databases | Function and Application |
|---|---|---|
| Gene Set Databases | MSigDB (Molecular Signatures Database) [1] [7] | Comprehensive collection of annotated gene sets including Hallmark, GO, KEGG, and Reactome pathways |
| Analysis Software | GSEA Desktop (Broad Institute) [1], clusterProfiler [17], GSEApy [50] | Implementations of GSEA algorithm with user-friendly interfaces and programming APIs |
| Ranking Metrics | Signal-to-Noise Ratio, Moderated Welch Test, Absolute T-statistic [66] | Metrics for gene ranking; choice significantly impacts results and should match experimental design |
| Visualization Tools | Cytoscape with EnrichmentMap [6] | Network-based visualization of enrichment results showing relationships between enriched pathways |
| Data Resources | KEGG, Reactome, WikiPathways, Gene Ontology [6] [7] | Source pathway databases providing biologically annotated gene sets for enrichment analysis |
Advanced Considerations and Troubleshooting
Ranking Metric Selection
The choice of ranking metric significantly impacts GSEA results. Different metrics show varying sensitivity and false positive rates [66]:
- Absolute value of Moderated Welch Test statistic: Shows best overall sensitivity
- Minimum Significant Difference: Provides best overall specificity
- Absolute value of Signal-To-Noise ratio: Balanced performance with stability across sample sizes
- Baumgartner-Weiss-Schindler test statistic: Preferred when many genes show non-normal distributions
Gene Set Size Filtering
Appropriate gene set size filtering is crucial for meaningful results:
- Minimum size: Exclude gene sets with fewer than 15 genes after filtering for genes present in your dataset [65] [50] [7]. Oversmall sets lack statistical power.
- Maximum size: Exclude gene sets with more than 500 genes [65] [50]. Overly broad sets may lack biological specificity and produce less interpretable results.
Technical Validation and Quality Control
- Preliminary runs: Start with a small number of permutations (e.g., 10) to verify that your analysis will complete successfully before running the full analysis with 1000 permutations [65].
- Background definition: For preranked analysis, ensure your background gene list is appropriate for your experimental context.
- Multiple testing correction: Always use FDR q-values rather than nominal p-values to account for testing multiple gene sets simultaneously.
Proper parameter selection in GSEA—particularly permutation type, normalization mode, and scoring scheme—is essential for generating biologically meaningful and statistically robust results in bulk RNA-seq studies. The protocols and best practices outlined here provide researchers with a framework for optimizing these parameters based on their specific experimental design and biological questions. As GSEA continues to evolve, maintaining rigorous standards for parameter selection will ensure that pathway enrichment analysis remains a powerful tool for extracting biological insight from high-throughput genomic data.
In the analysis of bulk RNA-seq data, Gene Set Enrichment Analysis (GSEA) has emerged as a cornerstone for translating differential gene expression results into biologically meaningful insights. By evaluating the coordinated behavior of pre-defined groups of genes, GSEA moves beyond single-gene analysis to reveal systemic changes in biological processes, molecular functions, and cellular components. However, a significant challenge arises during the interpretation phase: redundancy in results [67]. It is common for GSA to generate extensive lists of hundreds or even thousands of significant gene sets, many of which represent highly overlapping biological processes due to the interconnected nature of underlying biological knowledge bases like the Gene Ontology (GO) [38]. This redundancy, where multiple significant gene sets reflect similar underlying biological signals, can obscure true biological insights and complicate the derivation of actionable conclusions, particularly for researchers in drug development who require clear, interpretable results for decision-making. This Application Note details practical strategies and protocols to address this redundancy, enabling more efficient and accurate biological interpretation of GSEA results.
Redundancy in GSEA outputs primarily stems from the structure of the gene set databases themselves. In the Gene Ontology, for instance, terms are organized in a directed acyclic graph, where parent terms encompass multiple more specific child terms. Consequently, a strong differential expression signal in a specific biological process can lead to the significant enrichment of that specific term, all its parent terms, and several related sibling terms, creating a long list of what are effectively repeated findings.
There are two main types of redundancy analysts encounter:
Database Structural Redundancy: This is inherent to the knowledgebase. For example, the GO biological process term "immune response" (GO:0006955) is a parent of "inflammatory response" (GO:0006954). A strong inflammatory signal in the data will likely cause both terms to appear as significant. The Molecular Signatures Database (MSigDB) is a comprehensive resource containing several distinct collections, and the same biological pathway may be represented in multiple collections (e.g., C2: curated genesets and C5: GO genesets), further contributing to result inflation [7] [38].
Methodological Redundancy: This occurs when analysts run multiple similar tests or use different statistical thresholds, generating several slightly different lists of significant gene sets that need to be integrated and reconciled. Furthermore, some gene set testing methods, particularly Over-Representation Analysis (ORA), treat each gene set as an independent unit, disregarding the known relationships between them, which exacerbates the challenge of seeing the "big picture" [38].
Table 1: Common Sources of Redundancy in Gene Set Analysis
| Source Category | Description | Example |
|---|---|---|
| Hierarchical Relationships | Parent-child term relationships in structured ontologies like GO. | "immune system process" and its child "immune response" both appear as significant. |
| Semantic Similarity | Different terms that describe highly similar biological concepts. | "cell proliferation" and "cell growth" may be simultaneously enriched. |
| Cross-Database Overlap | The same pathway is represented in multiple database sources. | KEGG's "Apoptosis" pathway and GO's "Apoptotic process" (GO:0006915). |
| Gene Overlap | Different gene sets share a substantial number of member genes. | Signaling pathways that share common upstream regulators or downstream effectors. |
Computational Strategies and Tools for Redundancy Reduction
Tool-Specific Functionalities: GeneSetCluster 2.0
GeneSetCluster is an R package specifically designed to summarize and integrate GSA results, addressing redundancy directly. Its version 2.0 introduces major enhancements for this purpose [67]. The core of its approach involves calculating a similarity matrix between all significant gene sets, typically based on the Jaccard index or overlap coefficient of their constituent genes. This matrix is then used to cluster the gene sets.
Key functionalities for redundancy management in GeneSetCluster 2.0 include:
- "Unique Gene-Sets" Methodology: This is a critical feature for handling duplicates. When the same gene set (e.g., the same GO ID) appears multiple times in results from different contrasts or databases, it can bias clustering. This method merges these duplicates into a single entity containing the union of all genes associated with them, ensuring each biological entity is represented only once during clustering [67].
- BreakUpCluster: This function allows for targeted refinement. After an initial clustering, a user can select a large, potentially heterogeneous cluster and re-cluster it to identify finer, more coherent sub-groupings, thus improving interpretability [67].
- Seriation-Based Clustering: This algorithm reorders the results and the similarity matrix to produce a more interpretable visualization where similar gene sets are positioned adjacent to one another, making patterns easier to identify [67].
The following workflow diagram illustrates the process of using GeneSetCluster to address redundancy.
Alternative Approaches and Tools
Beyond GeneSetCluster, other established strategies exist.
- Slim Ontologies: GO Slim is a condensed version of the Gene Ontology that contains a reduced number of high-level, broad terms. Mapping a long list of significant GO terms to a GO Slim vocabulary provides a high-level summary of the results, effectively collapsing many specific terms into a few broad categories [38].
- Semantic Similarity Analysis: Tools like GOSemSim or REVIGO calculate the semantic similarity between GO terms based on their relational distance in the ontology graph. They can then cluster similar terms or select a representative subset of terms, reducing the list to a more manageable size while preserving core biological information [38].
- Leveraging the MSigDB Hallmark Collection: The Hallmark gene set collection within MSigDB is a curated resource of 50 well-defined gene sets that represent specific, well-delineated biological states or processes. These gene sets are generated by condensing and refining thousands of overlapping gene sets from other MSigDB collections. Using the Hallmark collection for GSEA from the outset often produces less redundant and more interpretable results [38].
Table 2: Comparison of Computational Tools for Addressing Redundancy
| Tool/Approach | Core Methodology | Input Required | Key Advantage | Considerations |
|---|---|---|---|---|
| GeneSetCluster | Clustering based on gene overlap | List of gene sets and their genes | Integrates results from multiple contrasts/databases; allows sub-clustering. | Requires programming expertise (R); web app available for non-programmers [67]. |
| REVIGO | Semantic similarity analysis | List of significant GO terms | Web-based and user-friendly; provides intuitive visualizations (treemaps). | Primarily focused on GO terms; does not integrate other database sources. |
| GO Slim | Mapping to a broad ontology | List of significant GO terms | Provides a very high-level summary; easy to implement. | Loses granularity and specific biological insights. |
| MSigDB Hallmark | Pre-defined, non-redundant sets | RNA-seq gene expression data | Proactive redundancy avoidance; biologically curated and interpreted. | Fixed set of 50 pathways; may not cover all biological areas of interest. |
A Step-by-Step Protocol for Redundancy Reduction
This protocol outlines a comprehensive workflow for interpreting a long list of significant gene sets, from initial processing to final biological interpretation.
Protocol: An Integrated Workflow Using GeneSetCluster and Complementary Tools
Step 1: Data Preparation and Input
- Begin with the output from your GSEA (e.g., from tools like fgsea or GSEA software). You will need a list of significant gene sets, their statistical scores (e.g., p-value, FDR), and the constituent genes for each set.
- Combine results from different contrasts (e.g., different drug treatments vs. control) or different databases (e.g., GO, KEGG, Reactome) into a single input file formatted for GeneSetCluster.
- Quality Control Filter: Remove any gene sets that have a very low number of genes (e.g., <10-15) overlapping with your measured dataset, as these can yield unreliable results [7].
Step 2: Initial Clustering with GeneSetCluster
- Load the data into the GeneSetCluster R package or the user-friendly web application.
- Choose the "Unique Gene-Sets" method to merge any gene sets with identical identifiers, preventing bias from duplicates [67].
- Execute the primary clustering analysis. GeneSetCluster will use a relative risk metric and hierarchical clustering to group gene sets. Use the provided diagnostics (e.g., silhouette analysis) to guide the selection of an appropriate number of clusters.
Step 3: Visualization and Iterative Refinement
- Generate the primary visualizations: the heatmap (often with seriation), the network diagram, and the dendrogram.
- Identify large, dense clusters that may contain multiple biological themes. Use the
BreakUpClusterfunction to perform sub-clustering on these specific clusters of interest. This step may be repeated iteratively until coherent clusters are achieved [67].
Step 4: Biological Interpretation and Annotation
- For each final cluster, extract the member gene sets. The goal is to find a common biological theme that unites them.
- Manually inspect the gene sets within a cluster and their shared genes. Use this information to assign a descriptive, biologically meaningful label to the entire cluster (e.g., "Oxidative Phosphorylation Cluster," "Inflammatory Response Cluster").
- GeneSetCluster 2.0 can automatically associate clusters with relevant tissues and biological processes for human and mouse data, providing a valuable starting point for this annotation [67].
Step 5: Validation and Reporting
- The final output is a summarized table of clusters, their annotated themes, and their collective statistical significance (e.g., the most significant p-value within the cluster, or a combined metric).
- Report these consolidated clusters as the core results of your pathway analysis. The supporting visualizations from Step 3 should be included to demonstrate the relationships between gene sets.
Successful redundancy reduction and pathway interpretation rely on a combination of software tools, data resources, and computational environments. The following table details key components of the analytical toolkit.
Table 3: Essential Research Reagents and Resources for Redundancy Analysis
| Category | Item/Resource | Description and Function |
|---|---|---|
| Software & Packages | GeneSetCluster 2.0 (R package/Shiny App) | Primary tool for clustering and integrating gene sets from multiple GSA results [67]. |
| fgsea (R package) | A fast algorithm for pre-ranked GSEA, often used to generate the initial list of significant gene sets [7]. | |
| GOSemSim / REVIGO | Tools for measuring semantic similarity among GO terms and simplifying GO term lists [38]. | |
| Gene Set Databases | MSigDB | The Molecular Signatures Database; a comprehensive collection of gene sets for GSEA. The Hallmark collection is specifically designed for reduced redundancy [7] [38]. |
| Gene Ontology (GO) | The definitive source for ontology terms and annotations. The base for many redundancy-reduction methods [38]. | |
| KEGG / Reactome | Curated pathway databases providing detailed pathway maps and gene sets [38]. | |
| Computational Environment | R Statistical Language | The primary environment for most advanced GSEA and post-processing analyses. |
| RStudio / Posit Workbench | An integrated development environment for R, facilitating code development and visualization. | |
| High-Performance Computing (HPC) Cluster | Essential for processing large RNA-seq datasets and running computationally intensive GSEA permutations. |
The challenge of redundancy in gene set enrichment analysis is a significant but surmountable obstacle in the interpretation of bulk RNA-seq data. By understanding its sources and applying a systematic, tool-driven strategy, researchers can distill overwhelming lists of significant gene sets into a concise set of coherent biological narratives. The integrated workflow presented here, leveraging tools like GeneSetCluster for clustering and supported by semantic similarity analysis and curated resources like the MSigDB Hallmark collection, provides a robust protocol for researchers and drug development professionals. Adopting these strategies ensures that the final interpretation of a transcriptomic study is both biologically insightful and actionable, clearly highlighting the key pathways and processes perturbed in the experimental system.
A Practical Framework for Estimating Analysis Reliability with Limited Replicates
In bulk RNA-sequencing (RNA-seq) research, biological replicates are crucial for robust statistical analysis, yet financial and practical constraints often limit cohort sizes. Studies show approximately 50% of human RNA-seq studies use six or fewer replicates per condition, a threshold often insufficient for reliable results [56] [9]. This introduces significant challenges in replicability, where differential expression and subsequent pathway analysis results from underpowered experiments may fail to validate in subsequent studies [56]. However, low replicability does not invariably indicate low precision; some datasets can achieve high median precision even with low recall when cohort sizes exceed five replicates [56]. This protocol provides a practical, bootstrapping-based framework to help researchers estimate the expected reliability of their Gene Set Enrichment Analysis (GSEA) results when working with limited biological replicates, thereby enhancing the interpretability and credibility of their findings within the broader context of pathway analysis.
Materials and Methods
Experimental Design and Sample Size Considerations
The statistical power of an RNA-seq experiment is fundamentally tied to the number of biological replicates. Table 1 summarizes recommended cohort sizes from various studies to achieve robust detection of differentially expressed genes (DEGs), which form the basis for reliable GSEA.
Table 1: Recommended RNA-Seq Cohort Sizes for Robust Analysis
| Recommendation Source | Replicates per Condition | Rationale and Context |
|---|---|---|
| Schurch et al. [56] | ≥ 6 | Minimum for robust DEG detection |
| Schurch et al. [56] | ≥ 12 | To identify the majority of DEGs across all fold changes |
| Lamarre et al. [56] | 5 - 7 | Corresponds to optimal FDR thresholds of 0.05 to 0.01 |
| Baccarella et al. [56] | ≥ 7 | Reduces result heterogeneity from different analytical tools |
| Ching et al. [56] | ~10 | To achieve approximately 80% statistical power under budget constraints |
Computational Requirements and Software Setup
The following protocol is performed using the R statistical environment. The analysis workflow, from data preprocessing to enrichment analysis, relies on several key R packages.
Table 2: Essential Software and R Packages
| Software/Package | Category | Primary Function in Workflow |
|---|---|---|
| R (v3.6.3 or newer) [68] | Programming Environment | Statistical computing and graphics foundation |
| RStudio (Optional) [68] | Development Environment | Facilitates code writing, execution, and visualization |
tidyverse/reshape2 [68] |
Data Wrangling | Data import, tidying, and transformation |
edgeR/limma [68] [7] |
Differential Expression | Normalization and statistical testing for DEG detection |
fgsea [7] |
Enrichment Analysis | Fast pre-ranked Gene Set Enrichment Analysis |
GSEABase [68] |
Gene Set Handling | Management and manipulation of gene sets |
sva [68] |
Batch Correction | Combatting batch effects and unwanted variation |
Installation and Setup Timing: Software setup is typically completed in under one hour [68]. Required packages can be installed via Bioconductor:
A Simple Bootstrapping Procedure to Estimate Reliability
For researchers constrained to small cohort sizes (e.g., n<7 per condition), a bootstrapping procedure can estimate the expected replicability and precision of their results [56] [9]. This method involves repeatedly subsampling smaller cohorts from a larger pilot dataset or the available data itself to measure the consistency of DEG and pathway detection.
Diagram 1: Bootstrapping workflow for reliability estimation.
Protocol Steps:
- Input Data: Begin with a count matrix (features in rows, samples in columns) and associated metadata [68].
- Iteration Loop: For a predefined number of iterations (e.g., 100), randomly draw a subsample of size
n(e.g., n=3, 4, 5) from each condition within the full dataset [56] [9]. - Core Analysis: For each subsampled cohort, perform a standard differential expression analysis (e.g., using
edgeRorlimma), followed by a pre-ranked GSEA (e.g., usingfgsea) [7]. - Result Storage: From each iteration, store the list of significant DEGs (e.g., FDR < 0.05) and significantly enriched pathways (FDR < 0.25 is common for GSEA) [7].
- Metric Calculation: After all iterations, calculate reliability metrics:
- DEG Overlap: Average Jaccard index or overlap coefficient of DEG lists across all pairwise comparisons of iterations.
- Pathway Replicability: The proportion of iterations in which a given pathway is found to be significantly enriched.
- Precision/Recall: If a "ground truth" from the full dataset is available, calculate the median precision and recall across iterations [56] [9].
This bootstrapped analysis correlates strongly with the observed replicability of the final results and helps researchers understand whether their limited sample size is prone to generating false positives or is merely underpowered to detect all true effects [56].
Core Differential Expression and GSEA Protocol
This section details the primary analysis workflow applied to the full dataset and each bootstrapped subsample.
Diagram 2: Core differential expression and GSEA workflow.
Step-by-Step Execution:
Data Preprocessing: Load and normalize the raw count data. This typically involves filtering out genes with low counts across samples and applying a normalization method like TMM ( implemented in
edgeR) to account for compositional differences [68].Differential Expression Analysis: Using the
limma-voompipeline, which provides a robust framework for RNA-seq data by modeling the mean-variance relationship [68] [7].Gene Set Enrichment Analysis (GSEA): Use the pre-ranked GSEA approach, which is more sensitive than simple overlap-based methods. The
fgseapackage is recommended for its speed and accuracy [7].- Gene Ranking: Create a ranked list of all genes based on a statistic that combines fold change and significance, such as the signed t-statistic or -log10(p-value)*sign(logFC) from the differential expression analysis.
- Gene Set Collection: Select an appropriate gene set collection from databases like MSigDB (e.g., Hallmark, C2 Curated, C5 GO terms) [7].
- Run fgsea: Perform the enrichment analysis.
Critical Parameter:
minSize = 15. Filtering out gene sets with too few genes (<10-15) is a best practice, as small gene sets adversely impact the performance and accuracy of enrichment tests [7].
Application Notes
Key Performance Metrics and Interpretation
Table 3 defines key metrics used to interpret the output of the bootstrapping procedure and the final GSEA, helping to assess the reliability and biological relevance of the findings.
Table 3: Key Metrics for Interpreting Analysis Reliability and Results
| Metric | Definition | Interpretation in Bootstrapping/GSEA |
|---|---|---|
| Replicability | The consistency of results across repeated subsampling experiments. | Low replicability for n<5 is common [56]. High variance suggests findings are cohort-sensitive. |
| Precision | Proportion of identified items (e.g., DEGs) that are true positives. | High median precision indicates few false positives, even if recall is low [56]. |
| Recall | Proportion of all true items that were successfully identified. | Low recall indicates the experiment is underpowered to detect all true effects [56]. |
| Enrichment Score (ES) | The core statistic in GSEA, reflecting the degree to which a gene set is overrepresented at the extremes of a ranked list [7]. | A higher absolute ES indicates stronger association with the phenotypic difference. |
| Normalized ES (NES) | The ES normalized for the size of the gene set, allowing comparison across different gene sets [7]. | Used to calculate the significance of the enrichment (FDR). |
| False Discovery Rate (FDR) | The estimated probability that a significant enrichment represents a false positive [7]. | Standard significance threshold for GSEA is often FDR < 0.25 due to the competitive nature of the test [7]. |
The Scientist's Toolkit: Research Reagent Solutions
Table 4: Essential Research Reagents and Resources for RNA-Seq Workflows
| Reagent / Resource | Function / Purpose | Example / Note |
|---|---|---|
| Twist RNA Library Prep Kit [69] | Converts purified RNA into sequencing-ready libraries. | Optimized for a wide range of inputs (1 ng to 1 μg); includes UMI/UDI options. |
| Twist RNA Exome [69] | Target enrichment panel for protein-coding transcriptome. | Exon-aware design; enables detection of isoforms and fusions; requires fewer reads than WTS. |
| Twist Custom RNA Panels [69] | Targeted sequencing of user-defined RNA transcripts. | Ideal for focusing on specific pathways of interest; cost-effective for large sample numbers. |
| rRNA & Globin Depletion Kit [69] | Removes abundant ribosomal and globin RNAs from total RNA. | Critical for improving sequencing depth of mRNA in whole transcriptome studies. |
| MSigDB Gene Sets [7] | Curated collections of gene signatures for enrichment analysis. | Hallmark (simplified, robust) and C2 (curated pathways) are most commonly used. |
| CellMarker / PanglaoDB [7] | Databases of curated cell type-specific marker genes. | Useful for interpreting enrichment results in the context of cellular heterogeneity. |
Troubleshooting and Technical Considerations
- Low Replicability with Small n: If the bootstrapping procedure reveals unacceptably low replicability (e.g., <50% overlap in top DEGs/pathways for n<5), the most direct solution is to increase the sample size. If this is impossible, conclusions should be framed with extreme caution, emphasizing high-precision findings that are consistent across bootstrapped iterations [56] [9].
- Handling Inter-Gene Correlation: Competitive gene set tests like GSEA assume gene independence, which is biologically inaccurate. This can lead to anti-conservative p-values. For more robust testing with pre-defined gene sets, consider self-contained tests like
roastor competitive tests that account for correlation likecamerafrom thelimmapackage, especially when using pseudo-bulk approaches [7]. - Gene Set Selection and Filtering: Always filter gene sets to include only those with a sufficient number of genes (e.g.,
minSize=15) present in your dataset. Using overly large or overly small gene sets can reduce the power and accuracy of the enrichment test [7]. - Batch Effects: Uncontrolled technical batch effects can severely impact both DEG and GSEA results. Include batch as a covariate in the linear model during differential expression analysis or use batch correction methods like
svaorComBatin the preprocessing stage [68] [7].
This protocol outlines a practical framework for conducting and evaluating bulk RNA-seq pathway analyses when biological replication is limited. By integrating a bootstrapping procedure to estimate reliability, researchers can gauge the confidence they should place in their GSEA results. Adhering to recommended practices for cohort size, leveraging robust differential expression tools like limma, and using fast, accurate enrichment tools like fgsea with properly filtered gene sets, allows for the extraction of meaningful biological insights even from sub-optimally powered studies. The provided workflow empowers researchers to be transparent about the limitations of their data and to focus on the most stable and replicable findings, thereby advancing the rigor of transcriptomic research.
Beyond GSEA: Validating Findings and Comparing Enrichment Methodologies
Pathway enrichment analysis is a cornerstone of interpreting bulk RNA-seq data, providing biological context to gene expression changes by identifying relevant biological processes, pathways, and molecular networks. For researchers and drug development professionals, selecting the appropriate enrichment method is critical for drawing accurate biological conclusions. The two predominant approaches are Over-Representation Analysis (ORA) and Gene Set Enrichment Analysis (GSEA). While both methods aim to identify biologically relevant gene sets, their underlying assumptions, input requirements, and outputs differ significantly [18] [70]. This article delineates the distinctions between ORA and GSEA, provides guidance on selecting the appropriate method based on research objectives and data characteristics, and outlines detailed protocols for their application.
Key Conceptual Differences
At its core, ORA is a straightforward method that tests whether genes from a predefined gene set (e.g., a biological pathway) are present more frequently than expected by chance in a list of differentially expressed genes (DEGs). It requires a simple binary input: a list of significant genes (foreground set) and a background set (typically all genes measured in the experiment) [18] [71]. Statistical tests like Fisher’s exact test or the hypergeometric test are then used to calculate the probability of observing the overlap between the DEGs and the gene set by chance [18] [72].
In contrast, GSEA is a more advanced method that considers the entire ranked list of genes from an experiment, rather than just a subset deemed "significant." It determines whether members of a gene set are randomly distributed throughout this ranked list or tend to cluster at the top or bottom (e.g., most upregulated or downregulated) [18] [19]. GSEA is particularly powerful for detecting subtle but coordinated changes in expression across a group of functionally related genes, where individual gene changes may be small and not meet strict significance thresholds for differential expression [19].
Table 1: Fundamental Comparison of ORA and GSEA
| Feature | Over-Representation Analysis (ORA) | Gene Set Enrichment Analysis (GSEA) |
|---|---|---|
| Core Hypothesis | Tests if a gene set is overrepresented in a list of significant DEGs [18]. | Tests if a gene set is enriched at the extremes (top/bottom) of a ranked gene list [18] [19]. |
| Input Required | A list of differentially expressed genes (DEGs) and a background set [71]. | A full list of genes ranked by a metric like fold change or t-statistic [18] [19]. |
| Statistical Basis | Hypergeometric test or Fisher's exact test [18] [72]. | Kolmogorov-Smirnov-like running sum statistic and permutation testing [19]. |
| Key Advantage | Simple, fast, and computationally inexpensive [71]. | Uses all gene-level data; no arbitrary significance cutoff; can detect subtle, coordinated changes [18] [19]. |
| Key Limitation | Relies on an arbitrary significance cutoff to define DEGs; ignores expression magnitude and gene correlations [18] [70] [19]. | Computationally more intensive; results can be influenced by gene set size and composition [18]. |
When to Use ORA vs. GSEA: A Decision Framework
The choice between ORA and GSEA hinges on the nature of your data and your specific research question.
Scenarios Favoring ORA
- You have only a list of significant genes. ORA is the only viable option if you lack the full genome-wide ranking of genes, such as when working with published results or data from non-sequencing technologies [71].
- Your analysis is exploratory or requires rapid iteration. ORA is computationally fast and its results are straightforward to interpret, making it ideal for initial, high-level assessments [18] [52].
- You are focused specifically on the strongest signals. When your research question is explicitly centered on the most significantly altered genes, ORA provides a direct link between these genes and their associated pathways [18].
Scenarios Favoring GSEA
- You have the full ranked gene list. GSEA is the preferred method when you have access to the complete list of genes ranked by their association with a phenotype (e.g., by fold change or p-value) [18] [19].
- You suspect coordinated, subtle changes. GSEA excels at identifying situations where many genes in a pathway show small but consistent expression changes that individually may not reach statistical significance [19]. This is common in complex phenotypes.
- You want to avoid arbitrary thresholds. By using the entire gene list, GSEA eliminates the need for an arbitrary p-value or fold-change cutoff to define DEGs, thereby using all available information from the experiment [72] [19].
The following decision workflow can help guide your choice:
Experimental Protocols
Protocol for Over-Representation Analysis (ORA)
Objective: To identify biological pathways that are statistically over-represented in a list of differentially expressed genes.
Input Requirements:
- Foreground Set: A list of gene identifiers (e.g., Ensembl IDs, symbols) for genes considered differentially expressed.
- Background Set: A list of gene identifiers representing the set of all genes that could have been detected in the experiment. This is often all genes measured by the RNA-seq platform [71].
- Gene Set Database: A collection of predefined gene sets, such as GO terms, KEGG pathways, or Hallmark sets from MSigDB [52].
Step-by-Step Procedure:
- Identify DEGs: Perform differential expression analysis on your bulk RNA-seq data using tools like DESeq2 or edgeR. Apply significance thresholds (e.g., adjusted p-value < 0.05, |log2 fold change| > 1) to generate the list of DEGs for the foreground set [71].
- Select Background and Database: Define your background set (crucial for accurate statistical testing) and choose your gene set database(s) relevant to your biological context [71] [72].
- Perform Statistical Test: For each gene set in the database, a contingency table is constructed and a statistical test (typically the hypergeometric test) is applied to calculate a p-value for over-representation [18] [72].
- Correct for Multiple Testing: Apply multiple testing correction (e.g., Benjamini-Hochberg False Discovery Rate (FDR)) to the p-values of all tested gene sets to control for false positives [70].
- Interpret Results: Significantly enriched pathways are typically identified using a corrected p-value or FDR threshold (e.g., FDR < 0.25). The results can be visualized using bar plots or dot plots, often showing the -log10 of the p-value and the enrichment factor [52].
Protocol for Gene Set Enrichment Analysis (GSEA)
Objective: To determine whether predefined gene sets show statistically significant, concordant differences between two biological states, based on a genome-wide ranked gene list.
Input Requirements:
- Ranked Gene List: A list of all genes measured, ranked by their correlation with a phenotype of interest. A common ranking metric is the signal2noise ratio, but it can also be derived from fold change or -log10(p-value) multiplied by the sign of the fold change [19].
- Gene Set Database: A collection of predefined gene sets (e.g., from MSigDB) [19].
Step-by-Step Procedure:
- Calculate Ranking Metric: After differential expression analysis, rank all genes from most upregulated to most downregulated. A robust metric is
sign(log2(FoldChange)) * -log10(p-value)[19]. - Calculate Enrichment Score (ES): For each gene set ( S ), the ES is calculated by walking down the ranked list, increasing a running sum when a gene in ( S ) is encountered, and decreasing it otherwise. The increment is weighted by the gene's rank metric, emphasizing genes at the extremes [19]. The final ES is the maximum deviation from zero of the running sum.
- Estimate Significance: The significance of the ES is estimated by comparing it to a null distribution generated by permuting the phenotype labels (default) or the gene sets themselves many times (e.g., 1000 permutations). This yields a nominal p-value [19].
- Adjust for Multiple Testing: The FDR is calculated to account for testing multiple gene sets. An FDR < 0.25 is often considered significant [19].
- Interpret Results: The primary output includes the Normalized Enrichment Score (NES), which allows comparison across gene sets, the nominal p-value, and the FDR q-value. The key visualization is the enrichment plot, which shows the running enrichment score and the position of gene set members in the ranked list [18] [19].
The Scientist's Toolkit
Table 2: Essential Research Reagents and Tools for Enrichment Analysis
| Tool/Resource | Type | Function and Application |
|---|---|---|
| clusterProfiler [71] | R Package | A versatile R/Bioconductor package for performing both ORA and GSEA. It supports multiple databases and provides rich visualization options. |
| MSigDB [52] [19] | Gene Set Database | The Molecular Signatures Database is a comprehensive collection of annotated gene sets, including Hallmark sets, which are well-curated, non-redundant sets. |
| Enrichr [73] [70] | Web Tool | A user-friendly web-based tool for performing ORA against a very large number of gene set libraries. Ideal for quick analyses without programming. |
| WebGestalt [73] [70] | Web Tool | A comprehensive web platform supporting ORA, GSEA, and other specialized analyses. Useful for users who prefer a graphical interface over coding. |
| fgsea [72] | R Package | A fast implementation of the GSEA algorithm in R, designed for efficient analysis of large datasets and gene set collections. |
| GSEA Software [19] | Desktop Application | The original, widely-cited desktop application from the Broad Institute for performing GSEA, featuring a graphical user interface. |
| GeneSetCluster [67] | R Package / Web App | A tool designed to address redundancy in GSA results by clustering overlapping gene-sets, thereby improving interpretation. |
Advanced Considerations and Best Practices
Interpretation of Results
- ORA: Focus on the gene sets with the most significant FDR. The "gene ratio" (number of DEGs in the set / total genes in the set) provides a measure of effect size. Be aware that results can be highly sensitive to the DEG selection threshold [18] [72].
- GSEA: The primary statistic is the Normalized Enrichment Score (NES). A high positive NES indicates the gene set is enriched at the top of the list (associated with, e.g., the treatment phenotype), while a high negative NES indicates enrichment at the bottom (associated with, e.g., the control phenotype) [18]. Always check the FDR and the enrichment plot to validate the result. The plot should show a sharp peak at the leading edge for a clear, robust enrichment [18].
Addressing Redundancy and Improving Interpretation
A common challenge with both methods is the high redundancy in results, where many related gene sets are significantly enriched. Tools like GOREA [74] and GeneSetCluster [67] have been developed to cluster enriched terms based on semantic similarity or gene overlap, providing more concise and interpretable biological summaries. GOREA, for instance, integrates term hierarchy to define representative terms and visualizes results as an annotated heatmap, which helps in prioritizing clusters of related biological processes [74].
When to Use Both Methods
Using ORA and GSEA in a complementary fashion can provide a more comprehensive biological narrative. GSEA can reveal pathways with broad, coordinated changes, while ORA performed on the most strongly differentially expressed genes can highlight the most dramatically affected specific processes [18]. This combined approach ensures you capture both subtle, system-wide perturbations and strong, focal disruptions.
Integrating Topology-Based Pathway Analysis for Mechanistic Insights
Application Note: Advancing Beyond Conventional Pathway Analysis
Traditional pathway enrichment methods, such as Overrepresentation Analysis (ORA) and Gene Set Enrichment Analysis (GSEA), have become standard tools for interpreting bulk RNA-seq data. These methods identify biological pathways enriched in a gene list but operate at the gene-set level, overlooking the internal connectivity and topology of signaling pathways [75]. This limitation constrains their ability to model the propagation of signaling events and pinpoint the specific pathway branches responsible for observed expression changes.
Topology-based pathway analysis addresses this gap by incorporating the internal structure of pathways—including interactions, directionality, and regulatory relationships between genes and proteins—into the analytical framework. This approach is particularly valuable for gaining mechanistic insights into complex diseases and drug responses, as it more accurately reflects the underlying biology where information flows through specific network architectures [76]. By translating gene expression data into pathway-level activity scores that account for this structure, researchers can move from merely listing affected pathways to understanding how their dysregulation propagates functionally.
The integration of these methods is especially powerful in the context of drug discovery. The paradigm in pharmaceutical research is shifting from the "one drug-one target" approach toward system-level pharmacological research, recognizing that complex diseases often result from the dysfunction of multiple interconnected pathways [76]. Topology-based analysis of genomic data, including bulk RNA-seq, provides a robust computational framework for inferring drug targets within these dysregulated networks, thereby informing the development of more effective therapeutic strategies.
Theoretical Foundation: From Gene Sets to Signal Flow
Limitations of Conventional Enrichment Methods
Conventional pathway enrichment methods, while immensely useful, possess inherent conceptual limitations:
- Gene-Centric Approach: ORA and GSEA treat pathways as simple lists or sets of genes, ignoring the complex web of physical and regulatory interactions between pathway members [75] [6].
- Lack of Directional Information: These methods cannot model the direction of signal flow, making it impossible to distinguish between upstream regulators and downstream effectors within the same pathway.
- Insensitivity to Pathway Architecture: Critical biological phenomena—such as bottlenecks, feedback loops, and alternative signaling branches—remain invisible to traditional enrichment tests, despite their profound functional implications.
Key Concepts in Topology-Based Analysis
Topology-based methods introduce several key conceptual advances:
- Pathway Signal Flow (PSF): The PSF algorithm integrates gene expression data with curated interaction networks to compute numeric activity scores for each branch of a biological pathway [75]. This produces a functionally annotated feature space that captures downstream signaling effects as branch-specific activity values, effectively modeling information propagation through the pathway architecture.
- Network-Based Integration: Building on the insight that biological data inherently represents physical interaction networks, these approaches enable natural integration with inferred networks from other -omics data [77]. This allows researchers to examine how chromatin organization, gene expression, and protein activity interrelate within unified topological models.
- Causal Analytics: Advanced implementations incorporate causal network analysis, which uses causal scoring to generate hierarchical regulatory networks. This helps identify master regulators that influence observed expression patterns through a cascade of other regulators [78], providing deeper mechanistic understanding than correlation-based approaches alone.
Computational Protocols
Protocol 1: Topology-Aware Analysis with Pathway Signal Flow (PSF)
The PSF algorithm transforms gene expression into branch-specific pathway activities using curated interaction networks.
Materials
- Input Data: Normalized bulk RNA-seq count matrix or list of differentially expressed genes with statistical scores.
- Software Requirements: R statistical environment with PSF package installed.
- Pathway Resources: Curated Kyoto Encyclopedia of Genes and Genomes (KEGG) or Reactome pathways in a compatible format.
Procedure
- Data Preprocessing: Format input gene expression data as a matrix with genes in rows and samples in columns. Ensure gene identifiers match the pathway database (e.g., Entrez ID, Ensembl ID, or official gene symbol).
- Pathway Selection: Select relevant signaling pathways from KEGG or Reactome. The PSF algorithm requires pathway topology files that specify gene-gene interactions.
- Signal Flow Calculation: Execute the PSF algorithm to compute activity scores for each pathway branch. PSF propagates expression values through the pathway network based on its topology.
- Activity Scoring: The algorithm outputs numeric activity scores representing the estimated signaling activity for each pathway branch across samples.
- Downstream Analysis: Utilize branch-specific activity scores for dimensional reduction, clustering, or differential activity testing between experimental conditions.
Workflow Visualization
Protocol 2: Network-Based Integration of Hi-C and RNA-seq Data
This protocol leverages network theory to integrate chromatin conformation data with transcriptional profiles, providing insights into epigenetic regulation of gene expression.
Materials
- Hi-C Data: Processed chromatin interaction matrices from TNBC and normal samples.
- RNA-seq Data: Differential expression results from matched samples.
- Software Tools: HiC-Pro for data processing, HiEdge for significant interaction calling, igraph for network construction and analysis.
Procedure
- Hi-C Data Processing: Process raw Hi-C sequencing reads through HiC-Pro, which performs alignment, quality filtering, and construction of raw contact matrices [77].
- Normalization: Normalize Hi-C data using iterative correction and eigenvector decomposition (ICE) to correct for technical biases including GC content, mappability, and restriction fragment length.
- Significant Interaction Identification: Use HiEdge to identify statistically significant chromatin interactions while accounting for distance-dependent decay of interaction frequencies. Apply a false discovery rate threshold (e.g., q-value < 0.001) to correct for multiple testing.
- Network Construction: Represent significant chromatin interactions as networks where nodes correspond to genomic regions (40 kb bins) and edges represent significant chromatin interactions. Assign genes to nodes containing their transcription start sites.
- Multi-omics Integration: Overlay differential expression results from RNA-seq data onto the chromatin interaction network to identify regions where topological changes correlate with transcriptional alterations.
Workflow Visualization
Research Reagent Solutions
Table 1: Essential Computational Tools for Topology-Based Pathway Analysis
| Tool/Resource | Type | Primary Function | Application Context |
|---|---|---|---|
| PSF Algorithm [75] | Algorithm | Computes branch-specific pathway activity scores from expression data | Topology-aware analysis of signaling pathways in spatial and bulk transcriptomics |
| clusterProfiler [12] | R Package | Overrepresentation and enrichment analysis for KEGG and GO terms | Conventional pathway enrichment with visualization capabilities |
| pathview [12] | R Package | Pathway visualization with overlaid expression data | Creating publication-quality pathway diagrams with experimental data |
| Cytoscape + EnrichmentMap [6] | Visualization Platform | Network visualization and enrichment result interpretation | Visualizing complex enrichment results and pathway relationships |
| HiC-Pro [77] | Processing Pipeline | Processing Hi-C data from raw reads to interaction matrices | Preprocessing chromosome conformation data for network analysis |
| HiEdge [77] | Analysis Tool | Identifying significant chromatin interactions | Statistical analysis of Hi-C data with distance-dependent modeling |
| igraph [77] | R Package | Network analysis and visualization | Constructing and analyzing chromatin interaction networks |
| QIAGEN IPA [78] | Commercial Platform | Causal network and upstream regulator analysis | Drug target inference and mechanistic hypothesis generation |
Table 2: Key Biological Databases for Pathway and Network Analysis
| Database | Content Type | Scope | Use Case |
|---|---|---|---|
| KEGG [12] | Pathway Diagrams | Metabolic, signaling, and disease pathways | PSF analysis and pathway visualization with pathview |
| Reactome [6] | Curated Pathways | Detailed human biological processes | High-quality pathway topology for signal flow modeling |
| Gene Ontology (GO) [79] [6] | Functional Annotations | Biological Process, Molecular Function, Cellular Component | Standard functional enrichment analysis |
| MSigDB [6] | Gene Set Collection | Curated and computational gene sets | GSEA and comprehensive pathway coverage |
| Pathway Commons [6] | Meta-Database | Aggregated pathway information from multiple sources | Accessing unified pathway interaction data |
Data Interpretation and Visualization
Analyzing PSF Activity Outputs
The branch-specific activity scores generated by PSF analysis enable several advanced analytical approaches:
- Pathway-Based Clustering: Instead of clustering samples based on gene expression patterns, use branch activity scores as features. This groups samples according to shared pathway activation states, often revealing biologically meaningful subgroups that might be obscured in gene-level analysis [75].
- Differential Activity Testing: Identify pathway branches with statistically significant activity differences between experimental conditions (e.g., treated vs. untreated, diseased vs. healthy). This pinpoints precisely which arms of a pathway are most affected by the experimental manipulation.
- Spatial Activity Mapping: When applied to spatial transcriptomics data, PSF activities can be mapped back to tissue locations, revealing how pathway signaling patterns vary across tissue microenvironments and identifying potential intercellular communication via ligand-receptor interactions between adjacent regions [75].
Visualizing Network Relationships
Effective visualization is crucial for interpreting complex topology-based analysis results:
- EnrichmentMap Creation: Use Cytoscape with the EnrichmentMap plugin to visualize enriched pathways as a network, where connections represent gene overlap between pathways. This helps identify broader biological themes and reduces redundancy in interpretation [6].
- Pathway Diagram Overlays: Visualize expression data or branch activities on standard pathway diagrams using pathview, which automatically generates KEGG pathway maps with experimental data overlaid as colored nodes [12].
- Chromatin Network Visualization: Display chromatin interaction networks with nodes colored by associated gene expression changes or functional annotations, highlighting regions where topological organization correlates with transcriptional activity [77].
Application to Drug Target Inference
Topology-based pathway analysis provides a powerful framework for drug target identification through several mechanistic approaches:
- Causal Network Analysis: Identify master regulators that sit upstream of observed expression changes by constructing hierarchical regulatory networks. These upstream factors represent potential therapeutic targets whose modulation could produce cascading effects through the network [78].
- Polypharmacology Prediction: Analyze how drug-induced expression changes propagate through pathway topologies to identify secondary targets and potential off-target effects, supporting the development of multi-target therapeutic strategies [76].
- Mechanism of Action Elucidation: Compare pathway-level responses across multiple compounds to group drugs by their signaling effects rather than just their expression profiles, providing deeper insight into their biological mechanisms [76].
- Network-Based Biomarker Discovery: Identify pathway branches whose activities correlate with drug sensitivity or resistance, potentially revealing predictive biomarkers for treatment response.
Table 3: Comparison of Pathway Analysis Methods in Drug Discovery Context
| Method | Strengths | Limitations | Best Use for Target Inference |
|---|---|---|---|
| Overrepresentation Analysis (ORA) [12] | Simple implementation, intuitive results | Disregards gene correlations, pathway topology, and expression magnitude | Initial screening for pathway involvement |
| Gene Set Enrichment Analysis (GSEA) [12] [6] | Considers expression rankings, more sensitive | Still ignores pathway connectivity and internal structure | Identifying subtly coordinated pathway changes |
| Topology-Based Methods (PSF) [75] | Models signal flow, identifies specific dysregulated branches | More complex implementation, requires curated pathway structures | Mechanistic understanding and precise target identification |
| Network Integration (Hi-C + RNA-seq) [77] | Links structural and functional genomics, identifies epigenetic drivers | Computationally intensive, requires multiple data types | Understanding epigenetic mechanisms in cancer and complex diseases |
Gene Set Enrichment Analysis (GSEA) has become one of the most powerful and widely used tools for interpreting transcriptomic data, moving beyond single-gene analysis to identify coordinated changes in biologically relevant pathways [80]. However, the high-dimensional and heterogeneous nature of RNA sequencing data, combined with frequent limitations in cohort sizes, poses significant challenges to the reproducibility of GSEA outcomes [9]. Recent studies have demonstrated alarming rates of non-replication, with one analysis of neurodegenerative diseases finding that over 85% of differentially expressed genes identified in individual Alzheimer's disease datasets failed to reproduce in other studies [57]. This protocol provides a comprehensive framework for rigorously validating GSEA findings through cross-cohort verification, enabling researchers to distinguish robust biological signals from false discoveries and build a more reliable foundation for downstream applications in drug development and therapeutic target identification.
Theoretical Foundation and Reproducibility Challenges
GSEA Fundamentals and Methodological Variations
GSEA operates on the principle that biologically relevant phenomena manifest through coordinated, subtle changes in functionally related gene sets, rather than through dramatic changes in individual genes [80]. The algorithm tests whether members of a predefined gene set occur non-randomly at the extremes of a ranked gene list derived from an expression dataset, typically using a weighted Kolmogorov-Smirnov-like statistic to calculate enrichment scores [81]. This approach offers greater biological context compared to single-gene analysis but introduces unique methodological considerations that impact cross-study validation.
Multiple GSA methods have been developed with different statistical approaches and null hypotheses. Table 1 compares commonly used methods that researchers should consider when designing validation studies.
Table 1: Common Gene Set Analysis Methods and Their Characteristics
| Method | Category | Key Feature | Null Hypothesis |
|---|---|---|---|
| GSEA [6] [80] | Functional Class Scoring | Uses ranked gene list; enrichment score based on KS statistic | Genes in set are randomly distributed throughout ranked list |
| CAMERA [80] | Functional Class Scoring | Accounts for inter-gene correlation; uses competitive test | Genes in set are as highly ranked as genes not in set |
| sigPathway [80] | Self-contained Test | Tests whether genes in set are jointly differentially expressed | No genes in set are differentially expressed |
| DGSEA [81] | Differential Enrichment | Compares relative enrichment between two gene sets | Two gene sets show equal enrichment patterns |
Documented Reproducibility Concerns in Transcriptomic Studies
Recent systematic assessments have quantified the reproducibility challenges in transcriptomic research. A large-scale analysis of single-cell RNA-seq studies found that differentially expressed genes from individual Alzheimer's and schizophrenia datasets had poor predictive power for case-control status in other datasets, while results from Parkinson's, Huntington's, and COVID-19 studies showed only moderate reproducibility [57]. Similarly, a replicability study on bulk RNA-seq experiments demonstrated that results from underpowered experiments are unlikely to replicate well, though low replicability does not necessarily imply low precision of results [9].
These reproducibility issues stem from multiple factors:
- Small cohort sizes: Financial and practical constraints often limit sample sizes, with approximately 50% of human RNA-seq studies using six or fewer replicates per condition [9]
- Technical variability: Differences in sequencing platforms, sample processing, and normalization methods introduce systematic biases
- Biological heterogeneity: Population diversity and disease subtypes create distinct molecular signatures across studies
- Analytical flexibility: Choices in pre-processing, normalization, and significance thresholds dramatically impact results
Experimental Design for Cross-Validation
Cohort Selection and Dataset Requirements
Robust cross-validation requires careful selection of independent validation cohorts that balance similarity with the discovery dataset against sufficient independence to test generalizability. The following criteria should guide cohort selection:
- Sample Size Considerations: Based on empirical assessments, validation cohorts should contain at least 10-12 samples per group to achieve reasonable power for detecting reproducible effects [9]
- Technical Compatibility: Platforms should be sufficiently similar (e.g., both RNA-seq rather than mixing microarray and RNA-seq) while not being identical technical replicates
- Clinical Homogeneity: Patient populations should share key clinical characteristics (e.g., disease stage, treatment status) while representing distinct recruitment sources or geographic locations
- Data Completeness: Validation datasets must contain raw or normalized count data rather than only pre-processed results, with comprehensive clinical metadata for covariate adjustment
Power Analysis for Validation Studies
Formal power analysis for GSEA cross-validation remains challenging due to the multivariate nature of pathway enrichment. However, researchers can adapt conventional power calculations by:
- Estimating effect sizes based on normalized enrichment scores (NES) from the discovery analysis
- Accounting for the number of gene sets tested simultaneously through multiple testing correction
- Considering the mean and distribution of gene set sizes in the specific collection being tested
Simulation-based approaches using tools like FANGS (Flexible Algorithm for Novel Gene Set Simulation) can provide more accurate power estimates by incorporating realistic correlation structures from existing datasets [80].
Protocol: Cross-Validation of GSEA Results
Pre-processing and Quality Control
Note: The following protocol assumes completion of initial GSEA on a discovery cohort with identification of significantly enriched gene sets requiring validation.
Materials Required:
- Independent validation cohort with raw or normalized count data
- Clinical metadata for the validation cohort
- List of significant gene sets from discovery analysis with their enrichment statistics
- Gene set collections in standard format (e.g., .gmt files from MSigDB)
Software and Computational Tools:
- R statistical environment with clusterProfiler, fgsea, or EnrichmentMap packages [6]
- Python environment with GSEApy or similar libraries as alternatives
- High-performance computing resources for permutation testing
Step 1: Data Harmonization and Normalization
- Process validation cohort data using the same pipeline applied to the discovery cohort
- For RNA-seq data: Apply variance stabilizing transformation (e.g., DESeq2's vst function) to normalize count data [15]
- For cross-platform validation: Apply cross-platform normalization methods (e.g., quantile normalization) with careful attention to batch effects
- Generate a ranked list of genes for GSEA using the same ranking metric as the discovery analysis (typically signal-to-noise ratio or -log10(p-value)*sign(fold-change))
Step 2: Quality Assessment of Validation Data
- Perform principal component analysis (PCA) to identify major sources of variation and potential batch effects
- Compare expression distributions between discovery and validation cohorts using density plots
- Verify data quality through assessment of housekeeping gene expression and RNA integrity metrics when available
GSEA Execution on Validation Cohort
Step 3: Parameter Configuration
- Set the number of permutations to at least 1,000 for stable FDR estimation (increase to 10,000 for greater precision)
- Use the same gene set database and version as the discovery analysis
- Maintain consistent gene set size filters (typically minimum=15, maximum=500 genes)
- Apply the same weighting exponent (typically p=1 for fold-change weighted ranking)
Step 4: Parallel Implementation
- Execute GSEA on the validation cohort using identical gene sets from the discovery analysis
- Run complementary methods (e.g., CAMERA, DGSEA) to assess robustness to methodological variations [81] [80]
- For targeted validation of specific pathways, apply DGSEA to directly test relative enrichment between complementary pathways (e.g., glycolysis vs. oxidative phosphorylation) [81]
Validation Metrics and Statistical Assessment
Step 5: Quantitative Comparison of Results Calculate the following metrics to objectively assess cross-study reproducibility:
Table 2: Metrics for Assessing GSEA Cross-Validation Results
| Metric | Calculation | Interpretation | Threshold for Success |
|---|---|---|---|
| Reproducibility Rate | Percentage of discovery significant gene sets (FDR<0.25) that show nominal significance (P<0.05) in validation cohort | Measures direct replication of individual findings | >50% considered good replication |
| Rank Correlation | Spearman correlation between enrichment scores of all tested gene sets across studies | Assesses preservation of relative pathway ranking | ρ > 0.3 indicates meaningful preservation |
| Direction Consistency | Percentage of reproduced gene sets with concordant enrichment direction (both positively or both negatively enriched) | Tests biological coherence | >90% expected |
| Effect Size Correlation | Pearson correlation of normalized enrichment scores (NES) between studies | Quantifies consistency of magnitude | r > 0.4 indicates good effect preservation |
| AUC Analysis | Area under ROC curve using discovery results to predict validation significance | Evaluates predictive performance | AUC > 0.7 indicates good predictive value |
Step 6: Statistical Assessment of Validation
- Apply Fisher's exact test to determine if the reproducibility rate exceeds chance expectation
- Calculate confidence intervals for reproducibility rates using binomial distribution
- For gene sets with discordant results, investigate potential biological and technical sources of heterogeneity
Advanced Validation Frameworks
Meta-Analysis Approaches for Multi-Cohort Validation
When multiple validation cohorts are available, employ formal meta-analysis methods to aggregate evidence across studies:
SumRank Method: A non-parametric approach that prioritizes genes with reproducible relative differential expression ranks across datasets, shown to outperform traditional inverse variance-weighted methods [57] [82]
Inverse Variance Weighting: Conventional random-effects meta-analysis of normalized enrichment scores, appropriate when effect sizes are reasonably consistent across studies
Cross-Dataset Predictive Modeling: Use discovery results to build classifiers predicting case-control status in validation cohorts, assessing performance via area under the curve (AUC) analysis [57]
Differential GSEA (DGSEA) for Pathway Relationships
For investigating coordinated regulation between complementary pathways, implement DGSEA to test relative enrichment patterns:
DGSEA implementation steps:
- Calculate enrichment scores for both gene sets of interest (e.g., glycolysis and oxidative phosphorylation)
- Compute the difference between enrichment scores (ESAB = ESA - ESB)
- Assess significance through permutation testing to generate a null distribution
- Calculate normalized enrichment scores and false discovery rates for the differential enrichment [81]
Interpretation and Reporting Guidelines
Criteria for Successful Validation
Establish pre-defined thresholds for declaring successful cross-validation:
- Full Validation: >50% reproducibility rate with consistent effect directions and statistically significant correlation of effect sizes
- Partial Validation: Significant reproducibility rate (>25%) with consistent directions but variable effect sizes
- Hypothesis Generating: Limited reproducibility (<25%) but biologically plausible subsets of gene sets show consistent patterns
- Failed Validation: No significant reproducibility beyond chance expectation
Investigation of Discordant Results
When validation fails or shows only partial success, systematically investigate potential causes:
- Technical Artifacts: Assess batch effects, platform differences, and sample quality metrics
- Biological Heterogeneity: Evaluate differences in patient demographics, disease subtypes, or treatment histories
- Analytical Considerations: Examine differences in data preprocessing, normalization, or confounding factor adjustment
- Power Limitations: Determine if validation cohort had sufficient sample size to detect effects observed in discovery
Reporting Standards
Comprehensive reporting of cross-validation studies should include:
- Dataset Characteristics: Sample sizes, clinical features, sequencing platforms for both discovery and validation cohorts
- Methodological Details: All software tools, parameters, and analytical choices for both GSEA executions
- Complete Results: Enrichment statistics for all gene sets in both cohorts, not just significant findings
- Validation Metrics: All calculated reproducibility metrics with appropriate measures of statistical uncertainty
- Contextual Interpretation: Discussion of biological and methodological factors influencing validation outcomes
Research Reagent Solutions
Table 3: Essential Research Reagents and Computational Tools for GSEA Cross-Validation
| Category | Resource | Description | Application in Protocol |
|---|---|---|---|
| Gene Set Databases | MSigDB [6] [80] | Molecular Signatures Database; curated collection of >10,000 gene sets | Primary source of biologically annotated gene sets for enrichment testing |
| Software Packages | clusterProfiler [83] [84] | R package for enrichment analysis and visualization | Performing GSEA and functional enrichment comparisons |
| Software Packages | GSEA Software [6] [81] | Broad Institute's official GSEA desktop application | Primary analysis using standard implementation |
| Software Packages | EnrichmentMap [6] | Cytoscape app for visualizing enrichment results as networks | Visualizing relationships between validated gene sets |
| Analysis Environments | R/Bioconductor [83] [84] | Open-source statistical computing environment | Primary platform for differential expression and enrichment analysis |
| Data Resources | GEO Database [83] [84] | Gene Expression Omnibus; public repository of functional genomics data | Source of independent validation cohorts |
| Validation Tools | SumRank [57] [82] | Non-parametric meta-analysis method prioritizing reproducible signals | Identifying robustly reproduced DEGs across multiple datasets |
| Specialized Methods | DGSEA [81] | Differential Gene Set Enrichment Analysis algorithm | Testing relative enrichment between complementary pathways |
Rigorous cross-validation of GSEA results in independent cohorts is an essential step in transforming high-throughput transcriptomic data into reliable biological insights. The protocol outlined here provides a systematic framework for assessing the reproducibility of pathway-level findings, incorporating both established methods and recent advances such as DGSEA for analyzing pathway relationships and SumRank for multi-cohort meta-analysis. By implementing these comprehensive validation strategies, researchers can significantly enhance the robustness of their conclusions, ultimately accelerating the translation of genomic discoveries into clinical applications and therapeutic interventions. As the field continues to evolve, standardization of such validation approaches will be crucial for building a more reproducible foundation for systems biology and personalized medicine.
The integration of single-cell RNA sequencing (scRNA-seq) and bulk RNA sequencing (bulk RNA-seq) represents a transformative approach in modern genomic research, enabling the decomposition of complex transcriptional signatures into their cellular constituents and the identification of novel biological mechanisms. While bulk RNA-seq provides a high-sensitivity overview of tissue-level gene expression, it masks cellular heterogeneity [85]. Conversely, scRNA-seq resolves cellular diversity but often suffers from technical noise and sparse data for low-abundance transcripts [86]. Functional enrichment analysis, particularly gene set enrichment analysis (GSEA), serves as the critical bridge connecting these complementary datasets by identifying biologically meaningful pathways that are consistently altered across analytical levels. This integrated approach is especially powerful for discerning cell-type-specific contributions to disease pathways, refining prognostic biomarkers, and identifying potential therapeutic targets with greater precision than either method alone [85] [87].
Analytical Workflow for Multi-Omic Integration
The standard workflow for integrating scRNA-seq and bulk RNA-seq data involves sequential processing, cross-validation, and joint interpretation, with functional enrichment analysis serving as the unifying element. The following diagram illustrates the key stages and their relationships:
Data Processing and Quality Control
Bulk RNA-seq Processing: Raw sequencing reads require quality control using tools like FASTQC, followed by alignment to a reference genome (e.g., with STAR) and generation of gene count matrices. Normalization methods such as TMM (Trimmed Mean of M-values) in edgeR account for differences in library size and RNA composition [88]. For differential expression analysis, established tools like DESeq2, edgeR, or limma/voom are employed, using criteria including false discovery rate (FDR) < 0.05 and absolute log fold change > 1 to identify significant genes [12].
scRNA-seq Processing: The Seurat package provides a standard framework for processing scRNA-seq data. Quality control involves filtering out low-quality cells based on thresholds for unique gene counts (e.g., >250 genes), mitochondrial gene percentage (e.g., <10%), and sequencing depth [85] [89]. Data normalization is performed using methods like LogNormalize with a scale factor of 10,000. Identification of highly variable genes enables focused downstream analysis. To address batch effects between datasets, integration tools such as Harmony or Seurat's CCA integration are applied, which correct for technical variations while preserving biological heterogeneity [85] [90] [89].
Cell Type Annotation and Deconvolution
In scRNA-seq analysis, cell clusters are identified through graph-based clustering on principal components followed by UMAP visualization. Cell types are annotated using known marker genes from databases like CellMarker [87]. For bulk RNA-seq deconvolution, the scRNA-seq dataset serves as a reference to estimate cell type proportions in bulk samples using tools like bMIND [86]. This step is crucial for determining which cell populations contribute most significantly to observed bulk expression patterns, thereby enabling cell-type-specific interpretation of bulk-level findings.
Differential Expression and Functional Enrichment
Differential expression analysis in scRNA-seq data can be performed using the FindMarkers function in Seurat with thresholds such as \|avg_log2FC\| > 1 and adjusted p-value < 0.05 [85]. For both bulk and single-cell data, functional enrichment analysis is then applied to the resulting gene lists.
Enrichment Methods: Over-representation analysis (ORA) tests whether genes in a predefined pathway are significantly overrepresented in the differential expression list using Fisher's exact test [12]. Gene Set Enrichment Analysis (GSEA) represents a more powerful alternative that considers all genes ranked by their differential expression statistics, identifying pathways enriched at the top or bottom of the ranked list without arbitrary significance thresholds [1] [91]. The fGSEA implementation provides accelerated computation for this method [88].
Multi-Contrast Enhancement: For studies involving multiple conditions or time points, multi-contrast enrichment tools like mitch use a rank-MANOVA approach to identify pathways that exhibit consistent enrichment patterns across multiple experimental contrasts, providing a more comprehensive view of pathway regulation [91].
Table 1: Key Functional Enrichment Methods and Their Applications
| Method | Type | Key Features | Best Use Cases |
|---|---|---|---|
| Over-representation Analysis | ORA | Uses significance thresholds; hypergeometric/Fisher exact test | Preliminary analysis; clearly defined gene lists [12] |
| GSEA | FCS | No arbitrary thresholds; uses all ranked genes; sensitive to subtle coordinated changes [1] | Standard pathway analysis; comparing two phenotypes [1] [88] |
| mitch | Multi-contrast FCS | Rank-MANOVA; handles multiple contrasts simultaneously [91] | Multi-omics integration; time series; multi-condition studies [91] |
| fgsea | FCS | Fast implementation of GSEA algorithm [88] | Large datasets; rapid exploratory analysis [88] |
Case Study: Rheumatoid Arthritis Synovial Tissue
Experimental Design and Protocol
A compelling application of integrated scRNA-seq and bulk RNA-seq with functional enrichment comes from a study investigating macrophage heterogeneity in rheumatoid arthritis (RA) synovial tissue [85]. The experimental workflow comprised several key stages:
Data Collection: Researchers retrieved publicly available scRNA-seq datasets (GSE221704, GSE230145) and five bulk RNA-seq datasets (GSE12021, GSE55235, GSE55457, GSE77298, GSE89408) from the Gene Expression Omnibus, totaling 213 RA samples and 63 healthy controls [85].
scRNA-seq Processing and Macrophage Subsetting: After quality control retaining 26,923 cells, dataset integration was performed using Harmony to correct batch effects. Myeloid cells were extracted and re-clustered, revealing distinct macrophage subpopulations including Stat1+ macrophages, Fn1+ macrophages, and others based on specific marker expression [85].
Differential Expression and Trajectory Analysis: Differentially expressed genes (DEGs) for myeloid subtypes were identified using Seurat's FindAllMarkers function. Pseudotime analysis using Monocle3 reconstructed differentiation trajectories, with Cd14+ monocytes set as the starting point [85].
Machine Learning Integration: To prioritize key regulatory genes, the study employed a combined approach using LASSO regression and random forest models, identifying STAT1 as a crucial gene in RA pathogenesis [85].
Validation: STAT1 differential expression was confirmed in an adjuvant-induced arthritis (AIA) rat model, and functional experiments investigated STAT1's association with autophagy and ferroptosis pathways [85].
Key Findings and Pathway Insights
The integrated analysis revealed that synovial tissues from RA mice exhibited significantly elevated percentages of Stat1+ macrophages. Enrichment analysis demonstrated that these cells were concentrated in inflammatory pathways. Bulk RNA-seq and animal models further confirmed STAT1 upregulation in RA [85].
Functional experiments provided mechanistic insights, showing that STAT1 activation upregulated synovial LC3 and ACSL4 while downregulating p62 and GPX4. Treatment with fludarabine (Flu) reversed these changes, suggesting that STAT1 contributes to RA pathogenesis by modulating autophagy and ferroptosis pathways [85]. The STAT1 signaling pathway and its role in these processes can be visualized as follows:
This integrated approach demonstrated how combining scRNA-seq-defined cell states with bulk-level validation and functional experiments can uncover novel therapeutic targets for complex autoimmune diseases like RA.
Practical Implementation Guide
Research Reagent Solutions
Table 2: Essential Research Reagents and Computational Tools for Multi-Omic Integration
| Category | Specific Tool/Reagent | Function/Purpose |
|---|---|---|
| Wet-Lab Reagents | 10x Genomics Chromium System | Single-cell partitioning and barcoding [86] |
| TRIzol LS | RNA extraction from FACS-sorted cells [86] | |
| SoLo Ovation Ultra-Low Input RNaseq kit | Library preparation for low-input samples [86] | |
| Computational Tools | Seurat (v5.0.1+) | scRNA-seq data processing, integration, and clustering [85] [89] |
| Harmony | Batch effect correction for scRNA-seq data [85] [90] | |
| edgeR/DESeq2 | Bulk RNA-seq differential expression analysis [12] [88] | |
| clusterProfiler | Functional enrichment analysis (ORA, GSEA) [85] [12] | |
| fGSEA | Fast gene set enrichment analysis [88] | |
| Monocle3 | Pseudotime and trajectory analysis [85] | |
| Databases | MSigDB | Curated gene set collections for GSEA [1] |
| CellMarker | Reference for cell type annotation [87] | |
| KEGG/GO | Pathway and functional annotation databases [12] |
Protocol for Cross-Dataset Validation
A robust protocol for validating scRNA-seq findings with bulk RNA-seq involves the following steps:
Identify Candidate Genes from scRNA-seq: Perform differential expression analysis between cell states or conditions within the scRNA-seq data. For example, in the RA study, STAT1 was identified as a key gene in Stat1+ macrophages using
FindMarkerswith thresholds \|avg_log2FC\| > 1 and adjusted p-value < 0.05 [85].Validate in Bulk Cohorts: Check expression of candidate genes in bulk RNA-seq datasets. In the RA study, researchers validated STAT1 upregulation across five independent bulk RNA-seq datasets totaling 213 RA samples and 63 healthy controls [85].
Functional Enrichment Consistency: Test whether pathways enriched in scRNA-seq DEGs are similarly enriched in bulk RNA-seq DEGs. Use tools like clusterProfiler for ORA or GSEA analysis with consistent gene set databases [85] [12].
Experimental Validation: Confirm key findings in experimental models. The RA study used an adjuvant-induced arthritis rat model and performed functional experiments with fludarabine treatment to validate STAT1's role in autophagy and ferroptosis [85].
Troubleshooting Common Challenges
Batch Effects: When integrating multiple datasets, batch effects are inevitable. Use Harmony [85] or Seurat's integration [89] methods to correct for technical variations while preserving biological signals. Define batches based on the major source of variation (e.g., donor, protocol, or sequencing platform) [90].
Sparse scRNA-seq Data: For detecting low-abundance transcripts, consider integrating with bulk RNA-seq from purified cell populations where possible [86]. The higher sensitivity of bulk RNA-seq can complement the cellular resolution of scRNA-seq.
Pathway Analysis Interpretation: When similar pathways are identified across multiple analytical levels, this strengthens biological conclusions. For example, in a papillary thyroid cancer study, inflammatory pathways were consistently enriched across both scRNA-seq and bulk RNA-seq analyses, reinforcing their importance in disease progression [87].
The integration of scRNA-seq and bulk RNA-seq data, coupled with functional enrichment analysis, provides a powerful framework for extracting biologically meaningful insights from complex transcriptomic datasets. This approach leverages the respective strengths of each technology: the cellular resolution of scRNA-seq and the sensitivity of bulk RNA-seq. The case studies in rheumatoid arthritis [85] and papillary thyroid cancer [87] demonstrate how this integrated strategy can identify novel cell-type-specific disease mechanisms, refine prognostic biomarkers, and reveal potential therapeutic targets. As multi-omic technologies continue to advance, the systematic application of these integrative principles will be essential for unraveling the complexity of biological systems and disease processes.
Gene Set Enrichment Analysis (GSEA) has become an indispensable method for interpreting gene expression data by identifying predefined gene sets and pathways that show coordinated changes in expression. However, the proliferation of GSEA tools and methodologies necessitates systematic benchmarking to guide researchers in selecting appropriate approaches for bulk RNA-seq data analysis. This application note provides a comprehensive evaluation of GSEA performance metrics, focusing on sensitivity, specificity, and biological relevance, with specific protocols for implementation in drug development research.
The widespread adoption of RNA-seq technologies has generated massive datasets requiring sophisticated analytical approaches. While originally developed for microarray data, GSEA is now extensively applied to RNA-seq data, despite potential technology-specific biases that may confound functional enrichment analysis [92]. This creates an urgent need for standardized benchmarking frameworks to evaluate the growing number of GSEA methodologies, which now exceed 70 different methods and hundreds of variants [92].
Benchmarking Results and Comparative Performance
Quantitative Assessment of GSEA Modalities
Recent benchmarking efforts have leveraged large-scale RNA-seq datasets from The Cancer Genome Atlas (TCGA) to evaluate various GSEA modalities. These studies utilized 1,219 paired primary-tumor/non-tumor solid tissue samples from 604 subjects across 12 cancer types, analyzing 33,591 gene sets from MSigDB to establish 253 positive-control pathways for rigorous benchmarking [92].
Table 1: Performance Metrics of GSEA Modalities Across Cancer Types
| GSEA Modality | Permutation Type | Average Sensitivity | Average Specificity | Optimal Use Case |
|---|---|---|---|---|
| Classic/Unweighted | Gene-set | 0.82 | 0.91 | Standard pathway analysis |
| Weighted | Phenotype | 0.79 | 0.87 | Large sample sizes |
| Signal2Noise | Phenotype | 0.75 | 0.85 | High-quality datasets |
| t-test | Phenotype | 0.71 | 0.83 | Small sample sizes |
The benchmarking results indicate that the classic/unweighted gene-set permutation approach offered comparable or better sensitivity-specificity tradeoffs across cancer types compared to more complex permutation methods [92]. This finding is particularly relevant for researchers working with limited computational resources, as the classic method also demonstrates superior computational efficiency.
Comparative Analysis of GSEA Algorithms
Beyond standard GSEA implementations, novel algorithms have emerged with distinct approaches to pathway enrichment analysis. The gdGSE algorithm employs discretized gene expression profiles to assess pathway activity, effectively mitigating discrepancies caused by data distributions [25]. Meanwhile, blitzGSEA utilizes a Gamma distribution approximation to significantly accelerate computation while maintaining p-value accuracy [93].
Table 2: Algorithm Comparison for Pathway Enrichment Analysis
| Algorithm | Core Methodology | Speed Advantage | Key Application | Concordance with Experimental Validation |
|---|---|---|---|---|
| GSEA (Classic) | Gene-set permutation | Baseline | General purpose | 75-86% for immune pathways |
| blitzGSEA | Gamma approximation | 10-50x faster | Large-scale studies | Comparable to classic GSEA |
| gdGSE | Expression discretization | 3-5x faster | Cancer stemness quantification | >90% for drug mechanisms |
| Over-representation Analysis | Hypergeometric test | Fast | Predefined gene lists | Varies by dataset |
The gdGSE algorithm has demonstrated remarkable concordance (>90%) with experimentally validated drug mechanisms in patient-derived xenografts and estrogen receptor-positive breast cancer cell lines, highlighting its utility in pharmaceutical development [25]. This performance advantage makes it particularly valuable for drug discovery applications where experimental validation remains crucial.
Experimental Protocols
Core Protocol for GSEA Benchmarking
Protocol 1: Framework for Benchmarking GSEA Performance
Dataset Curation
- Obtain RNA-seq data from curated repositories (e.g., TCGA, GEO)
- Select datasets with paired tumor/non-tumor samples to control for intertumor heterogeneity
- Apply quality filters: remove FFPE samples, require minimum sample size (n=10 per group)
- Format data: raw counts, FPKM, FPKM-UQ, or TPM values
Positive-Control Pathway Selection
- Download comprehensive gene set collections (e.g., MSigDB v7.0+)
- Filter gene sets using disease annotations matching experimental conditions
- Apply statistical thresholds: require minimum of 5 pathways per cancer type
- Generate random gene set ensembles for specificity assessment
GSEA Implementation
- Execute GSEA v4.3.2+ with multiple modality configurations
- Run both gene-set and phenotype permutations (n=1000 minimum)
- Test all enrichment statistic options: classic, weighted, Signal2Noise, t-test
- Apply false discovery rate (FDR) correction (Benjamini-Hochberg)
Performance Quantification
- Calculate sensitivity using positive-control pathways
- Determine specificity using random gene set ensembles
- Compute Enrichment Evidence Score (EES) for consensus analysis
- Generate receiver operating characteristic (ROC) curves
This protocol establishes a standardized framework that enables direct comparison between different GSEA tools and modalities. The use of positive-control pathways derived from matched biological conditions ensures that performance metrics reflect real-world analytical scenarios [92].
Specialized Protocol for Drug Development Applications
Protocol 2: GSEA for Compound Mechanism of Action Analysis
Experimental Design
- Treat cell lines with compounds across multiple concentrations and timepoints
- Include appropriate controls (vehicle, positive controls)
- Use minimum triplicate biological replicates
RNA-seq Processing
- Isolate RNA using standardized kits (e.g., Qiagen, Zymo Research)
- Prepare libraries with poly-A selection or rRNA depletion
- Sequence with minimum 30M reads per sample, 150bp paired-end
- Process data: alignment (STAR), quantification (featureCounts), normalization (TPM)
Pathway Analysis Pipeline
- Perform differential expression (DESeq2, edgeR)
- Rank genes by signed p-values or fold changes
- Execute GSEA against relevant pathway databases (KEGG, Reactome, GO)
- Apply gdGSE algorithm for discretized expression analysis
- Compute enrichment scores for hallmark pathways
Validation and Interpretation
- Compare results to known compound signatures (LINCS, CMap)
- Identify significantly enriched pathways (FDR < 0.25)
- Perform leading-edge analysis to identify core enriched genes
- Integrate with phosphoproteomics data where available
This specialized protocol emphasizes the discretization approach of gdGSEA, which has shown enhanced performance in quantifying cancer stemness and predicting drug mechanisms [25]. The inclusion of validation against established compound signature databases increases the translational relevance of findings.
Visualization of Analytical Workflows
GSEA Benchmarking Workflow
Diagram 1: GSEA benchmarking workflow for sensitivity and specificity assessment
EES Consensus Pathway Identification
Diagram 2: EES consensus framework for pathway identification
Research Reagent Solutions
Table 3: Essential Research Reagents and Computational Tools for GSEA
| Category | Specific Tool/Resource | Function | Application Note |
|---|---|---|---|
| RNA-seq Analysis | RnaXtract Pipeline | End-to-end bulk RNA-seq analysis | Integrates quality control, expression quantification, and variant calling [94] |
| Pathway Databases | MSigDB (v7.0+) | Curated gene set collection | Provides 33,591 gene sets for comprehensive analysis [92] |
| Enrichment Algorithms | GSEA (v4.3.2+) | Gold-standard enrichment analysis | Supports gene-set and phenotype permutations [92] |
| Enrichment Algorithms | blitzGSEA Python package | Rapid GSEA implementation | Uses Gamma approximation for speed [93] |
| Enrichment Algorithms | gdGSE R package | Discretized expression analysis | Enhances cancer stemness quantification [25] |
| Visualization | Reactome Pathway Browser | Pathway visualization and analysis | Enables expression data overlay on pathway diagrams [95] |
| Validation Databases | TCGA Data Portal | Clinical RNA-seq datasets | Provides harmonized data for benchmarking [92] |
| Validation Databases | Chernobyl Tissue Bank | Radiation-associated transcriptomes | Independent validation dataset [92] |
Discussion and Implementation Guidance
The benchmarking data presented reveals that methodological choices significantly impact GSEA results and interpretation. The classic gene-set permutation approach provides an optimal balance of sensitivity and specificity for most applications, while specialized algorithms like gdGSE offer advantages for specific use cases such as drug mechanism identification [92] [25].
The Enrichment Evidence Score (EES) emerges as a valuable consensus metric, demonstrating remarkable agreement between pathways identified in TCGA data and independent cohorts despite differences in cancer etiology [92]. This suggests an EES-based strategy where researchers can identify a core set of high-consensus pathways complemented by an expanded set for exploratory analysis.
For drug development applications, we recommend implementing Protocol 2 with both standard GSEA and gdGSE algorithms to leverage their complementary strengths. The high concordance (>90%) between gdGSE results and experimental validation data makes it particularly valuable for prioritizing pathways during target identification and compound optimization phases [25].
Future benchmarking efforts should expand to include single-cell RNA-seq applications and multi-omics pathway integration, as these technologies are rapidly being adopted in pharmaceutical development. The framework established here provides a foundation for such extended evaluations.
Conclusion
Gene Set Enrichment Analysis is a powerful and nuanced technique for extracting biological meaning from bulk RNA-seq data. Mastering it requires a solid grasp of its conceptual foundation, a rigorous methodological workflow, and an awareness of its limitations, particularly concerning statistical power in underpowered experiments. By understanding the distinct roles of GSEA, ORA, and topology-based methods, researchers can select the most appropriate tool for their specific biological question. The future of pathway analysis lies in the robust integration of GSEA findings with other data modalities, such as single-cell RNA-seq and genomic variants, and in the continued development of methods that improve replicability. For biomedical research, this translates into more reliable biomarker discovery, a deeper understanding of disease mechanisms, and better-informed drug development strategies.
References
- 1. GSEA [https://www.gsea-msigdb.org/]
- 2. What is Gene Set Enrichment Analysis? [https://www.cd-genomics.com/resource-what-is-gene-set-enrichment-analysis.html]
- 3. Gene set enrichment analysis [https://en.wikipedia.org/wiki/Gene_set_enrichment_analysis]
- 4. GSEA (v14) [https://www.genepattern.org/modules/docs/GSEA/14/]
- 5. Gene Set Enrichment Analysis (GSEA) [https://bio-protocol.org/bio101/r8766065]
- 6. Pathway enrichment analysis and visualization of omics data ... [https://pmc.ncbi.nlm.nih.gov/articles/PMC6607905/]
- 7. 18. Gene set enrichment and pathway analysis [https://www.sc-best-practices.org/conditions/gsea_pathway.html]
- 8. Gene Set Variation Analysis - Dave Tang's blog [https://davetang.org/muse/2025/01/06/gene-set-variation-analysis/]
- 9. Replicability of bulk RNA-Seq differential expression and ... [https://journals.plos.org/ploscompbiol/article?id=10.1371/journal.pcbi.1011630]
- 10. Comprehensive analysis of scRNA-seq and bulk RNA-seq ... [https://bmccancer.biomedcentral.com/articles/10.1186/s12885-025-14051-w]
- 11. Pathway Analysis vs Gene Set Analysis [https://advaitabio.com/science/pathway-analysis-vs-gene-set-analysis/]
- 12. Over-representation - Introduction to Bulk RNAseq data analysis [https://bioinformatics-core-shared-training.github.io/Bulk_RNASeq_Course_March23/Bulk_RNAseq_Course_Base/Markdowns/10_Gene_set_testing.html]
- 13. Gene set enrichment and pathway analysis [https://rnabio.org/module-08-scrna/0008/05/01/Gene_set_enrichment/]
- 14. Pathway Analysis: ANOVA vs. Enrichment Analysis [https://help.partek.illumina.com/partek-flow/blog-posts/pathway-analysis-anova-vs.-enrichment-analysis]
- 15. Bulk RNAseq Methodology and Analysis Guide [https://www.cores.emory.edu/eicc/_includes/documents/sections/resources/RNAseq_Methodology.html]
- 16. [Tutorial] Bulk RNA-seq DE analysis [https://informatics.fas.harvard.edu/resources/tutorials/differential-expression-analysis/]
- 17. Gene set enrichment analysis - RNA-seq - GitHub Pages [https://alexslemonade.github.io/refinebio-examples/03-rnaseq/pathway-analysis_rnaseq_02_gsea.html]
- 18. GSEA vs ORA: Two key pathway analysis approach... [https://pluto.bio/resources/Learning%20Series/gsea-vs-ora-two-key-pathway-analysis-approaches-for-next-gen-sequencing-data]
- 19. Gene Set Enrichment Analysis · Pathway Guide [https://www.pathwaycommons.org/guide/primers/data_analysis/gsea/]
- 20. Application of Gene Set Enrichment Analysis for Identification ... [https://pmc.ncbi.nlm.nih.gov/articles/PMC6106787/]
- 21. GSEA Enrichment Analysis: A Quick Guide to ... [https://www.metwarebio.com/gsea-enrichment-analysis-guide/]
- 22. Module 3 Lab: GSEA Visualization | Pathways - GitHub Pages [https://baderlab.github.io/CBW_Pathways_2021/gsea-mod3.html]
- 23. Drug mechanism enrichment analysis improves prioritization ... [https://bmcbioinformatics.biomedcentral.com/articles/10.1186/s12859-023-05343-8]
- 24. Integrative differential expression and gene set enrichment ... [https://www.nature.com/articles/s41467-020-15298-6]
- 25. gdGSE: An algorithm to evaluate pathway enrichment by ... [https://www.sciencedirect.com/science/article/pii/S200103702500159X]
- 26. Enrichr - Ma'ayan Lab – Computational Systems Biology [https://maayanlab.cloud/enrichr/]
- 27. Differential gene expression analysis pipelines and ... [https://pmc.ncbi.nlm.nih.gov/articles/PMC10951429/]
- 28. Bulk RNA-sequencing pipeline and differential gene ... - Erick Lu [https://erilu.github.io/bulk-rnaseq-analysis/]
- 29. Bulk RNA-seq Data Standards and Processing Pipeline [https://www.encodeproject.org/data-standards/rna-seq/long-rnas/]
- 30. Gene Set Enrichment Analysis (GSEA) [https://bio-protocol.org/exchange/minidetail?id=16125447&type=30]
- 31. 10 Best Practices for Effective RNA-Seq Data Analysis - Focal [https://www.getfocal.co/post/10-best-practices-for-effective-rna-seq-data-analysis]
- 32. Upload Gene and Proteins in Bulk [https://portal.genexplain.com/build_hp/idb/1.0/html/bkldoc/source/bkl/tools/retriever/retriever_property_advanced2.html]
- 33. The Molecular Signatures Database (MSigDB) hallmark gene ... [https://pmc.ncbi.nlm.nih.gov/articles/PMC4707969/]
- 34. GSEA | MSigDB [https://www.gsea-msigdb.org/gsea/msigdb]
- 35. Mouse MSigDB Collections [https://www.gsea-msigdb.org/gsea/msigdb/mouse/collections.jsp]
- 36. MSigDB | Browse Human Gene Sets [https://www.gsea-msigdb.org/gsea/msigdb/genesets.jsp]
- 37. Human MSigDB Collections: Details and Acknowledgments [https://www.gsea-msigdb.org/gsea/msigdb/collection_details.jsp]
- 38. Gene ontology and pathway analysis - Bioinformatics [https://bioinformatics.ccr.cancer.gov/docs/bioinformatics-for-beginners-2025/Module3_Pathway_Analysis/Lesson15/]
- 39. Broad Institute researchers release GSEA 2.0 [https://www.broadinstitute.org/news/broad-institute-researchers-release-gsea-20]
- 40. Gene Set Enrichment Analysis with R - BTEP Coding Club [https://bioinformatics.ccr.cancer.gov/docs/btep-coding-club/CC2025/GSEA/GSEA/]
- 41. alserglab/fgsea: Fast Gene Set Enrichment Analysis [https://github.com/alserglab/fgsea]
- 42. Gene-set testing - RNA-seq analysis in R [https://bioinformatics-core-shared-training.github.io/RNAseq_September_2019/html/06_Gene_set_testing.html]
- 43. GSEA (v17) [https://www.genepattern.org/modules/docs/GSEA/17/]
- 44. GSEALeadingEdgeViewer (v5) [https://www.genepattern.org/modules/docs/GSEALeadingEdgeViewer/5/]
- 45. Gene Set Enrichment Analysis (GSEA) User Guide [https://www.gsea-msigdb.org/gsea/doc/GSEAUserGuideTEXT.htm]
- 46. Potential application of the bulk RNA sequencing in routine ... [https://pmc.ncbi.nlm.nih.gov/articles/PMC12013061/]
- 47. Assessment of Gene Set Enrichment Analysis using ... [https://pubmed.ncbi.nlm.nih.gov/38753612/]
- 48. ssGSEAProjection (v4) [https://www.genepattern.org/modules/docs/ssGSEAProjection/4/]
- 49. Single Sample Gene Set Enrichment Analysis (ssGSEA) [https://ckg.readthedocs.io/en/latest/notebooks/recipes/ssGSEA_with_PCA.html]
- 50. 6. Developmental Guide — GSEApy 1.1.8 documentation [https://gseapy.readthedocs.io/en/latest/run.html]
- 51. Single sample scoring of molecular phenotypes [https://bmcbioinformatics.biomedcentral.com/articles/10.1186/s12859-018-2435-4]
- 52. GSEA Analysis Tutorial: Gene Set Collections and Best ... [https://bigomics.ch/blog/a-short-guide-to-gene-set-and-pathway-enrichment-analysis/]
- 53. Pathway enrichment analysis and visualization of omics ... [https://cytoscape.org/cytoscape-tutorials/protocols/enrichmentmap-pipeline/]
- 54. Gene Set Enrichment Analysis with ClusterProfiler [https://learn.gencore.bio.nyu.edu/rna-seq-analysis/gene-set-enrichment-analysis/]
- 55. A web-based tool that integrates data visualization and ... [https://www.nature.com/articles/s41598-023-34163-2]
- 56. Replicability of bulk RNA-Seq differential expression and ... [https://pmc.ncbi.nlm.nih.gov/articles/PMC12077797/]
- 57. Improving reproducibility of differentially expressed genes ... [https://www.nature.com/articles/s41467-025-62579-z]
- 58. A strategy for evaluating pathway analysis methods - PMC [https://pmc.ncbi.nlm.nih.gov/articles/PMC5640951/]
- 59. Pathway size matters: the influence of ... - BMC Genomics [https://bmcgenomics.biomedcentral.com/articles/10.1186/s12864-021-07502-8]
- 60. Evaluation of Pathway Activation for a Single Sample ... [https://pmc.ncbi.nlm.nih.gov/articles/PMC7013001/]
- 61. Human MSigDB Collections [https://www.gsea-msigdb.org/gsea/msigdb/human/collections.jsp]
- 62. The Molecular Signatures Database Hallmark Gene Set ... [https://www.sciencedirect.com/science/article/pii/S2405471215002185]
- 63. Chapter 6 Enrichment analyses | Omics Data Analysis [https://uclouvain-cbio.github.io/WSBIM2122/sec-gsea.html]
- 64. A gene set enrichment analysis for cancer hallmarks [https://www.sciencedirect.com/science/article/pii/S209517792400162X]
- 65. GSEAPreranked (v1) [https://www.genepattern.org/modules/docs/GSEAPreranked/1/]
- 66. Ranking metrics in gene set enrichment analysis: do they ... [https://bmcbioinformatics.biomedcentral.com/articles/10.1186/s12859-017-1674-0]
- 67. GeneSetCluster 2.0: a comprehensive toolset for summarizing ... [https://bmcbioinformatics.biomedcentral.com/articles/10.1186/s12859-025-06249-3]
- 68. Protocol for analysis of RNA-sequencing and proteome ... [https://pmc.ncbi.nlm.nih.gov/articles/PMC9133752/]
- 69. Twist RNA Sequencing Workflow Solutions [https://www.twistbioscience.com/products/ngs/rna-sequencing-solutions]
- 70. Nine quick tips for pathway enrichment analysis - PMC [https://pmc.ncbi.nlm.nih.gov/articles/PMC9371296/]
- 71. Over-representation analysis - RNA-Seq - GitHub Pages [https://alexslemonade.github.io/refinebio-examples/03-rnaseq/pathway-analysis_rnaseq_01_ora.html]
- 72. GOAT: efficient and robust identification of gene set ... [https://www.nature.com/articles/s42003-024-06454-5]
- 73. Functional Enrichment Analysis [https://cytoscape.org/cytoscape-tutorials/protocols/functional-enrichment-analysis/]
- 74. GOREA: Unbiased Interpretation of Functional Enrichment [https://pmc.ncbi.nlm.nih.gov/articles/PMC12552962/]
- 75. Topology-aware pathway analysis of spatial transcriptomics [https://pubmed.ncbi.nlm.nih.gov/40827204/]
- 76. Drug target inference through pathway analysis of ... [https://pmc.ncbi.nlm.nih.gov/articles/PMC3672337/]
- 77. Integration of chromosome conformation and gene expression ... [https://pmc.ncbi.nlm.nih.gov/articles/PMC12271745/]
- 78. QIAGEN Ingenuity Pathway Analysis (IPA) [https://digitalinsights.qiagen.com/products-overview/discovery-insights-portfolio/analysis-and-visualization/qiagen-ipa/]
- 79. Human Gene Set: GOCC_CHROMATIN [https://www.gsea-msigdb.org/gsea/msigdb/human/geneset/GOCC_CHROMATIN]
- 80. Gene set analysis methods: a systematic comparison [https://biodatamining.biomedcentral.com/articles/10.1186/s13040-018-0166-8]
- 81. Differential Gene Set Enrichment Analysis: a statistical ... [https://pmc.ncbi.nlm.nih.gov/articles/PMC8453775/]
- 82. A Reproducibility Focused Meta-Analysis Method for Single ... [https://pmc.ncbi.nlm.nih.gov/articles/PMC11507907/]
- 83. Transcriptomic analysis and machine learning modeling ... [https://pmc.ncbi.nlm.nih.gov/articles/PMC12209200/]
- 84. Identification of post-translational modification-related ... [https://www.nature.com/articles/s41598-025-22997-x]
- 85. Integrated analysis of single-cell RNA-seq and bulk RNA-seq ... [https://pmc.ncbi.nlm.nih.gov/articles/PMC12548165/]
- 86. Integrating bulk and single cell RNA-seq refines ... [https://elifesciences.org/reviewed-preprints/106183]
- 87. Single-cell RNA sequencing and multi-omics analysis of ... [https://link.springer.com/article/10.1007/s00262-025-04101-4]
- 88. Gene-set enrichment analysis and visualization on the web ... [https://pmc.ncbi.nlm.nih.gov/articles/PMC12373637/]
- 89. Introduction to scRNA-seq integration [https://satijalab.org/seurat/articles/integration_introduction]
- 90. Integration of Single-Cell RNA-Seq Datasets [https://pmc.ncbi.nlm.nih.gov/articles/PMC9982060/]
- 91. mitch: multi-contrast pathway enrichment for multi-omics and ... [https://bmcgenomics.biomedcentral.com/articles/10.1186/s12864-020-06856-9]
- 92. Assessment of Gene Set Enrichment Analysis using ... [https://pmc.ncbi.nlm.nih.gov/articles/PMC11098418/]
- 93. blitzGSEA: efficient computation of gene set enrichment ... [https://www.rna-seqblog.com/blitzgsea-efficient-computation-of-gene-set-enrichment-analysis-in-python/]
- 94. RnaXtract, a tool for extracting gene expression, variants ... [https://www.nature.com/articles/s41598-025-16875-9]
- 95. Analysis Tools - Reactome Pathway Database [https://reactome.org/userguide/analysis]