mRNA vs Total RNA Sequencing: A Bulk RNA-seq Guide for Research and Drug Development
This article provides a comprehensive guide for researchers and drug development professionals on choosing between bulk mRNA and total RNA sequencing.
mRNA vs Total RNA Sequencing: A Bulk RNA-seq Guide for Research and Drug Development
Abstract
This article provides a comprehensive guide for researchers and drug development professionals on choosing between bulk mRNA and total RNA sequencing. It covers foundational principles, methodological workflows, and application-specific selection criteria. The content addresses common experimental challenges, including sample size optimization and data analysis, and explores validation strategies through comparative analysis with single-cell techniques. By synthesizing current methodologies and market trends, this guide aims to inform robust experimental design and effective utilization of RNA-seq technologies in biomedical research.
Decoding the Transcriptome: Core Principles of mRNA and Total RNA Sequencing
In the field of genomics, the transcriptome represents the complete set of RNA transcripts produced by the genome at a specific time and under specific conditions [1]. Unlike the static genome, the transcriptome is dynamic, changing in response to developmental stages, environmental stimuli, and disease states, thus providing a snapshot of active biological processes [1] [2]. For researchers investigating gene expression in bulk tissues, two principal methodological approaches have emerged: coding mRNA sequencing and whole transcriptome (total RNA) sequencing. The choice between these strategies significantly influences the breadth of biological information that can be captured, the experimental design, and the interpretation of results [3] [4].
This technical guide examines the fundamental distinctions between these approaches, their appropriate applications in research and drug development, and provides a framework for selecting the optimal method based on specific research objectives. Understanding these technologies is crucial for designing experiments that can effectively answer specific biological questions, particularly in precision oncology, biomarker discovery, and therapeutic development [5] [6].
Core Technological Differences
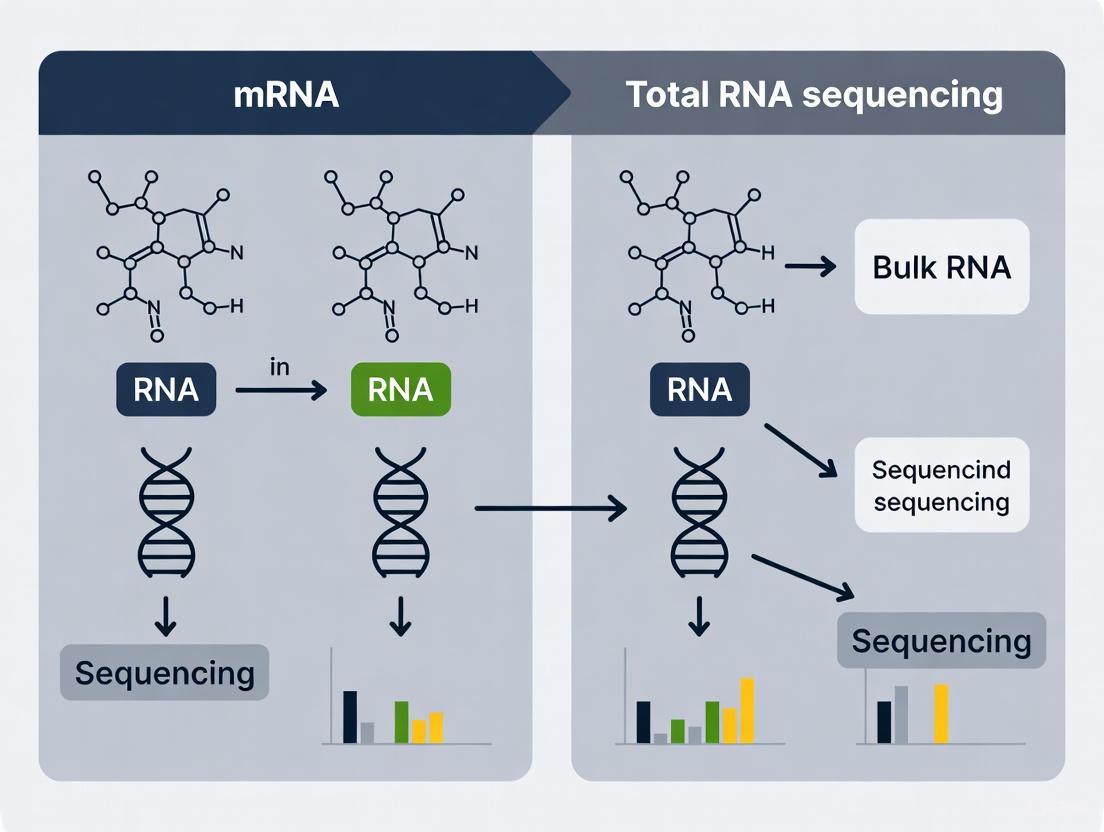
The fundamental distinction between coding mRNA sequencing and whole transcriptome sequencing lies in the scope of RNA species captured during library preparation. This initial decision determines the landscape of biological information accessible in downstream analyses.
Capturing the Coding Transcriptome: mRNA Sequencing
mRNA sequencing (mRNA-Seq) employs a targeted strategy designed to enrich for messenger RNA, which constitutes only 3-7% of the total RNA in a typical mammalian cell [4] [7]. This method capitalizes on the polyadenylated (poly-A) tail that characterizes most mature eukaryotic mRNAs. During library preparation, oligo(dT) primers complementary to the poly-A tail are used to selectively reverse-transcribe these mRNAs into cDNA, effectively isolating them from the abundant non-polyadenylated RNA species [3] [8]. The primary advantage of this approach is its efficiency; by focusing sequencing resources on protein-coding transcripts, it provides superior depth for gene expression quantification while minimizing wasted reads on non-informative RNA types like ribosomal RNA (rRNA) [8] [4].
Capturing the Complete RNA Landscape: Total RNA Sequencing
Whole transcriptome sequencing (Total RNA-Seq) takes a comprehensive approach by aiming to sequence all RNA molecules, both coding and non-coding. Since ribosomal RNA can constitute 80-90% of the total RNA content, a critical preprocessing step involves the depletion of rRNA using sequence-specific probes, without distinguishing between polyadenylated and non-polyadenylated transcripts [9] [4]. This preservation of the entire RNA population enables researchers to investigate not only protein-coding genes but also a diverse array of non-coding RNAs, including long non-coding RNAs (lncRNAs), microRNAs (miRNAs), and other regulatory RNA elements that lack poly-A tails [9]. This unbiased capture provides a systems-level view of transcriptional activity.
The workflow differences are illustrated in the following diagram:
Comparative Analysis of Methods
The choice between mRNA-Seq and Total RNA-Seq involves trade-offs between comprehensiveness, cost, sensitivity, and technical requirements. The table below summarizes the key characteristics of each method:
| Parameter | mRNA Sequencing | Whole Transcriptome Sequencing |
|---|---|---|
| Target RNA Species | Polyadenylated mRNA [3] [8] | All RNA species (coding and non-coding) except rRNA [9] [4] |
| Key Enrichment Method | Poly(A) selection [4] | Ribosomal RNA depletion [9] |
| Typical Read Depth | 25-50 million reads/sample [4] | 100-200 million reads/sample [4] |
| Ideal Applications | Differential gene expression, large-scale screening [3] | Novel transcript discovery, splicing analysis, non-coding RNA study [3] [9] |
| Strength | Cost-effective for coding transcriptome, higher depth for mRNA, simpler analysis [3] [4] | Comprehensive view, detects non-coding RNAs, not dependent on poly-A tails [9] |
| Limitation | Misses non-polyadenylated transcripts, 3' bias in some protocols [3] | Higher cost per sample, more complex data analysis, requires more input RNA [4] |
| Sample Quality Requirements | Requires high-quality RNA with intact 3' ends [3] | More tolerant of partial RNA degradation [3] |
Performance and Outcome Comparisons
Studies have directly compared these methodologies to evaluate their performance. Ma et al. (2019) found that while whole transcriptome sequencing detected more differentially expressed genes, 3' mRNA-Seq (a specific form of mRNA sequencing) was more effective at detecting short transcripts and provided highly similar biological conclusions in pathway analyses [3]. The reproducibility between biological replicates was similar for both methods [3].
When examining pathway analysis results, the top upregulated gene sets identified by whole transcriptome sequencing were consistently captured by 3' mRNA-Seq, though with some variation in statistical ranking beyond the very top hits [3]. This suggests that for many experimental goals, particularly those focused on identifying major pathway alterations rather than subtle, secondary effects, both methods can provide biologically congruent results.
Experimental Design and Protocol Guidance
mRNA Sequencing Workflow
The standard mRNA-Seq protocol involves several key stages:
RNA Extraction and QC: Isolate total RNA using appropriate methods. Assess RNA quality and integrity using methods such as RIN (RNA Integrity Number). A minimum of 25 ng of high-quality (RIN > 8) input RNA is recommended for standard kits [8].
Poly(A) Enrichment: Incubate total RNA with oligo(dT) magnetic beads to bind polyadenylated RNA. Wash away non-polyA RNA, then elute the enriched mRNA [8] [4].
Library Preparation: Fragment the purified mRNA and reverse transcribe using random primers. Synthesize the second strand. Ligate sequencing adapters, often including unique molecular identifiers (UMIs) to correct for PCR amplification bias [8].
Sequencing: For differential expression analysis, single-read sequencing of 50-75 bp length at a depth of 25-50 million reads per sample is typically sufficient. For isoform identification, paired-end sequencing is recommended [6].
Total RNA Sequencing Workflow
The Total RNA-Seq protocol differs primarily in the enrichment strategy:
RNA Extraction and QC: Isolate total RNA. Quality control is critical, though this method is more tolerant of partially degraded samples [9].
rRNA Depletion: Use species-specific probes (e.g., Ribo-Zero, RiboMinus) to hybridize and remove abundant ribosomal RNAs. This preserves both polyA+ and polyA- transcripts, including non-coding RNAs [9] [4].
Library Preparation: Fragment the rRNA-depleted RNA and convert to cDNA using random primers. This approach generates reads distributed across the entire transcript length, enabling detection of splicing variants and structural alterations [9].
Sequencing: Requires deeper sequencing (100-200 million reads/sample) to adequately cover the diverse transcriptome. Paired-end sequencing is recommended for most applications to facilitate transcript assembly and variant detection [6] [4].
The following diagram illustrates the key decision points in selecting the appropriate methodology:
Essential Research Reagents and Tools
Successful implementation of transcriptome studies requires careful selection of reagents and tools. The following table outlines key solutions for researchers:
| Reagent/Tool Category | Examples | Function & Importance |
|---|---|---|
| MRNA Enrichment Kits | Oligo(dT) Magnetic Beads, Poly(A) Pull-down | Selectively isolates polyadenylated mRNA from total RNA, crucial for reducing non-coding background [8] [4] |
| rRNA Depletion Kits | Ribo-Zero, RiboMinus | Removes abundant ribosomal RNA (constitutes 80-90% of total RNA) to enable sequencing of other RNA species [9] [4] |
| Library Prep Systems | Illumina Stranded mRNA Prep, Illumina Stranded Total RNA Prep | Converts RNA to sequencing-ready libraries while preserving strand information; kit selection depends on RNA input type [9] [8] |
| RNA Integrity Tools | Bioanalyzer, TapeStation, RIN scoring | Assesses RNA quality and degradation level; critical for determining sample suitability and interpreting results [6] |
| Sequencing Platforms | Illumina NextSeq 1000/2000, NovaSeq, MiSeq i100 | Determines throughput, read length, and cost; selection depends on project scale and required depth [8] |
| Analysis Pipelines | DRAGEN RNA Pipeline, Cell Ranger, STAR aligner | Performs alignment, quantification, and differential expression; some are optimized for specific applications [8] |
Applications in Research and Drug Development
The distinct capabilities of mRNA-Seq and Total RNA-Seq make them suitable for different phases of research and development:
Target Discovery and Validation
In early discovery phases, Total RNA-Seq provides a comprehensive landscape for identifying novel therapeutic targets, including non-coding RNAs with regulatory functions and alternative splice variants associated with disease states [9] [6]. This unbiased approach is particularly valuable in oncology, where it has enabled the discovery of novel gene fusions that drive cancer progression and can be targeted with specific inhibitors [6]. Once key targets are identified, mRNA-Seq offers a cost-effective method for validating expression patterns across large sample cohorts, providing the statistical power needed to establish clinical relevance [3] [10].
Biomarker Development
Transcriptome-based biomarkers have shown increasing utility in clinical oncology for disease classification, prognosis, and treatment prediction [5] [6]. While mRNA-Seq panels can effectively quantify established biomarker signatures, Total RNA-Seq enables the discovery of novel biomarker classes, including long non-coding RNAs and microRNAs that may offer improved diagnostic specificity [6]. For clinical implementation, focused mRNA-Seq panels (such as the FoundationOne Heme panel) provide a practical approach for detecting clinically actionable gene fusions and expression signatures in formalin-fixed paraffin-embedded (FFPE) samples [6].
Toxicological and Mechanistic Studies
In toxicology and mechanistic pharmacology, Total RNA-Seq provides a systems-level view of drug responses, capturing both intended effects on target pathways and off-target impacts on diverse biological processes [2]. The ability to monitor non-coding RNAs adds valuable insight into regulatory mechanisms that may underlie toxicity or efficacy limitations. For high-throughput compound screening, mRNA-Seq offers a streamlined approach to rank candidates based on expression changes in key pathway genes, enabling prioritization for more comprehensive follow-up studies [3] [10].
The decision between a focused coding mRNA analysis and a comprehensive whole transcriptome approach represents a fundamental strategic choice in experimental design. mRNA sequencing provides an efficient, cost-effective method for quantitative gene expression analysis, particularly suited for large-scale studies where the primary interest lies in protein-coding genes. In contrast, whole transcriptome sequencing delivers a more complete picture of transcriptional activity, enabling discovery of non-coding RNAs, splice variants, and novel transcripts that may play critical roles in disease biology.
As transcriptomics continues to evolve, these technologies will remain essential tools for unraveling the complexity of biological systems, identifying therapeutic targets, and developing clinically actionable biomarkers. By aligning methodological choices with specific research objectives and practical constraints, scientists can maximize the insights gained from their transcriptomic studies and advance drug development efforts.
In bulk RNA sequencing (RNA-Seq) research, the choice between poly(A) enrichment and ribosomal RNA (rRNA) depletion represents a fundamental methodological crossroads that directly defines the transcriptional landscape accessible for investigation. This decision is critical within the broader context of mRNA sequencing versus total RNA sequencing, as the library preparation method dictates which RNA species are captured and consequently shapes all downstream biological interpretations [11] [4]. Poly(A) enrichment selectively targets the 3' polyadenylated tails of mature messenger RNAs (mRNAs), while rRNA depletion employs removal strategies to reduce the overwhelming abundance of ribosomal RNA, thereby revealing the remainder of the transcriptome [12]. This technical guide provides an in-depth comparison of these two core approaches, detailing their mechanisms, experimental protocols, performance characteristics, and decision-making frameworks to enable researchers to align library construction with their specific scientific objectives.
Core Mechanistic Principles
Poly(A) Enrichment: Capturing Mature mRNA
Poly(A) enrichment is a targeted capture method that leverages the polyadenylated tails present on most eukaryotic mature mRNAs. The process utilizes oligo(dT) primers or probes covalently attached to magnetic beads that specifically hybridize to the poly(A) tail sequences [11] [12]. Following hybridization, magnetic separation allows for the selective isolation of polyadenylated RNAs while removing non-polyadenylated species, including rRNA, transfer RNA (tRNA), and various non-coding RNAs that lack poly(A) tails [4]. This mechanism effectively enriches for protein-coding transcripts, which typically constitute only 3-7% of the total RNA in mammalian cells [4].
A significant technical consideration is this method's inherent bias toward the 3' end of transcripts, which arises from the oligo(dT) priming location [11] [12]. This 3' bias becomes more pronounced with partially degraded RNA, such as that extracted from formalin-fixed, paraffin-embedded (FFPE) tissues, where incomplete transcripts may only retain their 3' regions [11]. Additionally, capture efficiency may vary based on poly(A) tail length, potentially underrepresenting transcripts with shorter tails [11].
rRNA Depletion: Revealing the Broader Transcriptome
Ribosomal RNA depletion takes an alternative approach by directly removing the abundant rRNA molecules that constitute approximately 80-90% of total RNA [11] [13]. This method utilizes sequence-specific DNA or locked nucleic acid (LNA) probes that are complementary to conserved rRNA regions across multiple ribosomal subunits (e.g., 18S, 28S, 5S, 5.8S) [12] [13]. Following hybridization, probe-rRNA hybrids are removed through either RNase H digestion or affinity capture with streptavidin-coated magnetic beads [12]. This depletion strategy preserves both polyadenylated and non-polyadenylated RNA species, providing a broader view of the transcriptome that includes pre-mRNA, many long non-coding RNAs (lncRNAs), circular RNAs, and other non-coding RNA classes that would be excluded by poly(A) selection [11] [4].
A critical technical consideration for rRNA depletion is the requirement for species-specific probes, which necessitates verification of probe compatibility, particularly when working with non-model organisms [11] [12]. Incomplete rRNA removal can result in high residual rRNA content, significantly reducing the effective sequencing depth for target transcripts [13].
Experimental Protocols and Methodologies
Detailed Workflow: Poly(A) Enrichment
The poly(A) enrichment protocol follows a series of standardized steps designed to selectively isolate polyadenylated RNA species. Most commercial kits, such as the Illumina TruSeq Stranded mRNA kit, utilize a robust methodology that has been extensively validated in comparative studies [14] [15].
Procedure:
- RNA Quality Assessment: Verify RNA integrity using metrics such as RNA Integrity Number (RIN) ≥ 8 or DV200 ≥ 50% to ensure suitability for poly(A) selection [11] [12].
- Oligo(dT) Hybridization: Incubate total RNA with magnetic beads conjugated to oligo(dT) primers. Typical input amounts range from 10 ng to 1 μg total RNA, with higher quality inputs yielding better enrichment [11] [14].
- Magnetic Separation: Place the reaction tube on a magnetic stand to separate bead-bound poly(A)+ RNA from the supernatant containing non-polyadenylated RNA.
- Wash Steps: Perform multiple wash steps with appropriate buffers to remove non-specifically bound RNA while maintaining poly(A)+ RNA binding.
- Elution: Release the enriched poly(A)+ RNA from the beads using elution buffer, typically with heat treatment.
- Library Construction: Proceed with standard RNA-Seq library preparation including fragmentation, reverse transcription, adapter ligation, and PCR amplification [14].
Critical Optimization Parameters:
- Beads-to-RNA Ratio: Studies demonstrate that increasing the oligo(dT) beads-to-RNA ratio significantly enhances enrichment efficiency. For yeast RNA, increasing the ratio from 13.3:1 to 50:1 reduced residual rRNA from 54.4% to 20% [13].
- Multiple Enrichment Rounds: Implementing two consecutive rounds of poly(A) selection can dramatically reduce rRNA contamination to less than 10% [13].
- RNA Input Quality: The method performs optimally with high-quality RNA; degraded samples yield strong 3' bias and underrepresentation of long transcripts [11] [12].
Detailed Workflow: rRNA Depletion
rRNA depletion protocols employ probe-based hybridization to selectively remove ribosomal RNA, preserving the diversity of the remaining transcriptome. Commercial kits such as the RiboMinus Transcriptome Isolation Kit use species-specific probes tailored to particular organisms [13].
Procedure:
- Probe Hybridization: Incubate total RNA with biotinylated DNA or LNA probes complementary to rRNA sequences (e.g., 18S, 28S, 5S, 5.8S). Input requirements are typically flexible, accommodating 100 ng to 1 μg of total RNA, including degraded samples [11] [12].
- rRNA-Probe Complex Removal: Add streptavidin-coated magnetic beads to bind the biotinylated probe-rRNA complexes, followed by magnetic separation to remove rRNA from the solution.
- Supernatant Collection: Recover the supernatant containing the rRNA-depleted RNA.
- RNA Purification: Concentrate and clean the rRNA-depleted RNA using ethanol precipitation or commercial cleanup kits.
- Library Construction: Proceed with standard RNA-Seq library preparation. The resulting libraries typically exhibit more uniform coverage across transcript bodies compared to poly(A)-enriched libraries [11].
Critical Optimization Parameters:
- Probe Specificity: Ensure probe sets match the target organism's rRNA sequences. Mismatched probes result in high residual rRNA levels, sometimes exceeding 40-50% of total reads [11] [13].
- Sample Compatibility: This method is particularly effective for prokaryotic samples, degraded RNA (FFPE, low RIN), and non-model organisms where poly(A) tails may be absent or variable [11] [12].
- Comprehensive Depletion: Verify that the probe set targets all abundant rRNA species, including 5S rRNA, which is sometimes overlooked in commercial kits [13].
Performance Comparison and Data Output Analysis
Direct comparative studies reveal significant differences in the performance characteristics and data output between poly(A) enrichment and rRNA depletion methods. These differences have profound implications for experimental design, sequencing depth requirements, and analytical approaches.
Quantitative Performance Metrics
Table 1: Comparative Performance of Library Preparation Methods
| Performance Metric | Poly(A) Enrichment | rRNA Depletion |
|---|---|---|
| Usable exonic reads (blood) | 71% | 22% |
| Usable exonic reads (colon) | 70% | 46% |
| Extra reads needed for same exonic coverage | — | +220% (blood), +50% (colon) |
| Sequencing depth requirement | Lower (e.g., 13.5M reads for microarray-equivalent detection) | Higher (35-65M reads) |
| Transcript types captured | Mature, coding mRNAs, polyadenylated lncRNAs | Coding + noncoding (lncRNAs, snoRNAs, pre-mRNA) |
| 3'–5' coverage uniformity | Pronounced 3' bias | More uniform coverage |
| Performance with low-quality/FFPE samples | Reduced efficiency | Robust with degraded RNA |
| Residual rRNA content | Very low (<5%) | Variable (5-50%) depending on probe efficiency |
The data in Table 1 highlights a fundamental trade-off: poly(A) enrichment provides higher efficiency for capturing protein-coding sequences, while rRNA depletion offers broader transcriptome coverage at the cost of higher sequencing depth requirements. The substantial difference in usable exonic reads means that to achieve similar coverage of coding regions, rRNA depletion requires 50-220% more sequencing reads depending on tissue type, directly impacting project costs [11].
Impact on Transcriptome Analysis
Different library preparation methods can influence biological interpretations in transcriptome analysis:
Gene Expression Quantification: Studies comparing library preparation methods have found that while the lists of differentially expressed genes may vary between methods, the enriched biological pathways show strong concordance. One study found that a low-input, strand-specific rRNA depletion kit (SMARTer Stranded Total RNA-Seq Kit) identified 55% fewer differentially expressed genes compared to TruSeq poly(A) enrichment, but pathway enrichment conclusions remained consistent [15].
Alternative Splicing Analysis: The traditional TruSeq poly(A) method demonstrated superior performance for detecting splicing events, identifying approximately twice as many alternative splicing events (alternative 5' and 3' splicing sites, exon skipping, intron retention) compared to full-length cDNA methods [14]. The uniform coverage provided by rRNA depletion can be advantageous for splicing analysis despite lower overall detection rates.
Anti-sense Transcription: Strand-specific rRNA depletion protocols have shown enhanced sensitivity for detecting anti-sense transcription compared to poly(A) selection, with approximately 1.5% of gene-mapping reads corresponding to anti-sense strands versus 0.5% in TruSeq [15].
Decision Framework and Applications
Method Selection Guidelines
Choosing between poly(A) enrichment and rRNA depletion requires careful consideration of experimental goals, sample characteristics, and resource constraints. The following decision framework provides guidance for method selection:
Table 2: Decision Matrix for Library Preparation Method Selection
| Experimental Scenario | Recommended Method | Rationale | Considerations |
|---|---|---|---|
| Eukaryotic RNA, high quality (RIN ≥8), coding mRNA focus | Poly(A) Enrichment | High exonic read yield (~70%), cost-effective for gene expression | Coverage skews to 3' end as RNA quality decreases |
| Degraded/FFPE samples, low RIN | rRNA Depletion | Tolerant of fragmentation, doesn't rely on intact poly(A) tails | Higher intronic/intergenic reads; verify probe matching |
| Non-coding RNA analysis (lncRNAs, snoRNAs, histone mRNAs) | rRNA Depletion | Captures both poly(A)+ and non-poly(A) species | Residual rRNA may reduce effective sequencing depth |
| Prokaryotic transcriptomics | rRNA Depletion | Poly(A) capture ineffective for bacterial mRNA | Requires species-specific rRNA probes |
| Alternative splicing/isoform analysis | rRNA Depletion | More uniform coverage across transcript body | Detects fewer splicing events than TruSeq [14] |
| Low-input samples (<10 ng total RNA) | Poly(A) Enrichment | More efficient with limited material, used in single-cell protocols | May require protocol modifications for ultralow inputs |
| Large-scale gene expression studies | Poly(A) Enrichment | Lower sequencing costs, simplified analysis | Limited to polyadenylated transcripts |
The Scientist's Toolkit: Essential Reagents and Solutions
Table 3: Key Research Reagent Solutions for RNA-Seq Library Preparation
| Reagent/Kit | Function | Application Notes |
|---|---|---|
| Oligo(dT) Magnetic Beads | Selective capture of polyadenylated RNA via hybridization to poly(A) tails | Efficiency improves with increased beads-to-RNA ratio; optimal performance requires high-quality RNA [13] |
| Sequence-Specific rRNA Depletion Probes | Hybridize to ribosomal RNA for selective removal | Species-specific design critical; incomplete coverage leads to high residual rRNA [11] [13] |
| Strand-Specific Library Prep Kits | Maintain transcript orientation information during cDNA synthesis | Essential for identifying antisense transcription; multiple kits now compatible with both methods [15] |
| RNA Integrity Assessment Reagents | Evaluate RNA quality (RIN, DV200) | Critical for method selection; poly(A) enrichment requires RIN ≥8 for optimal performance [12] |
| RNase H Enzyme | Degrades RNA in DNA-RNA hybrids | Used in specific rRNA depletion protocols for targeted rRNA degradation [12] |
The strategic decision between poly(A) enrichment and rRNA depletion for RNA-Seq library preparation fundamentally shapes the scope and focus of transcriptomic investigations. Poly(A) enrichment offers an efficient, cost-effective approach for profiling mature mRNA expression in high-quality eukaryotic samples, while rRNA depletion provides a comprehensive view of the transcriptome that includes diverse non-coding RNA species and performs robustly with challenging sample types. The methodological choice should be guided by experimental objectives, sample characteristics, and resource constraints rather than technical convenience. As sequencing technologies continue to evolve, understanding these core differences empowers researchers to design more informed experiments, optimize resource allocation, and extract biologically meaningful insights from their transcriptomic data.
In the field of transcriptomics, the choice between mRNA sequencing and total RNA sequencing is foundational, dictating the scope, quality, and type of biological insights a study can yield. This decision hinges on a clear understanding of the quantitative and qualitative data each method produces. mRNA sequencing, often focusing on the 3' end of transcripts, is engineered for precise, cost-effective quantification of gene expression levels. In contrast, total RNA sequencing (or Whole Transcriptome Sequencing) provides a comprehensive, qualitative view of the entire transcriptome, enabling the discovery of novel isoforms, fusion genes, and non-coding RNA biology. This guide delineates the technical strengths of each approach within the context of bulk RNA research, providing researchers and drug development professionals with the framework necessary to select the optimal method for their specific experimental goals.
Core Methodological Differences and Their Impact on Data
The nature of the data generated—whether richly quantitative or broadly qualitative—is fundamentally determined by the library preparation protocol.
mRNA Sequencing (3’ mRNA-Seq)
This method is designed for accurate digital counting of transcripts. Library preparation typically uses oligo(dT) primers to target the poly-A tails of protein-coding messenger RNAs (mRNA) [16] [17]. This results in sequencing reads that are clustered at the 3' end of transcripts. A key advantage is that it generates one fragment per transcript, which simplifies downstream quantification and eliminates the need for complex normalization based on transcript length [16]. This streamlined process is not only cost-effective but also robust for degraded samples, such as those from FFPE tissues, as it only requires the 3' end of the transcript to be intact [16].
Total RNA Sequencing (Whole Transcriptome Sequencing)
This approach aims to capture a complete picture of the transcriptional landscape. It starts with total RNA and uses random primers for cDNA synthesis, which facilitates an even coverage of the entire transcript length [16] [17]. To prevent ribosomal RNA (rRNA), which can constitute 80-90% of total RNA, from dominating the sequencing library, a critical depletion step is performed [4] [17]. This allows for the detection of both poly-adenylated and non-polyadenylated RNA species, including long non-coding RNAs (lncRNAs), microRNAs, and other non-coding RNAs [4]. The requirement for full-transcript coverage demands a higher sequencing depth than 3' mRNA-Seq to power qualitative discoveries [16] [17].
The logical relationship between methodological choices and their downstream consequences for data output can be visualized as follows:
Quantitative and Qualitative Data Outputs: A Detailed Comparison
The methodological divergence directly translates into distinct data outputs, each with unique strengths.
Quantitative Strengths of 3’ mRNA-Seq
- Accurate Gene Expression Quantification: By generating a single read count per transcript, 3' mRNA-Seq provides a direct digital measure of gene abundance that is not skewed by transcript length [16].
- Cost-Effectiveness for Large Studies: Due to its lower required sequencing depth (typically 1-5 million reads per sample), it is ideal for profiling large numbers of samples, such as in high-throughput drug screening or large cohort studies [16].
- Robustness with Challenging Samples: It performs reliably with partially degraded RNA (e.g., from FFPE samples) because its target region—the 3' end—is more likely to survive degradation [16] [17].
Qualitative Strengths of Total RNA-Seq
- Discovery of Novel Transcripts and Isoforms: Full-transcript coverage allows for the identification of novel splice variants, fusion genes, and untranslated regions (UTRs) [16] [18].
- Analysis of the Non-Coding Transcriptome: It is the only option for profiling non-coding RNAs (e.g., lncRNAs, miRNAs) that lack poly-A tails and are missed by standard mRNA-Seq [4] [17].
- Comprehensive Splicing Analysis: With reads spanning exon-intron boundaries, researchers can analyze alternative splicing events and allele-specific expression [16] [19].
Table 1: Method Selection Based on Research Objectives and Applications
| Research Objective | Recommended Method | Key Applications & Rationale |
|---|---|---|
| Differential Gene Expression (DGE) | 3' mRNA-Seq | Cost-effective, accurate quantification for large numbers of samples; highly reproducible [16] [17]. |
| High-Throughput Screening | 3' mRNA-Seq | Streamlined workflow and lower per-sample sequencing cost enables profiling of thousands of samples [16]. |
| Transcript Isoform Discovery | Total RNA-Seq | Full-length transcript coverage is required to identify alternative splicing, novel isoforms, and fusion genes [16] [18]. |
| Non-Coding RNA Analysis | Total RNA-Seq | Detects all RNA types, including lncRNAs and miRNAs, which are often not polyadenylated [4] [17]. |
| Working with Degraded RNA | 3' mRNA-Seq | More tolerant of RNA degradation common in FFPE samples, as it only requires an intact 3' end [16]. |
Table 2: Technical and Practical Considerations
| Parameter | 3' mRNA-Seq | Total RNA-Seq |
|---|---|---|
| RNA Types Captured | Protein-coding polyadenylated mRNA only [17] | All RNA types (coding and non-coding) after rRNA depletion [4] [17] |
| Typical Sequencing Depth | Low (e.g., 25-50 million reads/sample) [4] | High (e.g., 100-200 million reads/sample) [4] |
| Data Analysis Complexity | Lower (straightforward read counting) [16] | Higher (requires sophisticated alignment and isoform resolution) [16] |
| Project Cost (per sample) | Lower | Higher |
| Annotation Dependence | High (requires well-annotated 3' UTRs) [16] | Lower (can discover novel, unannotated features) [18] |
Experimental Protocols for Robust Data Generation
Protocol for 3’ mRNA-Seq Library Preparation and Analysis
This protocol is optimized for accurate gene expression quantification.
- RNA Extraction & QC: Extract total RNA using a silica-membrane column method. Assess RNA integrity and purity using an Agilent Bioanalyzer or similar system. For FFPE samples, use specialized extraction kits designed for cross-linked RNA [18].
- Poly-A Selection and Library Prep: Use magnetic oligo(dT) beads to selectively enrich for polyadenylated RNA. Reverse transcribe the purified mRNA using an oligo(dT) primer. The resulting cDNA is then fragmented, and sequencing adapters are ligated [16] [17].
- Sequencing: Sequence the libraries on an Illumina platform. A read depth of 25-50 million reads per sample is generally sufficient for most quantitative applications [4].
- Bioinformatic Quantification:
- Alignment: Map sequencing reads to a reference genome using a splice-aware aligner like STAR or HISAT2 [20] [21].
- Quantification: Use a tool like featureCounts or HTSeq to count the number of reads mapping to each gene's annotation [20]. Since each read originates from the 3' end, no length normalization is required, simplifying to a counts-per-gene table [16].
- Differential Expression: Input the raw count matrix into statistical tools like DESeq2 or edgeR to identify significantly differentially expressed genes between conditions [20].
Protocol for Total RNA-Seq Library Preparation and Analysis
This protocol is designed for comprehensive transcriptome characterization.
- RNA Extraction & QC: Follow the same rigorous extraction and QC steps as above. The integrity of the full transcript is more critical for this method.
- rRNA Depletion and Library Prep: Use commercial kits with probes complementary to rRNA species (e.g., RiboZero, RiboFree) to remove ribosomal RNA from the total RNA sample. The remaining RNA, enriched for mRNA and non-coding RNAs, is then reverse-transcribed using random hexamer primers. This ensures coverage across the entire transcript. Strand-specific library construction is highly recommended to determine the originating DNA strand [4] [17].
- Sequencing: Sequence the libraries to a higher depth, typically 100-200 million reads per sample, to ensure sufficient coverage for isoform-level analysis [4].
- Bioinformatic Analysis for Qualitative Discovery:
- Alignment and Assembly: Map reads with an aligner like STAR. Then, use a transcript assembler such as StringTie or Cufflinks to reconstruct transcripts from the aligned reads, which may reveal novel isoforms [20].
- Quantification and DE: Use tools like Cuffdiff or Salmon that can estimate abundance at the transcript level (e.g., in TPM - Transcripts Per Million) and perform differential expression analysis for isoforms [20].
- Splicing and Fusion Analysis: Employ specialized tools to detect alternative splicing events (e.g., rMATS) and gene fusions (e.g., STAR-Fusion, Arriba).
The workflow for RNA-seq data analysis, while varying in specifics between the two methods, follows a common conceptual pathway to transform raw sequencing data into biological insights, as outlined below.
The Scientist's Toolkit: Essential Reagents and Materials
Table 3: Key Research Reagent Solutions for RNA Sequencing
| Item | Function | Example Use-Case |
|---|---|---|
| Oligo(dT) Magnetic Beads | Selectively binds to and purifies polyadenylated RNA from total RNA samples. | Essential for the initial enrichment step in 3' mRNA-Seq library preparation [17]. |
| Ribosomal RNA Depletion Probes | Probes that hybridize to and facilitate the removal of abundant rRNA. | Critical for total RNA-Seq to increase the fraction of informative sequencing reads from non-rRNA species [4] [17]. |
| Strand-Specific Library Prep Kit | Preserves the information about which DNA strand originated the RNA transcript. | Vital for total RNA-Seq to accurately annotate genes and distinguish overlapping transcripts on opposite strands [4]. |
| RNA Integrity Check Kits | Provides a quantitative measure of RNA degradation. | Used in QC for both methods; crucial for determining the suitability of a sample for total RNA-Seq [21] [18]. |
| Universal Human Reference RNA | A standardized control RNA sample from a pool of cell lines. | Serves as a benchmark for normalizing experiments and assessing technical performance across runs [21]. |
The choice between mRNA and total RNA sequencing is not a matter of one method being superior to the other, but of strategic alignment with research objectives. 3' mRNA-Seq is the undisputed champion for quantitative analysis, offering precision, robustness, and efficiency for focused questions in differential gene expression, especially in large-scale or pharmacogenomic studies. Total RNA-Seq is the premier tool for qualitative discovery, providing an unbiased, genome-wide lens to explore the full complexity of the transcriptome, from novel isoforms to the regulatory world of non-coding RNAs. By understanding the intrinsic strengths and data outputs of each method, researchers can make an informed decision that optimally leverages these powerful technologies to advance scientific discovery and drug development.
In the context of a broader thesis on mRNA versus total RNA sequencing for bulk research, understanding which RNA species are captured is fundamental to experimental design. While mRNA sequencing specifically targets protein-coding transcripts through poly-A enrichment, total RNA sequencing provides a more comprehensive view of the transcriptome by capturing both coding and non-coding RNA species. The key RNA molecules researchers can expect to capture include messenger RNA (mRNA), long non-coding RNA (lncRNA), microRNA (miRNA), and various other non-coding RNAs, each with distinct biological functions and methodological considerations for sequencing. The choice between these approaches significantly impacts the scope of biological insights, particularly in disease research and drug development where non-coding RNAs are increasingly recognized as critical regulators [22] [23] [24].
RNA Species: Characteristics and Research Applications
Table 1: Key RNA Species in Sequencing Research
| RNA Type | Size Range | Primary Function | Research Applications |
|---|---|---|---|
| mRNA | Varies (typically 0.5-10+ kb) | Protein coding; translates genetic information into proteins | Gene expression studies, biomarker discovery, therapeutic target identification [22] |
| lncRNA | >200 nucleotides | Epigenetic regulation, transcriptional control, cellular differentiation | Cancer diagnostics, prognostic modeling, therapeutic development [23] [25] |
| miRNA | ~22 nucleotides | Post-transcriptional regulation of gene expression via mRNA degradation or translational repression | Biomarker discovery, therapeutic applications, regulatory network analysis [26] [27] |
| Other ncRNAs | Varies | Diverse regulatory functions including splicing, translation, and epigenetic modifications | Cellular mechanism studies, diagnostic applications [24] |
Market Outlook and Research Emphasis
The research tools and services market for these RNA species reflects their growing importance in biomedical research. The mRNA sequencing market is projected to grow from USD 3,965.8 million in 2025 to USD 8,561.7 million by 2035, at a CAGR of 8.0% [22]. The lncRNA sequencing market, while smaller at approximately $1.5 billion in 2025, is projected to expand at a significantly faster CAGR of 15% from 2025 to 2033, highlighting the increasing research focus on this RNA class [23]. Similarly, the miRNA tools and services market is expected to grow from USD 455.70 million in 2024 to USD 2,432.31 million by 2034, at a remarkable CAGR of 18.23% [27].
Methodological Approaches: Capture, Enrichment, and Sequencing
Experimental Workflows for RNA Species Capture
Table 2: Methodological Comparison for RNA Species Capture in Bulk Sequencing
| Methodology | Target RNA Species | Key Steps | Advantages | Limitations |
|---|---|---|---|---|
| mRNA Sequencing | Protein-coding transcripts | Poly-A selection, library preparation, sequencing (typically Illumina) | High specificity for coding transcripts, well-established protocols | Misses non-polyadenylated RNAs, biased toward 3' end [22] |
| Total RNA Sequencing | Comprehensive transcriptome (including rRNA, lncRNA, other ncRNAs) | rRNA depletion, library preparation, sequencing | Captures coding and non-coding transcripts, more complete transcriptome view | Higher proportion of non-informative reads (e.g., rRNA) [24] |
| Specialized miRNA Sequencing | Small RNAs (~22 nt miRNAs) | Size selection, adapter ligation, library preparation | Optimized for small RNA detection, high sensitivity for miRNAs | Specialized protocols required, may miss larger RNAs [26] |
Figure 1: RNA Capture Methods Workflow - Different enrichment strategies target specific RNA classes from total RNA samples.
Advanced Integrated Approaches
Contemporary research increasingly employs integrated methodologies that combine bulk and single-cell approaches. For instance, studies on bladder cancer and neuroblastoma have demonstrated the power of combining bulk RNA sequencing with single-cell RNA sequencing (scRNA-seq) to identify key prognostic genes and immune microenvironment factors [28] [25]. These integrated approaches allow researchers to contextualize population-level findings with cellular resolution, particularly valuable for understanding tumor heterogeneity and rare cell populations.
Specialized tools have been developed to facilitate these analyses. The inDAGO platform provides a user-friendly interface for dual RNA-seq analysis, enabling simultaneous profiling of protein-coding and non-coding transcripts from two interacting organisms, which is particularly valuable in host-pathogen or cross-kingdom interaction studies [29]. Similarly, the Scan framework incorporates 27 network inference methods to identify sample-specific miRNA regulation from both bulk and single-cell RNA-sequencing data, addressing the critical challenge of biological heterogeneity in regulatory network analysis [30].
Research Reagent Solutions and Essential Tools
Table 3: Essential Research Tools and Reagents for RNA Sequencing Studies
| Tool/Reagent Category | Specific Examples | Function | Application Notes |
|---|---|---|---|
| Sequencing Platforms | Illumina Nova 6000, 10x Genomics Chromium | High-throughput sequencing, single-cell analysis | Sequencing by Synthesis (SBS) dominates mRNA sequencing due to accuracy and scalability [22] |
| Library Prep Kits | CleanTag adapters, Rsubread, Smart-seq | RNA library construction, adapter ligation | CleanTag adapters reduce adapter-dimer formation in miRNA sequencing [26] |
| Bioinformatics Tools | Seurat, inDAGO, Scan, DoubletFinder | Data processing, quality control, differential expression | inDAGO enables dual RNA-seq analysis without programming expertise [29] [30] |
| Specialized Algorithms | Hermes, Cupid, LongHorn, BigHorn | ncRNA target prediction, network analysis | Cupid improves miRNA target prediction accuracy using competition principles [24] |
Signaling Pathways and Regulatory Networks in RNA Biology
Figure 2: RNA Regulatory Networks - Complex interactions between different RNA species create layered gene regulatory systems.
The regulatory relationships between different RNA species create sophisticated networks that maintain cellular homeostasis. miRNAs regulate gene expression by binding to target mRNAs, leading to translational repression or degradation [26] [30]. lncRNAs can function as competing endogenous RNAs (ceRNAs) that "sponge" miRNAs, thereby preventing them from interacting with their mRNA targets [24]. This ceRNA network, as mapped by algorithms like Hermes, represents a regulatory layer as extensive as transcription factor networks, facilitating crosstalk between key driver genes and pathways in cancers [24].
Advanced algorithms have been developed to decipher these complex relationships. The Cupid algorithm enhances miRNA target prediction accuracy by leveraging the principle that competition among targets for shared miRNAs provides stronger evidence for genuine interactions [24]. LongHorn expands target prediction to lncRNAs by integrating four established regulatory mechanisms (guide, co-factor, decoy, and switch) from thousands of patient profiles [24]. These computational tools are essential for moving from simply identifying RNA species to understanding their functional roles in biological systems and disease pathologies.
Application in Disease Research and Therapeutic Development
The capture and analysis of different RNA species has profound implications for disease research and drug development. In cancer biology, integrated analysis of mRNA and non-coding RNA profiles has enabled the development of prognostic models with significant clinical potential. For instance, in neuroblastoma research, cuproptosis-related lncRNAs (CRlncRNAs) have been used to construct risk models that significantly improve patient stratification accuracy [25]. Similarly, in prostate cancer, immune-related lncRNA and mRNA signatures (ILMS) have demonstrated superior ability to predict clinical outcomes and immunotherapeutic response compared to 70 other published signatures [31].
The therapeutic applications of RNA research are expanding rapidly. The success of mRNA vaccines during the COVID-19 pandemic has accelerated investment in mRNA-based therapeutics, with applications expanding to oncology, rare diseases, and infectious diseases [22]. Beyond mRNA, research has identified lncRNAs that modulate the DNA damage response pathway in cancer cells, with promising applications in synthetic lethality approaches for pediatric sarcoma patients [24]. By silencing specific lncRNAs in patients with mutations in DNA damage response proteins, researchers aim to increase tumor sensitivity to radiotherapy while reducing toxicity.
Technical Challenges and Emerging Solutions
Despite significant advances, technical challenges remain in the comprehensive capture and analysis of diverse RNA species. miRNA sequencing faces particular difficulties including adapter-dimer formation, limited input material, and technical biases during reverse transcription and amplification [26]. Single-cell RNA sequencing, while powerful for exploring cellular heterogeneity, contends with high costs, technical complexity, limited data quality, high dropout rates, and fewer genes detected per cell [24].
Emerging methodologies are addressing these limitations. For miRNA sequencing, optimized protocols like Sandberg Protocol II with CleanTag adapters suppress adapter-dimer formation and improve reproducibility [26]. The half-cell genomics approach enables simultaneous co-sequencing of miRNAs and mRNAs from the same single cell by splitting lysate into two fractions, providing direct insight into post-transcriptional regulation [26]. Parallel single-cell small RNA and mRNA co-profiling methods like PSCSR-seq V2 allow high-throughput co-profiling of miRNAs alongside rich mRNA information from thousands of individual cells [26].
The field is also advancing through the integration of artificial intelligence and multi-omics approaches. AI algorithms are being incorporated into miRNA analysis tools to enhance predictive capabilities and provide deeper insights into miRNA functions and interactions [27]. The integration of miRNA data with other omics layers, such as transcriptomics and proteomics, offers a more holistic perspective on molecular interactions and biological networks [27]. These technological innovations are critical for overcoming current limitations and fully realizing the potential of RNA sequencing in both basic research and clinical applications.
From Lab to Insight: Workflow, Applications, and Strategic Selection
The journey of RNA sequencing begins with the isolation of high-quality RNA, a step where methodological choices immediately begin to diverge based on research goals. RNA extraction represents a fundamental point of differentiation in sequencing workflows, as the method employed can significantly influence downstream results. Studies have demonstrated that different RNA isolation techniques can preferentially extract certain RNA species, potentially introducing batch effects in meta-analyses [32]. For instance, classic hot acid phenol extraction has been shown to better solubilize membrane-associated mRNAs compared to commercial column-based kits, which could masquerade as differential expression in downstream analyses [32]. This technical variability underscores the importance of consistent RNA isolation methods, particularly when comparing datasets across different experiments or laboratories.
The quality and integrity of extracted RNA must be rigorously assessed before proceeding to library preparation, with methods and metrics tailored to the sample type. For challenging sample types like formalin-fixed paraffin-embedded (FFPE) tissues, which yield fragmented and chemically modified RNA, quality assessment through metrics such as DV200 (percentage of RNA fragments >200 nucleotides) becomes crucial [33]. For standard fresh-frozen samples, RNA Integrity Number (RIN) provides a reliable quality measure, with values above 8.0 generally recommended for most sequencing applications [32].
Library Preparation Fundamentals: Poly(A) Enrichment Versus Ribosomal RNA Depletion
Following RNA extraction, library preparation constitutes the most substantial point of divergence between mRNA and total RNA sequencing workflows. This critical process determines which RNA species will be captured and sequenced, fundamentally shaping the biological questions that can be addressed.
Poly(A) Enrichment for mRNA Sequencing utilizes oligo(dT) beads or primers to selectively target the polyadenylated tails of messenger RNAs [4] [3]. This approach efficiently captures mature protein-coding transcripts while excluding non-polyadenylated RNA species. The process is highly specific to eukaryotic mRNA due to their poly(A) tails, making it unsuitable for prokaryotic studies where most transcripts lack this feature. A significant advantage of this method is its automatic removal of ribosomal RNA (rRNA), which constitutes 80-90% of total RNA, without requiring additional depletion steps [4]. This efficiency allows for deeper sequencing of coding regions with fewer total reads, typically requiring only 25-50 million reads per sample compared to 100-200 million for total RNA-seq [4].
Ribosomal RNA Depletion for Total RNA Sequencing employs probe-based methods to remove abundant ribosomal RNAs, preserving both coding and non-coding RNA species [4] [18]. This comprehensive approach enables researchers to investigate diverse RNA populations including transfer RNAs (tRNAs), microRNAs (miRNAs), long non-coding RNAs (lncRNAs), and other non-polyadenylated transcripts [4]. The rRNA depletion strategy is particularly valuable for exploring regulatory RNAs, studying prokaryotic transcriptomes, or investigating samples where RNA degradation may have compromised poly(A) tails, such as in archival FFPE specimens [3]. Modern commercial kits for total RNA sequencing, such as the Illumina Stranded Total RNA Prep Ligation with Ribo-Zero Plus and TaKaRa SMARTer Stranded Total RNA-Seq Kit, have been optimized to effectively minimize ribosomal RNA content to less than 1% in fresh samples, though performance may vary with degraded samples [33].
Table 1: Key Differences Between mRNA-seq and Total RNA-seq Library Preparation
| Parameter | mRNA Sequencing | Total RNA Sequencing |
|---|---|---|
| Target RNA Species | Polyadenylated mRNA only | All RNA species except rRNA |
| Enrichment Method | Poly(A) selection using oligo(dT) | Ribosomal RNA depletion |
| Suitable for Prokaryotes | No | Yes |
| Typical Sequencing Depth | 25-50 million reads/sample [4] | 100-200 million reads/sample [4] |
| Captures Non-coding RNAs | Limited | Comprehensive (lncRNAs, miRNAs, etc.) |
| Cost Considerations | Lower per-sample sequencing costs | Higher per-sample sequencing costs |
Experimental Design and Workflow Selection Criteria
Choosing between mRNA and total RNA sequencing requires careful consideration of multiple experimental factors. The decision tree below illustrates the key decision points for selecting the appropriate workflow:
Beyond the primary considerations illustrated above, sample-specific factors further guide method selection. For projects with limited starting material, mRNA-seq often provides better sensitivity, as it focuses sequencing power on a smaller fraction of the transcriptome [4]. When studying archival FFPE samples, 3' mRNA-seq methods that target the region around poly(A) tails can be more robust despite RNA fragmentation, though both approaches can be adapted with specialized kits [33] [3]. The choice of library preparation method also affects the utility of different RNA quality assessment metrics—while RIN values are broadly applicable, DV200 may better predict performance with degraded samples [33].
Comparative Analysis of Methodological Performance
Direct comparisons of library preparation methods reveal important performance differences that impact data quality and experimental outcomes. A comprehensive evaluation of RNA-seq methods compared traditional approaches (TruSeq) with full-length double-stranded cDNA methods (SMARTer and TeloPrime), finding that the traditional method detected approximately twice as many expressed genes and splicing events as TeloPrime, with stronger correlation between TruSeq and SMARTer [34]. This demonstrates how the fundamental chemistry of library preparation influences gene detection sensitivity.
For FFPE samples, recent comparisons show that specialized kits can maintain performance with significantly reduced input requirements. The TaKaRa SMARTer Stranded Total RNA-Seq Kit v2 achieved comparable gene expression quantification to the Illumina Stranded Total RNA Prep Ligation with Ribo-Zero Plus despite requiring 20-fold less RNA input, a crucial advantage for limited clinical samples [33]. Both kits generated data with high concordance in differential expression analysis (83.6-91.7% overlap) and pathway enrichment results, though with differences in ribosomal RNA content and intronic mapping rates [33].
Table 2: Performance Comparison of RNA-seq Library Preparation Methods
| Performance Metric | Traditional mRNA-seq (TruSeq) | Full-length cDNA Methods (SMARTer) | 3' mRNA-seq (QuantSeq) |
|---|---|---|---|
| Gene Detection Sensitivity | High [34] | Moderate [34] | Moderate for 3' ends [3] |
| Coverage Uniformity | Uniform across transcript [34] | More uniform coverage [34] | Focused on 3' end [3] |
| Expression Quantification Accuracy | High correlation with standards [34] | Good correlation with TruSeq [34] | Good for gene-level [3] |
| Alternative Splicing Detection | Highest detection rate [34] | Moderate detection rate [34] | Limited by 3' bias [3] |
| Recommended Applications | Comprehensive transcriptome analysis, splicing studies [34] | Full-length transcript characterization | High-throughput expression profiling, degraded samples [3] |
The choice between methods also significantly impacts cost structure and experimental efficiency. While total RNA-seq provides more comprehensive transcriptome coverage, it requires deeper sequencing (typically 100-200 million reads per sample) to adequately capture diverse RNA species, increasing per-sample costs [4]. In contrast, mRNA-seq focusing on polyadenylated transcripts typically requires only 25-50 million reads per sample, making it more cost-effective for large-scale gene expression studies [4]. This efficiency enables researchers to process more samples within the same budget, increasing statistical power for differential expression analysis.
The Scientist's Toolkit: Essential Reagents and Methods
Successful implementation of RNA sequencing workflows requires careful selection of laboratory methods and reagents. The following table summarizes key solutions used in the featured experiments and their applications:
Table 3: Research Reagent Solutions for RNA Sequencing Workflows
| Reagent/Kit | Primary Function | Application Context | Key Features |
|---|---|---|---|
| Illumina Stranded Total RNA Prep with Ribo-Zero Plus [33] | rRNA depletion for total RNA-seq | FFPE and fresh frozen samples | Effective rRNA removal (<1% rRNA), preserves strand information |
| TaKaRa SMARTer Stranded Total RNA-Seq Kit v2 [33] | rRNA depletion for total RNA-seq | Low-input samples (20-fold less input) | Low RNA input requirement, maintains expression accuracy |
| 10x Genomics Chromium Single Cell Platform [35] | Single-cell partitioning and barcoding | Single-cell RNA sequencing | High-throughput cell barcoding, microfluidic partitioning |
| Lexogen QuantSeq 3' mRNA-Seq [3] | 3' end mRNA sequencing | High-throughput expression profiling | Low sequencing depth requirements, cost-effective |
| TruSeq Stranded mRNA Library Prep Kit [34] | Poly(A) enrichment for mRNA sequencing | Comprehensive transcriptome analysis | High gene detection sensitivity, optimal for splicing analysis |
| Hot Acid Phenol RNA Extraction [32] | Total RNA isolation | Yeast and microbial samples | Enhanced recovery of membrane-associated transcripts |
The optimal RNA sequencing workflow depends on a balanced consideration of research objectives, sample characteristics, and practical constraints. For research focused exclusively on protein-coding gene expression with limited samples or budget, mRNA sequencing with poly(A) enrichment provides a cost-effective solution with streamlined data analysis [4] [3]. When comprehensive transcriptome characterization is required—including non-coding RNAs, prokaryotic samples, or instances where poly(A) tails may be compromised—total RNA sequencing with ribosomal depletion offers the necessary breadth despite higher sequencing costs [4] [18].
Emerging methodologies continue to expand experimental possibilities. Single-cell RNA sequencing technologies, such as the 10x Genomics platform, now enable researchers to profile transcriptional heterogeneity at unprecedented resolution, complementing bulk approaches that provide population-level insights [35] [5] [10]. For specialized applications involving degraded samples like FFPE tissues, targeted methods such as 3' mRNA-seq offer robust alternatives to standard protocols [33] [3]. By carefully matching methodological approaches to biological questions, researchers can design RNA sequencing workflows that maximize insights while optimizing resource utilization.
The foundational choice between messenger RNA sequencing (mRNA-Seq) and total RNA sequencing (total RNA-Seq) is a critical determinant of success in transcriptomic studies. Within the context of bulk RNA sequencing research, this decision dictates the scope, depth, and biological applicability of the findings. mRNA-Seq, which focuses on polyadenylated (poly(A)) transcripts, provides a cost-effective method for profiling protein-coding genes [4]. In contrast, total RNA-Seq offers a comprehensive landscape of the transcriptome by capturing both coding and non-coding RNA species, albeit at a higher cost and with greater computational demands [4] [3]. This technical guide provides an in-depth comparison of these methodologies, framing them against specific research applications: gene expression quantification, isoform detection, and novel transcript discovery. We synthesize current protocols, data analysis tools, and experimental design considerations to empower researchers and drug development professionals in selecting the optimal strategy for their investigative goals.
Core Technology Comparison: mRNA-Seq vs. Total RNA-Seq
The fundamental difference between these two bulk RNA-Seq approaches lies in the initial steps of library preparation, which dictate the subset of RNA molecules that will be sequenced.
mRNA-Seq utilizes poly(A) enrichment to selectively capture RNA molecules with poly(A) tails. This primarily targets messenger RNAs (mRNAs) but will also capture other polyadenylated non-coding RNAs. This method effectively excludes ribosomal RNA (rRNA), which constitutes 80-90% of total RNA, without the need for a specific depletion step [4]. This makes it highly efficient for focusing on the protein-coding transcriptome.
Total RNA-Seq (also referred to as Whole Transcriptome Sequencing) employs rRNA depletion to remove the abundant ribosomal RNA components. This retains not only mRNAs but also a vast array of non-coding RNAs (ncRNAs) that lack poly(A) tails, such as long non-coding RNAs (lncRNAs), microRNAs (miRNAs), and transfer RNAs (tRNAs) [4] [3].
Table 1: Decision Framework for Selecting Between mRNA-Seq and Total RNA-Seq
| Application Factor | Choose mRNA-Seq when... | Choose Total RNA-Seq when... |
|---|---|---|
| Primary Research Goal | Quantifying gene expression of protein-coding genes [4] [3] | Discovering novel non-coding RNAs, fusion genes, or performing global transcriptome analysis [4] [3] |
| Transcript Type of Interest | Focus is exclusively on poly(A)+ transcripts (mRNAs) [4] | Interest includes non-polyadenylated RNAs (e.g., many lncRNAs, pre-mRNAs) [4] [3] |
| Sample Input Material | Starting material is limited (requires less input) [4] | Sufficient starting material is available [4] |
| Project Budget | Budget is constrained; requires lower sequencing depth (25-50 million reads/sample) [4] | Budget allows for higher sequencing depth (100-200 million reads/sample) [4] |
| Sample Quality | Working with degraded samples (e.g., FFPE) where 3' ends are preserved [3] | RNA is intact, allowing for full-transcript coverage [4] |
The following workflow diagram illustrates the key procedural divergences between these two primary approaches to bulk RNA sequencing:
Application 1: Gene Expression Quantification
For the precise quantification of gene expression levels, particularly in large-scale studies, mRNA-Seq is often the preferred and most cost-effective method [4] [3]. Its efficiency stems from concentrating sequencing reads on the biologically informative protein-coding transcriptome, which represents only 3-7% of the mammalian transcriptome [4]. This allows for robust differential gene expression analysis with a lower sequencing depth (typically 25-50 million reads per sample) compared to total RNA-Seq [4].
A specialized and highly efficient variant for gene expression counting is 3' mRNA-Seq (e.g., QuantSeq). This method generates libraries by priming directly from the 3' end of poly(A) RNAs, localizing all reads to the 3' untranslated region (UTR) [3]. This provides a single fragment per transcript, simplifying data analysis to straightforward read counting without the need for complex normalization for transcript length and concentration. It is ideal for high-throughput screening of many samples and is robust for degraded material like FFPE samples [3].
Table 2: Gene Expression Quantification Method Profiles
| Method | Key Principle | Typical Reads/Sample | Advantages | Limitations |
|---|---|---|---|---|
| Standard mRNA-Seq | Poly(A) enrichment captures full-length transcripts [4] | 25-50 million [4] | Provides full-transcript information; standard for DE analysis [4] | Less efficient than 3' mRNA-Seq for pure counting [3] |
| 3' mRNA-Seq | Oligo(dT) priming at 3' UTR; one fragment per transcript [3] | 1-5 million [3] | Cost-effective; high-throughput; simple analysis; works on degraded RNA [3] | Lacks information on alternative splicing or 5' ends [3] |
| Total RNA-Seq | rRNA depletion preserves all RNA classes [4] | 100-200 million [4] | Can correlate mRNA with non-coding RNA expression [4] | Higher cost; reads "wasted" on rRNAs if not fully depleted [4] |
Studies comparing 3' mRNA-Seq to whole transcriptome methods have found that while the latter detects a higher absolute number of differentially expressed genes (DEGs), the biological conclusions at the level of pathway and gene set enrichment are highly concordant. For instance, in a study of murine livers under a high-iron diet, the top upregulated gene sets (e.g., "Response of EIF2AK1 to Heme Deficiency") were consistently ranked as the most significant by both methods, confirming that 3' mRNA-Seq reliably captures key biological signals [3].
Application 2: Isoform Detection and Alternative Splicing
For the analysis of alternative splicing and transcript isoform diversity, Total RNA-Seq with long-read sequencing technologies is superior. Short-read sequencing, while accurate, struggles to unambiguously assign exons to the same transcript due to a lack of long-range connectivity information [36] [37]. Long-read sequencing (LRS) technologies, such as those from Oxford Nanopore Technologies (ONT) and Pacific Biosciences (PacBio), sequence entire RNA molecules in a single read, enabling direct and precise observation of full-length transcript isoforms [36] [37].
The power of this approach is exemplified in neuropsychiatric research. A 2025 study profiling 31 risk genes in the human brain using nanopore amplicon sequencing identified 363 novel RNA isoforms and 28 novel exons. In genes like ATG13 and GATAD2A, the majority of expression was derived from previously undiscovered isoforms, dramatically altering the understanding of their genomic structure and potential protein products [37].
Experimental Protocol: Long-Read Isoform Discovery
A detailed methodology for long-read isoform discovery, as applied to human brain samples, involves the following steps [36] [37]:
- Sample Acquisition and RNA Extraction: Obtain high-quality tissue samples (e.g., from biobanks like GTEx). For brain studies, regions of interest may include the cerebellar hemisphere, frontal cortex, and putamen. Extract total RNA using a dedicated kit (e.g., Qiagen PAXgene Tissue miRNA kit) [36].
- Library Preparation for Long-Read Sequencing: Reverse-transcribe the isolated total RNA into cDNA. For comprehensive coverage, use a cDNA-PCR protocol. This is compatible with platforms like ONT MinION and GridION.
- Targeted Amplicon Sequencing (for deep gene profiling): Design primers to cover the full coding region of target genes, from the first to the last exon. For genes with complex alternative starts/ends, use multiple primer sets.
- Two-Pass Read Alignment: Align base-called reads to the reference genome (e.g., GRCh38) using a specialized aligner like Minimap2. A two-pass approach is recommended:
- First Pass: Perform initial alignment and extract splice junctions.
- Junction Filtering: Score junctions using a tool like 2passtools and filter low-confidence junctions based on metrics from a machine learning model.
- Second Pass: Re-align reads using the filtered junction list to guide alignment, significantly improving accuracy [36].
- Transcriptome Assembly and Quantification: Process the aligned reads through a specialized isoform discovery tool. The following diagram illustrates the bioinformatic pipeline for this critical step.
Key tools for this assembly step include Bambu [36] and IsoLamp, a newer pipeline optimized for amplicon sequencing which has demonstrated high precision and recall in benchmarking studies [37].
Application 3: Novel Transcript Discovery
The discovery of entirely unannotated transcripts—including novel protein-coding genes and long non-coding RNAs (lncRNAs)—demands the most comprehensive approach: Total RNA-Seq combined with long-read sequencing and sophisticated bioinformatic pipelines [36]. This strategy is crucial because novel transcripts, by definition, are absent from standard poly(A) enrichment-based annotations, and their full-length structure cannot be resolved by short reads.
A landmark 2025 study utilized this approach on human brain tissues, employing three separate bioinformatic tools to analyze long-read data from eight cerebellar hemisphere, five frontal cortex, and six putamen replicates [36]. By taking the consensus across tools, the study curated a high-confidence set of 170 novel RNA isoforms, consisting of 104 novel mRNAs and 66 novel lncRNAs. A notable finding was the tissue-specific expression of a novel lncRNA, BambuTx1299, which was predominantly expressed in the cerebellar hemisphere (mean CPM of 5.979) [36]. This highlights how total RNA-Seq can uncover novel regulatory elements with potential tissue-specific functions.
The Scientist's Toolkit: Essential Reagents and Materials
Table 3: Research Reagent Solutions for Advanced RNA Sequencing
| Item / Reagent | Function / Application | Specific Example / Note |
|---|---|---|
| PAXgene Tissue Kit | Stabilizes RNA in tissue samples immediately upon collection, preserving the in vivo transcriptome profile for later analysis [36]. | PreAnalytiX [36] |
| Total RNA Extraction Kit | Isolates the complete RNA population, including coding, non-coding, and ribosomal RNA, for total RNA-Seq. | Qiagen PAXgene Tissue miRNA kit [36] |
| rRNA Depletion Probes | Selectively removes abundant ribosomal RNA from a total RNA sample, enriching for informative transcripts prior to library prep. | Used in total RNA-Seq workflows [4] [3] |
| Oligo(dT) Beads | Enriches for polyadenylated RNA molecules by binding to their poly(A) tails; core of mRNA-Seq protocols. | Used in mRNA-Seq and 3' mRNA-Seq workflows [4] [3] |
| cDNA-PCR Kit (ONT) | Prepares sequencing-ready libraries from RNA for Oxford Nanopore long-read sequencers. | Used in the protocol by Glinos et al. (2022) [36] |
| SIRV Spike-in RNA | Provides a known set of isoform sequences at defined ratios; used as a quantitative control to benchmark the accuracy of isoform discovery and quantification tools [37]. | Lexogen Spike-in RNA variants (SIRVs) [37] |
Integrated Data Analysis Workflow
A robust bioinformatic analysis is essential for interpreting RNA-Seq data, regardless of the initial library preparation method. The following workflow outlines a standard pipeline for processing raw sequencing data into biologically interpretable results, integrating tools and steps from the cited research [38].
Key Software Tools:
- Terminal-based Processing: FastQC for quality control; Trimmomatic for adapter trimming; HISAT2 or STAR for alignment; featureCounts for gene-level quantification [38].
- R/Bioconductor for Analysis: DESeq2 for differential expression analysis; pheatmap and ggplot2 for generating publication-quality visualizations like heatmaps and volcano plots [38].
- Specialized Isoform Tools: Bambu [36] and IsoLamp [37] for long-read data to discover and quantify known and novel isoforms.
The choice between mRNA-Seq and total RNA-Seq in bulk sequencing research is not a matter of one being universally superior to the other, but rather a strategic decision based on the primary biological question. As detailed in this guide, mRNA-Seq remains the most efficient and cost-effective tool for focused gene expression quantification, especially in large-scale studies. In contrast, Total RNA-Seq is indispensable for exploratory research aimed at discovering novel transcripts, non-coding RNAs, and comprehensively characterizing transcriptome complexity. The advent of accurate long-read sequencing has further amplified the power of total RNA-Seq, revealing a previously hidden layer of transcriptomic diversity, as evidenced by the discovery of hundreds of novel isoforms in the human brain [36] [37]. By aligning experimental goals with the strengths of each method—and leveraging the appropriate bioinformatic tools—researchers can design robust transcriptomic studies that effectively advance our understanding of biology and disease.
The reliability of bulk RNA sequencing data is fundamentally influenced by two critical pre-analytical factors: the biological sample type and the quantity of input RNA available. The choice between messenger RNA (mRNA) and total RNA sequencing strategies must be guided by the specific characteristics of the sample material, which can range from pristine frozen tissues to highly degraded archival specimens. Formalin-fixed paraffin-embedded (FFPE) tissues and whole blood present unique challenges that necessitate specialized protocols and rigorous quality control. Furthermore, translational research often deals with limited material, requiring robust low-input methods. This guide provides a comprehensive technical framework for selecting and optimizing RNA sequencing approaches based on sample type and input requirements, enabling researchers to generate high-quality transcriptomic data within the context of bulk sequencing research.
Sample Type-Specific Considerations and Protocols
The success of an RNA-seq experiment is largely determined at the sample collection and preparation stages. The following sections detail the specific considerations, challenges, and optimized protocols for the most common sample types encountered in research and clinical settings.
FFPE Samples
Challenges and Characteristics: FFPE tissues are invaluable for retrospective clinical studies due to their wide availability and long-term storage potential. However, the formalin fixation process induces RNA fragmentation, cross-linking, and chemical modifications, resulting in degraded RNA that is suboptimal for sequencing [33] [39]. Despite these challenges, optimized protocols can successfully generate high-quality data from FFPE material.
Optimized Experimental Protocols:
- Pathologist-assisted Macrodissection: For heterogeneous tissues, precise macrodissection is critical. Implement a workflow that prioritizes high tumor content regions for DNA extraction and infiltrated tumor microenvironment regions for transcriptomic analysis [33]. This may require two distinct FFPE blocks from the same surgical specimen.
- RNA Quality Assessment: Use the DV200 value (percentage of RNA fragments >200 nucleotides) for quality control. While samples with DV200 <30% are generally considered too degraded, samples with DV200 values ranging from 37% to 70% can yield usable data with appropriate protocols [33].
- Library Preparation Protocol Selection: For FFPE-derived RNA, ribosomal RNA (rRNA) depletion protocols are strongly preferred over poly(A) selection, as the fragmented RNA may not contain intact poly(A) tails [39]. Two robust kit options are:
- Illumina Stranded Total RNA Prep Ligation with Ribo-Zero Plus: Demonstrates excellent alignment performance (higher percentage of uniquely mapped reads), effective rRNA depletion (0.1% rRNA content), and lower duplication rates (10.73%) [33].
- TaKaRa SMARTer Stranded Total RNA-Seq Kit v2: Achieves comparable gene expression quantification with 20-fold less RNA input, a crucial advantage for limited samples, though with higher rRNA content (17.45%) and increased duplication rates (28.48%) [33].
Table 1: Performance Comparison of FFPE-Compatible Library Prep Kits
| Performance Metric | Illumina Stranded Total RNA Prep | TaKaRa SMARTer Stranded Total RNA-Seq v2 |
|---|---|---|
| Minimum Input RNA | Standard (~100ng) | 20-fold lower than Illumina |
| rRNA Depletion Efficiency | 99.9% (0.1% rRNA content) | 82.55% (17.45% rRNA content) |
| Duplicate Rate | 10.73% | 28.48% |
| Uniquely Mapped Reads | Higher percentage | Lower percentage |
| Intronic Mapping | 61.65% | 35.18% |
| Gene Detection | Comparable | Comparable |
| Cost & Time | Standard | Increased sequencing depth required |
Quality Control Recommendations: Implement a decision-tree model based on pre-sequencing metrics. Recommended minimum thresholds include RNA concentration ≥25 ng/μL and pre-capture library output ≥1.7 ng/μL to achieve adequate sequencing data. Post-sequencing, samples should demonstrate median sample-wise correlation ≥0.75, ≥25 million reads mapped to gene regions, and detection of ≥11,400 genes with TPM >4 [39].
Blood Samples
Challenges and Characteristics: Whole blood is an easily accessible but challenging sample type due to high ribonuclease (RNase) activity that can rapidly degrade RNA, and the presence of abundant globin mRNAs and ribosomal RNAs that can consume a significant portion of sequencing reads if not properly managed [40].
Optimized Experimental Protocols:
- RNA Stabilization at Collection: Immediately upon collection, use specialized blood collection tubes containing RNA-stabilizing reagents such as PAXgene or Tempus tubes. These tubes inactivate RNases, yielding gene expression data that accurately reflects the blood's state at sampling. Consistency in tube type per experimental setting is critical, as different systems can yield substantial differences in gene expression profiles [40].
- Globin mRNA Depletion: Globin mRNA can account for 30-80% of all mRNAs in blood samples, significantly reducing gene detection rates. Implement globin depletion protocols (e.g., Lexogen's Globin Block module) to dramatically increase detectable genes. Studies show this pre-treatment can increase gene detection by approximately 30% at 1 million reads [40].
- rRNA Depletion: For whole transcriptome approaches, combine globin depletion with rRNA removal (e.g., using RiboCop HMR+Globin) to free up additional sequencing space and focus reads on informative transcripts [40].
- Storage Condition Optimization: Process samples promptly after collection. If delay is unavoidable, store PBMCs on ice rather than at room temperature. Incubating samples on ice for 48 hours results in transcriptome changes approximately equivalent to only 4 hours at room temperature [41].
Temporal Considerations: Blood sample processing time significantly impacts transcriptomic profiles. Research indicates that the number of differentially expressed genes increases with extended storage time at room temperature, with five protein-coding genes showing consistent gradient patterns over different storage durations [41].
Tissue Samples
Challenges and Characteristics: Tissue samples encompass a wide spectrum of preservation methods, from fresh frozen to various fixed states. The key challenge lies in maintaining RNA integrity throughout collection, storage, and processing, while also considering tissue-specific composition and heterogeneity.
Optimized Experimental Protocols:
- Whole-Organ Profiling in Mouse Models: For system-level studies, implement the PME-seq (3-prime mRNA extension sequencing) toolkit. This integrated approach enables organism-wide transcriptomic analysis across most mouse organs with optimized procedures for collection, cleaning, and storage in RNA-preserving solutions. The protocol includes:
- Transcardial Perfusion: Perform immediately before tissue collection to remove most blood cells from vasculature, reducing contamination [42].
- Tissue-Specific Lysis Optimization: Optimize lysis conditions for each organ type based on size and composition. Use bead-beating instruments (e.g., PowerLyzer 24 Homogenizer) for small to medium organs, and tissue dissociators (e.g., gentleMACS Octo Dissociator) for larger or fatty organs [42].
- High-Throughput RNA Extraction: Utilize magnetic beads coated with silica-like chemistry with on-bead DNase I treatment to degrade remaining genomic DNA. This custom procedure processes up to 96 samples in parallel either manually or using liquid handlers for increased reproducibility [42].
- Multiplexed RNA-seq Library Preparation: Employ a ligation-free protocol that enables early multiplexing of hundreds of samples before library construction. This method works with low total RNA input (1-100 ng), does not require direct capture of polyadenylated transcripts or rRNA depletion prior to reverse transcription, and relies on three simple steps: reverse transcription, 3'-end DNA polymerization using the Klenow fragment, and PCR enrichment [42].
Low-Input RNA Sequencing Protocols
Limited starting material is a common challenge in clinical and research settings, particularly with precious samples such as small biopsies, microdissected tissues, or rare cell populations.
Technical Considerations for Low-Input Protocols
Low-input RNA sequencing requires specialized approaches to maintain library complexity and data quality with minimal starting material. Key considerations include:
- Template Switching Mechanisms: Technologies such as the SMARTer (Switching Mechanism at 5' End of RNA Template) approach employ template-switching reverse transcriptase to generate full-length cDNA, effectively capturing transcript information from minimal input [43].
- Unique Molecular Identifiers (UMIs): Incorporate UMIs during reverse transcription to correct for PCR amplification biases and enable accurate quantification of original transcript molecules, crucial for low-input applications where amplification cycles are increased [44].
- rRNA Depletion vs. Poly(A) Selection: For degraded or low-quality samples, rRNA depletion methods are generally more effective than poly(A) selection, as they do not rely on intact 3' ends of transcripts [39] [4].
Protocol Selection Guide
Table 2: Low-Input RNA Sequencing Protocol Options
| Protocol/Kits | Recommended Input | Key Technology | Strengths | Best Applications |
|---|---|---|---|---|
| SMARTer Stranded Total RNA-Seq Kit v2 - Pico Input | <10 ng | Template switching | Strand-specific; sensitive rRNA removal | Limited clinical samples; small biopsies |
| Illumina Single Cell 3' RNA Prep | Single-cell to ultra-low input | Template switching with bead-based partitioning | Robust transcriptome analysis down to single-cell level | High-quality samples with extreme input limitations |
| QuantSeq FFPRE (3' mRNA-Seq) | Low input (FFPE-optimized) | Oligo(dT) priming with UMIs | Focused on 3' ends; cost-effective; works with degraded RNA | FFPE samples; differential expression studies |
| CORALL FFPE (Whole Transcriptome) | Low input (FFPE-optimized) | Displacement stop technology with UMIs | Uniform coverage; fusion & isoform detection | FFPE samples requiring isoform-level analysis |
Integrating mRNA-seq and Total RNA-seq Within Experimental Constraints
The decision between mRNA sequencing and total RNA sequencing must align with both experimental objectives and sample-specific constraints.
Method Selection Framework
Choose mRNA Sequencing (3' mRNA-Seq) when:
- The research question focuses exclusively on differential expression of protein-coding genes [4] [44].
- Working with severely degraded RNA (e.g., FFPE samples), as 3' mRNA-Seq targets the most likely preserved region of transcripts [44].
- Budget, data storage, or sequencing depth are limiting factors, as 3' mRNA-Seq requires fewer reads (typically 25-50 million per sample) and lower costs [4].
- Sample input is limited, as mRNA-Seq provides better sequencing data with less starting material [4].
Choose Whole Transcriptome Sequencing when:
- The study aims to detect non-coding RNAs (lncRNAs, miRNAs) or non-polyadenylated transcripts [4] [44].
- Analysis of alternative splicing, fusion genes, isoform usage, or nucleotide variations is required [44].
- Sample quality is high (e.g., fresh frozen tissues) with sufficient input material [4].
- Budget allows for deeper sequencing (typically 100-200 million reads per sample) [4].
Concordance Between Methods
For FFPE samples, both methods show strong correlation in gene expression profiling. Independent studies demonstrate a high degree of overlap in gene detection between 3' mRNA-Seq and whole transcriptome sequencing (R² = 0.89 in kidney tumor FFPE samples), with both methods identifying similar differentially expressed genes and enriched pathways [33] [44].
The Scientist's Toolkit: Essential Research Reagents
Table 3: Key Reagent Solutions for RNA Sequencing from Challenging Samples
| Reagent/Tool | Function | Sample Applications |
|---|---|---|
| PAXgene Blood RNA Tubes | Inactivates RNases immediately upon blood collection | Whole blood transcriptomics; multi-center studies |
| RiboCop rRNA Depletion Kit | Efficiently removes ribosomal RNA without enzymatic steps | Whole transcriptome sequencing; bacterial/archaeal RNA |
| Globin Block (Homo sapiens module) | Depletes globin mRNAs during library prep | Whole blood RNA-seq; improves gene detection rates |
| SMARTer Stranded Total RNA-Seq Kit v2 | Template-switching technology for low-input applications | Limited clinical samples; small biopsies (<10 ng input) |
| SPLIT One-step FFPE RNA Extraction Kit | Optimized RNA extraction from FFPE material | Archival tissues; retrospective studies |
| TruSeq RNA Exome Panel | Target enrichment for degraded RNA | FFPE samples; focused transcriptional profiling |
| NEBNext rRNA Depletion Kit | Removes cytoplasmic and mitochondrial rRNA | Total RNA-seq; maintains non-coding RNA information |
Workflow Diagrams
Sample Processing Workflow
Library Prep Comparison
In the realm of transcriptomics, bulk RNA sequencing (RNA-Seq) remains a cornerstone technology for profiling gene expression across entire tissue samples or cell populations. Within this domain, researchers face a fundamental choice between two principal approaches: messenger RNA (mRNA) sequencing and total RNA sequencing. This technical guide provides a comprehensive cost-benefit analysis framework to inform experimental design decisions, balancing sequencing depth, project budget, and informational return on investment (ROI). The decision between these methods carries significant implications for data generated, analytical possibilities, and overall project costs—necessitating a strategic approach aligned with specific research objectives.
Bulk RNA-Seq, whether targeting mRNA or total RNA, delivers a population-level snapshot of the transcriptome, making it ideal for detecting global gene expression differences between healthy and diseased samples, assessing transcriptomic changes following drug treatments, and identifying overall mutational loads [10]. However, the selection of an appropriate methodology requires careful consideration of biological questions, technical constraints, and financial limitations to optimize resource allocation and maximize scientific output.
mRNA Sequencing vs. Total RNA Sequencing: A Technical Comparison
The choice between mRNA-Seq and total RNA-Seq begins with understanding their fundamental technical differences and the distinct biological information they capture.
mRNA Sequencing (mRNA-Seq)
mRNA-Seq specifically targets protein-coding transcripts through poly(A) enrichment. This process utilizes oligo(dT) beads to selectively capture RNA molecules containing poly(A) tails, which are characteristic of most eukaryotic mRNAs [4]. This enrichment effectively isolates mRNA from the broader RNA pool, making it the preferred method when research questions focus exclusively on protein-coding genes.
Key Applications:
- Differential gene expression analysis of coding transcripts
- Studying expression quantitative trait loci (eQTLs)
- Analysis of polyadenylated transcript isoforms
- Large-scale gene expression profiling studies
Total RNA Sequencing (Total RNA-Seq)
Total RNA-Seq takes a comprehensive approach by sequencing all RNA species present in a sample after the removal of ribosomal RNA (rRNA) [4]. Since rRNA typically constitutes 80-90% of total RNA, its depletion is crucial for enriching other RNA types and maximizing sequencing sensitivity toward informative transcripts [4].
Key Applications:
- Discovery and analysis of non-coding RNAs (lncRNAs, miRNAs, etc.)
- Studies of organisms lacking poly(A) tails or with poorly annotated transcriptomes
- Analysis of pre-mRNA processing and splicing variants
- Comprehensive transcriptome annotation and characterization
Table 1: Technical Comparison of mRNA-Seq and Total RNA-Seq
| Parameter | mRNA Sequencing | Total RNA Sequencing |
|---|---|---|
| Target RNA Species | Protein-coding polyadenylated mRNAs | All RNA species (coding and non-coding) |
| Enrichment Method | Poly(A) selection | Ribosomal RNA depletion |
| Ideal For | Focused studies on protein-coding genes | Comprehensive transcriptome analysis |
| Required Sequencing Depth | 25-50 million reads per sample [4] | 100-200 million reads per sample [4] |
| Sample Input Requirements | Lower input requirements, suitable for limited material [4] | Generally requires more starting material |
| Cost Consideration | More cost-effective for targeted questions [4] | Higher overall cost due to broader coverage needs [4] |
Quantitative Cost Analysis: Breaking Down the Expenses
Understanding the cost structure of RNA-Seq experiments is essential for effective budget planning and resource allocation. Recent analyses indicate that only 20-30% of total project costs are attributed to the sequencing process itself, while 70-80% are consumed by sample preparation steps including RNA extraction, enrichment, and library preparation [45].
Comprehensive Cost Breakdown
Table 2: Detailed Cost Components in RNA-Seq Experiments
| Cost Component | Cost Range (% of total) | Details & Considerations |
|---|---|---|
| RNA Extraction | 10-20% [45] | QIAgen RNeasy Kit: ~$7.1/sample; TRIzol: ~$2.2/sample [46] |
| rRNA Depletion | 20-30% (Total RNA-Seq only) [45] | Not required for mRNA-Seq with poly(A) selection |
| Library Preparation | 30-60% [45] | Illumina TruSeq: ~$64.4/sample; NEBnext Ultra II: ~$37/sample; BRB-seq: ~$19.7/sample [46] |
| Sequencing | 20-40% [45] | Varies significantly with depth and multiplexing level: $4.6-$96/sample [46] |
| Data Analysis | ~$2/sample (plus storage) [46] | Cloud-based pipelines; varies with complexity |
Cost Optimization Strategies
Multiplexing Efficiency: Multiplexing strategies dramatically reduce per-sample sequencing costs. For example, using a NovaSeq 6000 S4 flow cell at full capacity:
- Traditional mRNA-Seq (25M reads/sample): ~400 samples, $36.9/sample [46]
- 3' mRNA-Seq methods (5M reads/sample): ~3,200 samples, $4.6/sample [46]
Innovative Protocols: Recent methodological advances offer substantial cost savings:
- BRB-seq and BOLT-seq reduce library preparation costs to ~$20-24/sample through early barcoding and pooling strategies [46] [47].
- BOLT-seq further reduces costs by enabling library construction directly from cell lysates without RNA purification, achieving per-sample costs below $1.40 (excluding sequencing) [47].
Sequencing Depth and Experimental Design: Maximizing Informational ROI
Sequencing depth directly influences data quality and statistical power, but must be balanced against budget constraints. The optimal depth depends primarily on research objectives and transcriptome complexity.
Recommended Sequencing Depth by Application
Table 3: Sequencing Depth Guidelines for Different Research Goals
| Research Objective | Recommended Depth | Rationale |
|---|---|---|
| Differential Gene Expression | 5-50 million reads [48] | 5M reads bare minimum; 15-50M provides better power for low-expression genes [48] |
| Alternative Splicing Analysis | 50-100 million reads [4] | Higher depth needed to resolve isoform-specific reads |
| Total RNA Analysis | 100-200 million reads [4] | Comprehensive coverage of diverse RNA species requires greater depth |
| Transcriptome Assembly | >50 million reads | Higher depth facilitates complete transcript reconstruction |
| 3' mRNA-Seq (QuantSeq, BRB-seq) | 5 million reads [46] | Targeted approach requires significantly less depth |
The Replication vs. Depth Trade-off
For fixed budgets, allocating resources to biological replication typically provides better statistical power than increasing sequencing depth [49] [48]. Studies demonstrate that increasing biological replicates from 2 to 6, even at moderate sequencing depth (10M reads), yields greater power for differential expression detection than increasing reads from 10M to 30M with only 2 replicates [48].
Pooling Strategies: RNA sample pooling presents a viable cost-saving alternative when individual sample input is limited or when biological variability is high. With proper experimental design, pooling strategies can reduce costs by approximately 50% without substantial loss of data quality [45] [50]. The effectiveness of pooling increases when biological variability substantially exceeds technical variability [50].
Experimental Design and Workflow Considerations
Method Selection Workflow
The following diagram illustrates the decision process for selecting between mRNA-Seq and total RNA-Seq approaches:
Workflow Title: RNA-Seq Method Selection
Library Preparation Workflow Comparison
The library preparation process differs significantly between conventional and innovative methods:
Workflow Title: Library Preparation Methods Comparison
The Scientist's Toolkit: Essential Research Reagents and Materials
Table 4: Key Reagents and Solutions for RNA-Seq Experiments
| Reagent/Solution | Function | Examples & Considerations |
|---|---|---|
| RNA Extraction Kits | Isolation of high-quality RNA from samples | QIAgen RNeasy kits ($7.1/sample), TRIzol ($2.2/sample) [46] |
| Poly(A) Selection Beads | Enrichment of polyadenylated RNAs | Oligo(dT) magnetic beads; specific to mRNA-Seq |
| rRNA Depletion Kits | Removal of ribosomal RNA | Various probe-based systems; essential for total RNA-Seq |
| Library Prep Kits | Preparation of sequencing libraries | Illumina TruSeq ($64.4/sample), NEBnext Ultra II ($37/sample) [46] |
| Reverse Transcriptase | cDNA synthesis from RNA template | M-MuLV RT; critical for all RNA-Seq protocols [47] |
| Tn5 Transposase | Tagmentation for library preparation | In-house purification can dramatically reduce costs [47] |
| Barcoded Adapters | Sample multiplexing | Unique dual indexes for pooling multiple samples |
| Quality Control Kits | Assessment of RNA and library quality | Bioanalyzer RNA-6000 Nano chip ($4.1/sample) [46] |
The landscape of bulk RNA-Seq continues to evolve with emerging technologies and methodologies that progressively reduce costs while maintaining or enhancing data quality. Methods such as BOLT-seq [47] and BRB-seq [46] demonstrate that strategic innovations in library preparation—particularly through early barcoding, pooling, and elimination of purification steps—can dramatically reduce per-sample costs without compromising data utility for core applications like differential expression analysis.
When designing bulk RNA-Seq experiments, researchers should prioritize the following considerations:
- Align methodology with specific biological questions—mRNA-Seq for protein-coding focus, total RNA-Seq for comprehensive transcriptome analysis
- Optimize the balance between replication and sequencing depth—favoring biological replication for differential expression studies
- Evaluate innovative protocols that offer cost savings through streamlined workflows
- Consider pooling strategies when facing high biological variability or input material limitations
As the RNA analysis market continues to grow—projected to reach $23.9 billion by 2035 [51]—the availability of cost-effective, scalable solutions for bulk RNA-Seq will likely expand, further empowering researchers to design studies that maximize informational return on investment while working within practical budget constraints.
In the field of precision oncology and complex disease research, capturing the intricate interactions between various cellular regulatory layers is paramount. Unlike rare genetic disorders caused by few variations, complex diseases like cancer require a comprehensive understanding of interactions between various cellular regulatory layers, necessitating data integration from various omics layers such as the transcriptome, epigenome, proteome, genome, metabolome, and microbiome [52]. Bulk RNA sequencing (RNA-seq) serves as a fundamental component in this multi-omics ecosystem, providing a comprehensive snapshot of the collective gene expression profiles of cell populations within a tissue sample. This methodology bridges the informational gap between the static genome and the dynamic proteome, enabling researchers to decipher active biological pathways and functional states within tissues under various conditions [53] [4].
The strategic value of bulk RNA-seq is further contextualized by the methodological choice between total RNA-seq and mRNA-seq. Total RNA-seq provides the most comprehensive transcriptome analysis by capturing all RNA species present in the sample, including both coding and non-coding RNAs (e.g., lncRNAs, miRNAs) [4]. In contrast, mRNA-seq specifically targets poly-adenylated protein-coding transcripts through poly(A) enrichment, making it more efficient and cost-effective for studying coding regions [4]. This distinction is crucial for multi-omics integration, as each approach offers unique advantages for specific research contexts within the broader thesis of mRNA versus total RNA sequencing in bulk research.
Strategic Integration of Bulk RNA-seq with Other Omics Data
The power of bulk RNA-seq is magnified when systematically correlated with other molecular data types, creating a more complete picture of cellular states and disease mechanisms. This integration allows researchers to move beyond correlation to establish potential causal relationships between genomic alterations, transcriptional regulation, and phenotypic outcomes.
Table 1: Multi-Omics Data Types and Their Integration with Bulk RNA-seq
| Omics Data Type | What It Measures | Integration Value with Bulk RNA-seq |
|---|---|---|
| Genome | DNA sequence and variations (SNPs, mutations) | Identifies expression quantitative trait loci (eQTLs) and connects genetic variants to gene expression changes [52] |
| Epigenome | DNA methylation, chromatin accessibility, histone modifications | Reveals transcriptional regulation mechanisms by correlating promoter methylation with gene expression changes [52] |
| Proteome | Protein abundance and post-translational modifications | Bridges transcript-protein expression relationships and identifies post-transcriptional regulation [52] |
| Metabolome | Small molecule metabolites and metabolic pathway intermediates | Connects transcriptional regulation to functional metabolic phenotypes and pathway activities [52] |
A compelling application of this integrative approach is demonstrated in cancer subtype classification, where bulk RNA-seq of gene expression data can be combined with epigenetic profiles such as promoter methylation to classify tumors based on clinically relevant molecular features like microsatellite instability (MSI) status. Research has shown that integrating gene expression and methylation profiles can achieve remarkably high classification accuracy (AUC = 0.981), enabling identification of patients likely to respond to specific therapies like immune checkpoint blockade, even without direct mutation data [52].
For drug discovery and development, bulk RNA-seq plays a pivotal role in understanding therapeutic mechanisms through pharmacotranscriptomics—the integration of transcriptomics and pharmacology. By analyzing transcriptomic changes in response to drug treatments, researchers can identify novel therapeutic targets, elucidate mechanisms of action (MoA), and discover biomarkers for patient stratification [53] [54]. This approach is particularly valuable for distinguishing primary (direct) from secondary (indirect) drug effects, especially when employing time-resolved RNA-seq methodologies that track transcriptional changes over multiple time points [53].
Methodological Framework: Experimental Design and Protocols
Bulk RNA-seq Experimental Workflow
Implementing a robust bulk RNA-seq experiment requires careful execution of several critical steps, from sample preparation to computational analysis. The foundational protocol begins with total RNA extraction from tissue or cell samples, followed by rigorous quality control assessment to determine RNA integrity [4] [55]. The subsequent steps diverge based on the chosen method: for mRNA-seq, poly(A) tail enrichment is performed to isolate messenger RNA, while for total RNA-seq, ribosomal RNA (rRNA) depletion is used to retain both coding and non-coding RNA species [4]. The enriched RNA is then converted to cDNA, adapter-ligated, and prepared for sequencing on an appropriate platform [4] [55].
A critical consideration in experimental design is the choice between mRNA-seq and total RNA-seq, which depends heavily on the research objectives. For projects focused exclusively on protein-coding genes, mRNA-seq offers greater sequencing depth, lower costs (typically 25-50 million reads per sample), and higher sensitivity with limited starting material [4]. Conversely, when investigating non-coding RNAs, novel transcripts, or conducting exploratory discovery research, total RNA-seq is essential despite its higher sequencing requirements (100-200 million reads per sample) and associated costs [4].
Table 2: Comparative Analysis: mRNA-seq vs. Total RNA-seq for Multi-omics Studies
| Parameter | mRNA-seq | Total RNA-seq |
|---|---|---|
| Target Regions | Protein-coding genes (poly-A selected) | All RNA species (coding and non-coding) |
| Key Applications | Differential gene expression, pathway analysis of coding genes | Discovery of novel transcripts, non-coding RNA analysis, comprehensive splicing analysis |
| Required Reads | 25-50 million per sample | 100-200 million per sample |
| Sample Input | Lower requirements, suitable for limited material | Higher requirements, needs more starting material |
| Cost Considerations | More cost-effective for coding transcriptome | Higher cost due to comprehensive coverage |
| Multi-omics Integration Value | Excellent for correlation with proteomic data | Superior for regulatory network analysis with epigenetic data |
Computational Analysis of Bulk RNA-seq Data
The analysis of bulk RNA-seq data generates a digital count matrix where rows represent genes and columns represent samples, with raw counts indicating the abundance of each transcript [55]. The standard analytical pipeline for differential expression begins with quality control of raw sequencing files (FASTQ) using tools like FastQC, followed by adapter trimming with Trimmomatic and alignment to a reference genome using STAR aligner [55]. Gene-level quantification is typically performed using HTSeq-count, generating the count matrix used for subsequent statistical analysis [55].
Differential expression analysis is most commonly performed using DESeq2, which employs a negative binomial distribution model to test for significant expression changes between experimental conditions [55]. The DESeq2 workflow includes normalization using size factors to account for differences in sequencing depth, followed by statistical testing using the Wald test to generate p-values [56] [55]. To account for multiple testing across thousands of genes, the Benjamini-Hochberg False Discovery Rate (FDR) correction is applied, resulting in adjusted p-values (padj) that control the expected proportion of false positives [55]. Additional refinement through effect size estimation using apeglm provides shrunken log2 fold-change values that are more robust and biologically meaningful [55].
Figure 1: Bulk RNA-seq Experimental and Computational Workflow
Quality assessment and visualization are crucial components of the analytical process. Principal Component Analysis (PCA) is routinely employed to visualize sample-to-sample distances and identify batch effects or outliers [55]. Prior to PCA, a variance-stabilizing transformation is applied to the count data to ensure stability of the variance across the dynamic range of expression levels [55]. The resulting PCA plot reveals global expression patterns and helps researchers assess whether experimental groups separate as expected based on the treatment or condition of interest.
Advanced Computational Approaches for Multi-Omics Integration
The complexity of multi-omics data integration has prompted the development of sophisticated computational frameworks that can capture non-linear relationships and interactions between different molecular layers. Deep learning approaches have emerged as particularly powerful tools for this task, as they can model the intricate, non-linear relationships that characterize biological systems [52]. However, a significant challenge in this field has been the limited reusability and adaptability of many published methods, with many tools existing as unstructured script collections rather than standardized, deployable software [52].
To address these limitations, frameworks like Flexynesis have been developed to streamline multi-omics data processing, feature selection, hyperparameter tuning, and marker discovery [52]. Flexynesis supports both deep learning architectures and classical supervised machine learning methods (e.g., Random Forest, Support Vector Machines, XGBoost) through a standardized interface, enabling researchers to perform single-task or multi-task modeling for regression, classification, and survival analysis [52]. This flexibility is particularly valuable for precision oncology, where predicting multiple clinical endpoints simultaneously—such as drug response and patient survival—from integrated omics data can provide a more comprehensive view of disease progression and therapeutic opportunities.
Figure 2: Multi-Omics Data Integration Computational Framework
In the context of AI-driven therapeutic interventions, machine learning (ML) and deep learning (DL) models are transforming bulk RNA-seq analysis from a descriptive to a predictive tool [54]. Supervised ML algorithms build predictive models based on independent features to solve classification and regression problems, while unsupervised ML identifies novel patterns from data sets using clustering and dimensionality reduction algorithms [54]. Deep learning, with its multi-layered neural networks, excels at handling complex large datasets by processing data through dense layers with weighted connections, biases, and activation functions to generate predictions [54]. These AI-based approaches are particularly valuable for biomarker discovery from transcriptomic data, enabling identification of gene signatures associated with various pathologies and accelerating the drug development process [54].
Successful execution of bulk RNA-seq studies and their integration with other omics data requires both wet-lab reagents and computational resources. The following table outlines essential components for implementing these methodologies.
Table 3: Essential Research Reagents and Computational Tools for Bulk RNA-seq
| Category | Item/Resource | Function/Purpose |
|---|---|---|
| Wet-Lab Reagents | rRNA depletion kits | Removes abundant ribosomal RNA to enrich for other RNA species in total RNA-seq [4] |
| Poly(A) selection beads | Enriches for mRNA by capturing poly-adenylated transcripts [4] | |
| cDNA synthesis kits | Converts RNA to stable cDNA for library construction and sequencing [4] | |
| Computational Tools | DESeq2 | Statistical software for differential gene expression analysis from count data [55] |
| Flexynesis | Deep learning framework for multi-omics data integration and modeling [52] | |
| AnnotationHub | Bioconductor resource for accessing genomic annotations and metadata [56] | |
| Data Resources | Reference genome (e.g., GRCh38) | Standardized genome sequence for read alignment and quantification [55] |
| GENCODE annotations | Comprehensive gene annotations for alignment and gene quantification [55] | |
| TCGA/CCLE databases | Publicly available multi-omics datasets for validation and benchmarking [52] |
Bulk RNA-seq represents a foundational technology in the multi-omics revolution, providing critical insights into transcriptional states that bridge genomic variation and functional proteomic outcomes. The strategic integration of bulk RNA-seq data with other molecular profiles—including genomic, epigenomic, and proteomic data—enables researchers to construct comprehensive models of disease mechanisms and therapeutic responses. As computational frameworks continue to evolve, particularly through advances in artificial intelligence and deep learning, the potential for extracting clinically actionable insights from integrated multi-omics data will continue to expand. By following rigorous experimental protocols and leveraging appropriate computational methodologies, researchers can maximize the value of bulk RNA-seq within multi-layered studies, ultimately advancing both basic biological understanding and precision medicine applications.
Navigating Challenges: Experimental Design and Data Analysis Solutions
In the realm of bulk RNA sequencing research, determining the appropriate sample size stands as one of the most critical decisions in experimental design, profoundly impacting the reliability, reproducibility, and scientific validity of research outcomes. Within the specific context of comparing mRNA sequencing to total RNA sequencing approaches, sample size considerations become even more paramount due to fundamental differences in what these methods capture and quantify. Statistical power—the probability that a test will correctly reject a false null hypothesis—is directly influenced by sample size and is essential for detecting genuine differential expression amidst biological variability [57] [58].
Underpowered studies with insufficient sample sizes contribute significantly to the reproducibility crisis in scientific literature, leading to both false positive findings (Type I errors) and false negatives (Type II errors) where real biological effects are missed [59] [57]. For research professionals in drug development, these errors can have substantial consequences, potentially misdirecting research pathways or causing promising therapeutic targets to be overlooked. This technical guide synthesizes current empirical evidence and statistical principles to establish rigorous, practical frameworks for sample size determination in bulk RNA-seq studies, with particular attention to the distinct considerations required for mRNA-seq versus total RNA-seq experimental designs.
Theoretical Foundations: Statistical Power and Error Types
Key Statistical Concepts and Relationships
The relationship between sample size, statistical power, effect size, and error rates forms the theoretical foundation for robust experimental design. In statistical hypothesis testing for transcriptomic studies, researchers must balance two potential error types: Type I errors (false positives) occur when a test incorrectly rejects a true null hypothesis (e.g., declaring a gene differentially expressed when it is not), while Type II errors (false negatives) occur when a test fails to reject a false null hypothesis (e.g., missing a genuinely differentially expressed gene) [57].
The probability of committing a Type I error is denoted by alpha (α), typically set at 0.05, while the probability of a Type II error is denoted by beta (β). Statistical power is calculated as 1-β and represents the probability of correctly detecting an effect when it truly exists [57] [58]. The ideal power for a study is generally considered to be 0.8 (or 80%), though higher power may be required for studies with more stringent detection requirements [57]. The relationship among these factors is mathematically interconnected: for a given effect size and alpha level, increasing sample size increases statistical power, thereby reducing the risk of Type II errors.
Practical Implications of Statistical Errors in Transcriptomics
In practical terms for RNA-seq research, Type I errors can lead to false leads and wasted resources pursuing gene targets that are not genuinely involved in the biological process under investigation. Conversely, Type II errors cause researchers to miss potentially important biological discoveries and therapeutic targets [59]. The traditional emphasis on controlling Type I errors through significance thresholds (e.g., p < 0.05) has often overshadowed the critical importance of addressing Type II errors through adequate power and sample size, particularly in genomics where multiple testing correction further reduces power [57].
The concept of the "winner's curse" or Type M error (magnitude error) is particularly relevant in underpowered transcriptomic studies, where detected effect sizes (fold changes) tend to be systematically inflated compared to the true biological effect [59]. This occurs because, in low-power settings, only the most extreme random variations meet the significance threshold, leading to overestimation of true biological effects in subsequent validation studies.
Empirical Evidence: Sample Size Recommendations from Large-Scale Studies
Murine Model Studies Revealing Minimum Sample Requirements
Recent large-scale empirical research provides concrete guidance for sample size determination in animal model transcriptomic studies. A comprehensive 2025 study published in Nature Communications conducted an extensive comparative analysis using N = 30 wild-type mice and N = 30 heterozygous mice across four organs to establish empirical sample size guidelines [59].
This groundbreaking research demonstrated that experiments with N = 4 or fewer replicates per group produce "highly misleading" results characterized by high false positive rates and failure to detect genes later identified with larger sample sizes [59]. The findings revealed that for a 2-fold expression difference cutoff, N = 6-7 mice per group is required to consistently decrease the false positive rate below 50% and increase detection sensitivity above 50%. However, the authors emphasized that "more is always better for both metrics," with N = 8-12 providing significantly better recapitulation of the full experiment's findings [59].
Table 1: Empirical Sample Size Guidelines from Murine Studies (N=30 Gold Standard)
| Sample Size (N) | False Discovery Rate | Sensitivity | Recommendation Level |
|---|---|---|---|
| N ≤ 4 | Very High (>50%) | Very Low | Inadequate |
| N = 5 | High | Low | Minimal |
| N = 6-7 | <50% | >50% | Minimum Required |
| N = 8-12 | Low | Good | Recommended |
| N > 12 | Lowest | Highest | Optimal |
Impact of Fold Change Thresholds on Power
A common strategy to compensate for limited sample size is to raise the fold-change threshold for declaring differential expression. However, empirical evidence demonstrates that this approach is "no substitute for increasing the N of the experiment" [59]. While higher fold-change thresholds may reduce false positives, they introduce systematic biases including consistently inflated effect sizes and substantial drops in detection sensitivity for biologically relevant but modest expression changes [59].
The variability in false discovery rates across experimental trials is particularly pronounced at low sample sizes. In the murine study, false discovery rates ranged between 10-100% depending on which N = 3 mice were selected for each genotype, with this variability decreasing markedly by N = 6 [59]. This highlights the critical importance of adequate replication not only for improving average performance metrics but also for ensuring consistent, reliable results across experimental iterations.
Methodological Protocols for Power Analysis and Sample Size Determination
Power Analysis Workflow for Transcriptomic Studies
The following diagram illustrates the systematic workflow for conducting power analysis in RNA-seq studies:
Practical Implementation of Power Calculations
Implementing power analysis for RNA-seq studies requires careful consideration of several methodological factors. Researchers must first define key parameters including the minimum effect size of biological interest (typically expressed as fold change), acceptable false discovery rate (FDR, often set at 0.05-0.1), desired statistical power (typically 0.8-0.9), and expected data dispersion [60] [61].
For bulk RNA-seq experiments, the negative binomial distribution has become the standard model for representing count data due to its ability to account for overdispersion common in transcriptomic data [60] [61]. Empirical evidence demonstrates that increasing sample size has a substantially greater impact on power compared to increasing sequencing depth, especially once sequencing depth reaches approximately 20 million reads per sample [61]. This highlights the importance of prioritizing biological replicates over sequencing depth when facing budget constraints.
Several specialized software tools have been developed for power analysis in RNA-seq studies, including 'RNASeqPower' and tools incorporated within packages like 'DESeq2' and 'edgeR' [60]. These tools typically require pilot data or published parameter estimates from similar experiments to accurately estimate dispersion and other necessary parameters. When pilot data is unavailable, researchers can utilize published data sets from comparable studies or conservative parameter estimates based on empirical patterns observed across diverse experimental conditions [61].
Technical Considerations: mRNA-seq vs. Total RNA-seq Applications
Methodological Differences and Their Impact on Experimental Design
The choice between mRNA sequencing and total RNA sequencing has significant implications for sample size determination and power calculations. These methods differ fundamentally in their library preparation strategies, transcript coverage, and applications, as summarized in the table below:
Table 2: Technical Comparison of mRNA-seq and Total RNA-seq Approaches
| Parameter | mRNA Sequencing | Total RNA Sequencing |
|---|---|---|
| Enrichment Method | Poly(A) selection | Ribosomal RNA depletion |
| Transcript Coverage | Protein-coding genes only | Coding and non-coding RNA |
| Region Covered | 3'-end biased (3' mRNA-seq) or full-length | Even coverage across transcripts |
| Recommended Applications | Differential gene expression analysis | Whole transcriptome analysis, isoform identification, splicing analysis |
| Typical Sequencing Depth | 25-50 million reads/sample | 100-200 million reads/sample |
| Sample Input Requirements | Lower input requirements | Higher input typically needed |
| Cost Considerations | More cost-effective for focused DGE | More expensive due to broader coverage and depth |
Sample Size Implications for Different Sequencing Approaches
The selection between mRNA-seq and total RNA-seq directly influences sample size decisions through several mechanisms. Total RNA-seq typically requires 3-4 times more sequencing reads per library compared to mRNA-seq for equivalent transcriptome coverage of protein-coding genes, directly impacting cost structures and potentially limiting the number of biological replicates feasible within a fixed budget [4] [62].
For mRNA-seq studies focusing exclusively on differential expression of protein-coding genes through 3' enrichment methods, the reduced sequencing depth requirements per sample may enable larger sample sizes, thereby increasing statistical power for detecting expression differences [62]. Conversely, total RNA-seq experiments examining non-coding RNAs or splicing variants require greater sequencing depth and more complex analytical approaches, potentially necessitating trade-offs between sample size and analytical comprehensiveness [4].
Degraded RNA samples, such as those from FFPE tissues, present additional considerations. Total RNA-seq with random priming may outperform 3' mRNA-seq with poly(A) selection for compromised samples where poly(A) tails may be degraded [62]. In such cases, the potential reduction in data quality may require increased sample sizes to maintain statistical power.
Table 3: Essential Research Reagents and Computational Tools for RNA-seq Power Analysis
| Tool Category | Specific Examples | Function and Application |
|---|---|---|
| Library Prep Kits | Zymo-Seq RiboFree Total RNA Library Kit, Zymo-Seq SwitchFree 3' mRNA Library Kit | Method-specific RNA library preparation tailored to mRNA or total RNA sequencing |
| Spike-In Controls | SIRVs (Spike-In RNA Variant Control Mixes) | Technical performance monitoring, normalization, and quality assessment |
| RNA Extraction Reagents | Various commercial kits with gDNA removal | High-quality RNA isolation with genomic DNA contamination prevention |
| Power Analysis Software | RNASeqPower, ssizeRNA, PROPER | Sample size estimation and power calculations for RNA-seq experimental designs |
| Differential Expression Tools | DESeq2, edgeR, limma-voom | Statistical analysis of differentially expressed genes with power considerations |
| Quality Control Packages | FastQC, MultiQC, RSeQC | Assessment of RNA-seq data quality and identification of potential biases |
Determining optimal sample size for robust power and reproducibility in RNA-seq research requires careful integration of empirical guidelines, statistical principles, and practical research constraints. The evidence consistently demonstrates that sample sizes commonly used in published literature (N=3-6) are frequently inadequate, with N=6-7 representing a minimum threshold and N=8-12 providing substantially improved reliability for most applications [59].
Researchers must balance these empirical recommendations with practical considerations including budget limitations, sample availability, and ethical concerns, particularly in animal studies [59] [57]. The strategic allocation of resources toward biological replicates rather than excessive sequencing depth represents one of the most effective approaches for maximizing statistical power within fixed budgets [61].
For research professionals in drug development, where decisions have significant downstream implications, investing in adequately powered studies represents not merely a statistical consideration but a fundamental requirement for generating reliable, actionable data. By applying the empirical guidelines and methodological frameworks presented in this technical guide, researchers can design transcriptomic studies with appropriate statistical power, enhancing both reproducibility and scientific impact in the competitive landscape of drug discovery and development.
Formalin-fixed, paraffin-embedded (FFPE) tissues represent one of the most valuable resources for biomedical research, with over a billion samples stored in hospitals and tissue banks worldwide [63]. These samples are invaluable for identifying risk biomarkers, with wide availability and extended clinical follow-up information [64]. However, RNA derived from archival FFPE samples presents significant challenges for reliable transcriptomic analysis. The formalin fixation process causes chemical modifications, including oxidation and cross-linking, which extensively damage RNA [63]. This degradation manifests as random fragmentation of RNA strands, leading to a characteristic 3' bias in sequencing data as 5' transcript information is lost [65]. Additionally, low-input RNA samples from clinical settings pose similar challenges for generating robust gene expression data. This technical guide examines integrated strategies—spanning wet-lab protocols, kit selection, and computational tools—to maximize the scientific value derived from degraded and challenging RNA samples, with particular emphasis on the strategic choice between total RNA and 3' mRNA sequencing approaches in bulk research.
RNA Extraction: Foundational Steps for Quality and Yield
The process of obtaining high-quality RNA from FFPE samples begins with optimized extraction methods. A systematic comparison of seven commercial FFPE RNA extraction kits revealed significant disparities in both the quantity and quality of RNA recovered across different tissue types [63]. The study used standardized samples from tonsil, appendix, and B-cell lymphoma lymph node tissues, evaluating each extraction method in triplicate.
Extraction Kit Performance and Quality Metrics
- Performance Variability: Despite using similar sequential steps (deparaffinization, digestion, binding, cleaning, and elution), different kits yielded substantially different results in terms of both RNA quantity and quality [63].
- Quality Assessment: RNA quality is typically measured using two key parameters: RNA Quality Score (RQS) on a scale of 1-10, and DV200 values expressed as percentages, which represent the percentage of RNA fragments larger than 200 nucleotides [63].
- Leading Kits: Among the tested kits, the Roche kit systematically provided better quality recovery, while the ReliaPrep FFPE Total RNA miniprep from Promega yielded the best combination of both quantity and quality across the tested tissue samples [63].
Table 1: Key Metrics for Evaluating RNA Extraction Success from FFPE Samples
| Metric | Description | Target Values | Measurement Method |
|---|---|---|---|
| RNA Concentration | Quantity of RNA recovered | >25 ng/µL for library prep [64] | Spectrophotometry (NanoDrop) [63] |
| DV200 | Percentage of RNA fragments >200 nucleotides | >30% (minimum threshold) [33] | Bioanalyzer/TapeStation [63] |
| RQS | RNA Quality Score (1-10 scale) | Higher values indicate better integrity [63] | Nucleic acid analyzer [63] |
| Pre-capture Library Qubit | Quantity of library prepared | >1.7 ng/µL for sequencing [64] | Fluorometric quantification |
Tissue Preparation and Macrodissection Techniques
Optimized tissue processing is crucial for successful RNA extraction. Pathologist-assisted macrodissection enables precise selection of regions of interest, which is particularly important for heterogeneous tissues like melanoma lymph node metastases [33]. This approach ensures high tumor content for DNA extraction and proper sampling of the infiltrated tumor microenvironment for transcriptomic analysis, maximizing the biological relevance of the extracted nucleic acids.
Library Preparation Strategies for Degraded RNA
Choosing an appropriate library preparation method is critical for successful RNA sequencing of degraded samples. Different strategies have been developed to address the challenges of fragmented RNA.
Whole Transcriptome vs. 3' mRNA Sequencing
The choice between whole transcriptome sequencing and 3' mRNA sequencing depends on the research goals and sample quality:
- Whole Transcriptome Sequencing provides a global view of all RNA types (coding and non-coding) and enables detection of alternative splicing, novel isoforms, and fusion genes. However, it requires more sequencing depth (typically ~30 million reads per sample) and is more susceptible to biases from RNA degradation [3].
- 3' mRNA Sequencing focuses on the 3' end of transcripts, providing accurate gene expression quantification with much lower sequencing depth (2-5 million reads per sample). This method is particularly robust for degraded RNA common in FFPE samples, as the 3' ends are better preserved [66] [3].
Table 2: Comparison of Library Preparation Methods for Degraded RNA
| Method | Principle | Optimal Input | Advantages | Limitations |
|---|---|---|---|---|
| SMARTer Stranded Total RNA-Seq | Template-switching mechanism | Low input (1ng demonstrated) [67] | Works with highly degraded samples; maintains strand information [33] | Higher rRNA content observed in some studies [33] |
| Illumina Stranded Total RNA Prep with Ribo-Zero Plus | Ribodepletion-based | Standard input (100ng) [67] | Effective rRNA removal (0.1% reported) [33]; better alignment performance [33] | Less optimal for very low input samples [67] |
| 3' mRNA-Seq (e.g., QuantSeq) | Oligo(dT) priming for 3' capture | Wide range, suitable for degraded RNA [3] | Cost-effective; simple workflow; ideal for gene expression quantification [66] [3] | Loses isoform information; requires good 3' annotation [3] |
| TruSeq RNA Access | Exon capture-based | 20-100ng [67] | Targets coding regions; performs well with poor quality RNA [67] | Limited to known exonic regions; additional capture step required [67] |
Methodological Comparisons and Performance
Comparative studies provide practical insights for method selection. Research comparing TaKaRa SMARTer Stranded Total RNA-Seq Kit v2 (Kit A) and Illumina Stranded Total RNA Prep Ligation with Ribo-Zero Plus (Kit B) found that both kits generated high-quality data from FFPE melanoma samples, but with important differences [33]. Kit A achieved comparable gene expression quantification to Kit B while requiring 20-fold less RNA input, a crucial advantage for limited samples, though it showed increased ribosomal RNA content (17.45% vs. 0.1%) [33]. Despite these technical differences, both methods showed 83.6-91.7% concordance in differentially expressed genes and similar pathway enrichment results [33].
For projects focusing primarily on gene expression quantification, 3' mRNA-seq methods provide significant advantages. Studies comparing whole transcriptome and 3' sequencing approaches found that while whole transcriptome methods detected more differentially expressed genes, biological conclusions at the pathway level were highly consistent between both methods [3].
The following workflow diagram illustrates the decision process for selecting the appropriate RNA sequencing method based on sample quality and research objectives:
Quality Control and Benchmarking
Implementing rigorous quality control measures is essential for successful RNA sequencing of degraded samples.
Pre-sequencing Quality Thresholds
Mayo Clinic researchers established specific quality control recommendations for FFPE samples based on extensive benchmarking [64]. Their findings indicate that samples with median RNA concentration below 18.9 ng/μL and pre-capture library Qubit values below 2.08 ng/μL tend to fail bioinformatics quality control [64]. They recommend a minimum concentration of 25 ng/μL FFPE-extracted RNA for library preparation and 1.7 ng/μL pre-capture library output to achieve adequate RNA-seq data [64].
Post-sequencing Bioinformatics QC
Bioinformatics quality control failure is typically determined by three key metrics: sample-wise Spearman correlation < 0.75, fewer than 25 million reads mapped to gene regions, or detection of fewer than 11,400 genes with TPM > 4 [64]. A decision tree model based on input RNA concentration and input library Qubit values achieved an F-score of 0.848 in predicting QC status of FFPE samples, enabling researchers to prioritize samples with the highest likelihood of success [64].
Computational Repair of Degraded RNA-seq Data
Advanced computational methods now offer promising approaches to address degradation artifacts in RNA-seq data.
Deep Learning for Transcriptome Restoration
DiffRepairer represents a cutting-edge approach that uses Transformer architecture with conditional diffusion models to reverse the effects of RNA degradation [65]. This framework learns the inverse mapping of the degradation process by training on "degraded-original" paired data generated through comprehensive simulation pipelines [65]. The method systematically outperforms traditional statistical methods and standard deep learning models in both reconstruction accuracy and preservation of key biological signals, such as differentially expressed genes [65].
Degradation Simulation and Modeling
The degradation process is computationally modeled through three main components [65]:
- 3' Bias: Simulated by a bias matrix that disproportionately reduces expression signals of longer transcripts
- Gene Dropout: Modeled through a binary mask vector that sets gene expression values to zero with a certain probability
- Technical Noise: Represented by additive Gaussian noise to reproduce random fluctuations from sequencing
The Scientist's Toolkit: Essential Research Reagents and Materials
Table 3: Key Research Reagent Solutions for FFPE RNA Studies
| Product/Reagent | Function | Application Notes |
|---|---|---|
| ReliaPrep FFPE Total RNA Miniprep (Promega) | RNA extraction from FFPE tissues | Provided best quantity/quality ratio in comparative study [63] |
| SMARTer Stranded Total RNA-Seq Kit v2 (TaKaRa) | Library preparation from low-input RNA | Suitable for very low input (1ng); ideal for limited samples [33] [67] |
| Illumina Stranded Total RNA Prep with Ribo-Zero Plus | Library preparation with ribosomal depletion | Excellent rRNA removal (0.1% residual); superior alignment rates [33] |
| QuantSeq 3' mRNA-Seq Kit (Lexogen) | 3' mRNA sequencing | Cost-effective for large studies; requires only 1-5M reads/sample [3] |
| TruSeq RNA Access (Illumina) | Exon capture-based library prep | Optimized for degraded samples; effective with 20ng input [67] |
| Proteinase K | Digests proteins and breaks crosslinks | Essential for reversing formalin-induced crosslinks [63] |
| Xylene | Deparaffinization | Removes paraffin from FFPE sections prior to digestion [63] |
Maximizing RNA sequencing success from degraded and challenging samples requires an integrated approach spanning sample preparation, method selection, and computational analysis. Key recommendations include:
- Prioritize RNA Quality: Implement rigorous QC measures with minimum thresholds of 25 ng/μL concentration and DV200 > 30% for FFPE samples [64] [33].
- Match Methods to Goals: Select whole transcriptome sequencing for isoform discovery and 3' mRNA sequencing for cost-effective gene expression quantification in large studies [3].
- Leverage Specialized Kits: Utilize kits specifically optimized for low-input and degraded RNA, such as SMARTer or optimized RNA Access protocols [33] [67].
- Implement Computational Repair: Consider advanced tools like DiffRepairer to computationally correct degradation artifacts, particularly for valuable archival samples [65].
As the RNA analysis market continues to grow at 13.36% CAGR, reaching an estimated $23.9 billion by 2035, technological advances in both wet-lab protocols and computational methods will further enhance our ability to extract meaningful biological insights from even the most challenging clinical samples [51].
Bulk RNA sequencing (RNA-Seq) has become a foundational technology for transcriptomic research, enabling large-scale inspection of mRNA levels in living cells [38]. While the core question—mRNA vs. total RNA sequencing—begins with wet-lab decisions on RNA selection, the computational journey that follows is fraught with challenges that directly impact data interpretation. The choice between these methods dictates the fundamental structure of the bioinformatics data to be analyzed, influencing everything from sequencing depth requirements to the complexity of transcript assembly and quantification [4]. This guide addresses the core bioinformatics hurdles—data complexity, read mapping, and interpretation—within the specific context of bulk mRNA and total RNA research, providing researchers and drug development professionals with detailed methodologies and practical frameworks for robust analysis.
Data Complexity: Navigating mRNA and Total RNA-Seq Workflows
The initial experimental choice between mRNA-Seq and total RNA-Seq defines the computational landscape by determining the types and complexities of RNA molecules that must be processed, identified, and quantified.
Fundamental Methodological Differences
mRNA Sequencing (mRNA-Seq): This method employs poly(A) affinity screening to enrich for messenger RNAs that contain poly-adenylated tails. It effectively targets the protein-coding region of eukaryotic transcriptomes, constituting only 3-7% of the mammalian transcriptome [4]. By focusing on this small fraction, mRNA-Seq allows for library preparation with smaller sample sizes, increased sequencing depth for coding genes, and a more cost-effective workflow, typically requiring only 25-50 million sequencing reads per sample [4]. From a bioinformatics perspective, this simplification comes at the cost of losing information about non-polyadenylated transcripts.
Total RNA Sequencing (Whole Transcriptome Sequencing): This comprehensive approach sequences all RNA molecules, both coding and non-coding, after the removal of ribosomal RNA (rRNA) [4]. It captures a diverse collection of RNA molecules including mRNAs, precursor mRNAs (pre-mRNAs), long non-coding RNAs (lncRNAs), microRNAs (miRNAs), and other non-coding RNAs [4]. The bioinformatics burden increases substantially, as total RNA-Seq requires more sequencing data (typically 100-200 million reads per sample) to adequately cover this expanded transcriptional space [4]. This method is essential when investigating non-coding RNAs, alternative splicing patterns, or working with prokaryotic samples where poly(A) tails are absent.
Strategic Selection for Research Objectives
The decision framework below outlines how experimental goals should guide the choice between these methods, subsequently determining the bioinformatics strategies required.
Table 1: Comparative Analysis of RNA-Seq Methodologies
| Parameter | mRNA Sequencing | Total RNA Sequencing |
|---|---|---|
| Target Transcripts | Polyadenylated (poly(A)+) mRNA only [4] | All coding and non-coding RNA (except rRNA) [4] |
| Typical Read Depth | 25-50 million reads/sample [4] | 100-200 million reads/sample [4] |
| Key Applications | Gene expression quantification, differential expression analysis [3] | Isoform discovery, splicing analysis, non-coding RNA characterization [3] |
| Cost Efficiency | Higher for focused coding transcriptome analysis [4] | Higher for comprehensive transcriptome coverage [4] |
| 3' Bias | Present in 3' mRNA-Seq protocols [3] | More uniform coverage across transcript body [34] |
| Strandedness | Often stranded to resolve overlapping genes | Requires strand-specific protocols for accurate annotation [4] |
Experimental Protocols: From Raw Data to Expression Matrix
The computational workflow for both mRNA-Seq and total RNA-Seq shares a common framework for transforming raw sequencing data into structured expression matrices, though with important methodological distinctions.
Standard Bulk RNA-Seq Analysis Pipeline
A robust bioinformatics protocol for bulk RNA-Seq involves multiple processing stages, each with specific tools and quality control checkpoints. The following workflow is adapted from established best practices for analyzing next-generation sequencing data [38].
Software Installation and Environment Setup
Begin by installing required bioinformatics tools using the Bioconda package manager. Essential software includes FastQC (quality control), Trimmomatic (adapter trimming), HISAT2 or STAR (read alignment), Samtools (file processing), and featureCounts (read quantification) [38]. Installation can be accomplished with the command: conda install -y -c bioconda fastqc trimmomatic hisat2 samtools subread [38].
Data Preparation and Quality Control
- Download FASTQ Files: Obtain raw sequencing files from sequencing platforms or public repositories like GEO using appropriate downloaders such as the SRA Toolkit [38].
- Quality Assessment: Run FastQC on all FASTQ files to assess read quality, GC content, adapter contamination, and other potential issues:
fastq *fastq[38]. - Adapter Trimming: Use Trimmomatic to remove adapter sequences and low-quality bases:
java -jar trimmomatic.jar PE -phred33 input_1.fastq input_2.fastq output_1.fastq output_1_unpaired.fastq output_2.fastq output_2_unpaired.fastq ILLUMINACLIP:adapters.fa:2:30:10 LEADING:3 TRAILING:3 SLIDINGWINDOW:4:15 MINLEN:36[38].
Read Alignment and Quantification
- Alignment to Reference: Map trimmed reads to a reference genome using a splice-aware aligner. For example, with HISAT2:
hisat2 -x genome_index -1 output_1.fastq -2 output_2.fastq -S aligned.sam[38]. Alternatively, STAR provides superior splicing detection:STAR --genomeDir genome_index --readFilesIn output_1.fastq output_2.fastq --outSAMtype BAM SortedByCoordinate[68]. - File Conversion: Convert SAM files to BAM format and index:
samtools view -S -b aligned.sam > aligned.bamfollowed bysamtools index aligned.bam[38]. - Read Quantification: Generate count matrices using featureCounts:
featureCounts -T 8 -t exon -g gene_id -a annotation.gtf -o counts.txt aligned.bam[38]. This produces the final count matrix for differential expression analysis.
Advanced Quantification Approaches
For more accurate transcript quantification, particularly important in total RNA-Seq where isoform diversity is greater, pseudoalignment tools such as Salmon offer advantages by modeling uncertainty in read assignments [68]. These tools can operate in alignment-free mode or use alignment files (BAM) from tools like STAR in a hybrid approach: salmon quant -t transcriptome.fa -l ISF -a aligned.bam -o salmon_quant [68].
The Scientist's Toolkit: Essential Research Reagents and Computational Solutions
Successful RNA-Seq analysis requires both wet-lab reagents and computational resources. The following table details key components of the RNA-Seq workflow.
Table 2: Essential Research Reagents and Computational Tools for RNA-Seq Analysis
| Item | Function/Purpose | Examples/Alternatives |
|---|---|---|
| Poly(A) Selection Beads | Enriches for polyadenylated mRNA in mRNA-Seq protocols [4] | Oligo(dT) magnetic beads |
| Ribosomal Depletion Kits | Removes abundant rRNA in total RNA-Seq [4] | Ribozero, RiboMinus |
| Stranded Library Prep Kits | Preserves strand information during cDNA synthesis [4] | Illumina Stranded mRNA, Collibri Stranded RNA [69] |
| Spike-in Control RNAs | Normalization controls for technical variation [70] | ERCC, SIRV, Sequin [70] |
| Splice-Aware Aligner | Maps RNA-seq reads across splice junctions | STAR [68], HISAT2 [38], GSNAP |
| Quantification Tool | Estimates transcript/gene abundance levels | featureCounts [38], Salmon [68], HTSeq |
| Differential Expression Package | Identifies statistically significant expression changes | DESeq2, limma [68], edgeR |
Read Mapping and Interpretation Challenges
The process of aligning sequencing reads to a reference and interpreting the results presents distinct challenges that vary between mRNA and total RNA datasets.
Mapping Strategies and Their Implications
Read mapping involves two primary approaches with significant implications for data interpretation:
Alignment-Based Mapping: Traditional methods like STAR perform formal sequence alignment to a genome, providing exact coordinates of sequence matches and splice junctions [68]. This approach generates comprehensive alignment files (BAM) that facilitate extensive quality control metrics and visualization but is computationally intensive, especially for large total RNA-Seq datasets.
Pseudoalignment: Tools like Salmon and kallisto use probabilistic matching to determine transcript origin without base-level alignment [68]. This approach is significantly faster and particularly valuable when scaling to thousands of samples, though it provides less information for detailed QC assessment.
For projects where alignment-based QC is valuable, a hybrid approach is recommended: use STAR for initial alignment to generate QC metrics, then use Salmon in alignment-based mode for quantification [68].
Advanced Considerations for Long-Read Technologies
While this guide focuses primarily on short-read sequencing, the emergence of long-read RNA-Seq (Nanopore, PacBio) presents both opportunities and challenges for transcript-level analysis [70] [71]. Long-read technologies enable end-to-end sequencing of full-length transcripts, overcoming limitations in isoform resolution that plague short-read methods [70]. However, they introduce new bioinformatics challenges including higher error rates, specialized base-calling algorithms, and different normalization strategies. The SG-NEx project provides a comprehensive benchmark for developing computational methods for long-read RNA-Seq data [70].
Interpretation Hurdles and Quantitative Frameworks
The final stage of RNA-Seq analysis transforms quantitative data into biological insights, requiring careful statistical treatment and understanding of methodological limitations.
Differential Expression Analysis
After generating a count matrix, differential expression analysis identifies genes with statistically significant expression changes between conditions. The limma package provides a robust framework for this analysis using a linear modeling approach [68]. Key steps include:
- Data Normalization: Correct for technical variations in library size and composition using methods like TMM (trimmed mean of M-values).
- Linear Modeling: Fit expression data to a linear model that accounts for experimental design.
- Empirical Bayes Moderation: Borrow information across genes to stabilize variance estimates, particularly important for experiments with small sample sizes.
- Multiple Testing Correction: Apply false discovery rate (FDR) controls to account for the thousands of simultaneous hypothesis tests performed.
Method-Specific Biases and Artifacts
Different RNA-Seq library preparation methods introduce distinct biases that must be considered during interpretation:
- Transcript Length Bias: Traditional methods (e.g., TruSeq) assign more reads to longer transcripts, while 3' mRNA-Seq methods (e.g., QuantSeq) assign roughly equal reads regardless of length [3]. This significantly impacts cross-protocol comparisons and requires appropriate normalization.
- Coverage Uniformity: Full-length double-stranded cDNA methods (e.g., SMARTer) provide more uniform coverage across gene bodies, while methods like TeloPrime show strong 5' enrichment but poorer 3' coverage [34].
- Detection Sensitivity: Traditional methods generally detect more expressed genes and splicing events compared to full-length approaches, though the latter may offer advantages for specific applications like transcription start site identification [34].
Quantitative Comparison of Protocol Performance
Systematic benchmarking of RNA-Seq methods provides critical data for interpreting results within the appropriate technical context.
Table 3: Performance Comparison of RNA-Seq Library Preparation Methods
| Performance Metric | TruSeq (Traditional) | SMARTer (Full-length) | TeloPrime (Full-length) |
|---|---|---|---|
| Number of Detected Genes | High (~12,000) [34] | High (~12,000) [34] | Low (~6,000) [34] |
| Correlation with TruSeq | 1.0 (Reference) [34] | 0.883-0.906 [34] | 0.660-0.760 [34] |
| Coverage Uniformity | Moderate [34] | High [34] | Low (5' biased) [34] |
| Splicing Event Detection | High (~14,000 events) [34] | Moderate (~7,000 events) [34] | Low (~4,000 events) [34] |
| TSS Enrichment | Moderate [34] | Moderate [34] | High [34] |
| Genomic DNA Amplification | Low [34] | High [34] | Low [34] |
Successful navigation of RNA-Seq bioinformatics hurdles requires understanding how initial methodological choices between mRNA and total RNA sequencing propagate through the entire analytical workflow. The computational strategies for read mapping, quantification, and interpretation must be tailored to the specific characteristics of each approach, considering their distinct advantages and limitations. As RNA-Seq technologies continue to evolve—particularly with the emergence of long-read sequencing—bioinformatics methods must similarly advance to address new complexities in transcriptome analysis. By applying the structured frameworks and comparative metrics outlined in this guide, researchers can make informed decisions that optimize their experimental designs and computational approaches for robust biological discovery.
In the field of bulk RNA sequencing research, library preparation serves as the foundational process that can determine the success or failure of entire experiments. This technical guide examines the critical artifacts and biases introduced during library preparation and sequencing, with particular emphasis on the methodological distinctions between messenger RNA (mRNA) and total RNA sequencing approaches. In modern high-throughput genomics laboratories, an estimated over 50% of sequencing failures or suboptimal results can be traced back to issues originating in library preparation [72]. These technical artifacts not only compromise data quality but can lead to erroneous biological interpretations, particularly in drug development contexts where accurate transcript quantification is paramount.
The fundamental difference between mRNA and total RNA sequencing begins at the library preparation stage. Traditional mRNA sequencing primarily captures polyadenylated (poly-A) transcripts through oligo-dT enrichment, providing a focused view of protein-coding genes while excluding numerous non-coding RNA species [73]. In contrast, total RNA sequencing employs ribosomal RNA (rRNA) depletion methods to retain both coding and non-coding RNA molecules, offering a more comprehensive perspective on the transcriptome [73]. Each approach carries distinct technical considerations and potential biases that researchers must understand and mitigate to generate biologically meaningful data.
Technical Biases in Library Preparation Workflows
Fragmentation Methods and Associated Biases
The fragmentation step in library preparation critically influences sequencing accuracy and coverage uniformity. Consistent DNA fragmentation is a fundamental prerequisite for generating high-fidelity sequencing data, as a uniform distribution of fragment sizes ensures even coverage across the entire genome without sequence bias [74]. Traditional methods include mechanical shearing and enzymatic approaches, each with distinct advantages and limitations:
Table 1: Comparison of DNA Fragmentation Methods
| Fragmentation Method | Principle | Advantages | Limitations | Impact on Bias |
|---|---|---|---|---|
| Acoustic Shearing (Covaris AFA) | Controlled bursts of high-frequency acoustic energy | Minimal sequence bias, tight size distribution, reproducible | Requires specialized equipment, sample handling can cause loss | Prefers fragmentation in GC- or AT-rich regions [74] |
| Enzymatic Fragmentation | Nuclease cocktails or transposases (tagmentation) | Low-input compatible, automation-friendly, lower equipment cost | Potential sequence bias (motif or GC content preference), batch-to-batch variability | Introduces sample-specific biases, variable fragment sizes [74] [72] |
| Chemical Fragmentation | Heat + divalent cations | Simple protocol, low cost | Less control over size distribution | Increased RNA degradation risk [75] |
Mechanical shearing methods like Adaptive Focused Acoustics (AFA) demonstrate superior performance in bias reduction, as they function as an unbiased physical process that prevents fragmentation preferences in GC- or AT-rich genomic regions [74]. Enzymatic methods, while convenient and amenable to automation, may introduce significant sequence-specific biases that propagate through subsequent analysis steps.
RNA Selection and Enrichment Biases
The choice between mRNA enrichment and rRNA depletion represents a critical branching point in library preparation with profound implications for transcriptome coverage:
Poly-A Enrichment Bias: Traditional mRNA sequencing employs oligo-dT primers to capture polyadenylated RNA molecules, introducing 3'-end capture bias that preferentially represents the 3' ends of transcripts [75]. This approach systematically excludes non-polyadenylated RNAs including many non-coding RNAs, histone genes, and partially degraded transcripts [73].
rRNA Depletion Methods: Total RNA sequencing utilizes probes to remove abundant ribosomal RNAs, preserving both coding and non-coding RNA species. However, efficiency varies across RNA classes, and residual rRNA (typically 5-15%) can reduce sequencing depth for informative transcripts [73].
Dynamic Range Limitations: Both methods struggle with extreme transcript abundances, potentially underrepresenting either low-abundance transcripts or failing to quantitatively represent highly expressed genes.
Adapter Ligation and Amplification Biases
Adapter ligation and PCR amplification introduce substantial technical artifacts that must be carefully managed:
Adapter Ligation Bias: T4 RNA ligases exhibit sequence-specific preferences, potentially underrepresenting fragments with disfavored terminal sequences [75]. This bias can be mitigated by using adapters with random nucleotides at the ligation extremities [75].
PCR Amplification Artifacts: Amplification stochastically introduces biases that propagate through subsequent cycles, including preferential amplification of fragments with neutral GC content and duplication events that complicate quantification [75]. The number of PCR cycles should be minimized, with high-fidelity polymerases like Kapa HiFi providing superior performance compared to alternatives like Phusion [75].
Unique Molecular Identifiers (UMIs): Incorporating UMIs during adapter ligation enables bioinformatic correction of PCR amplification bias and more accurate transcript quantification [73].
Sequencing Technology-Specific Biases
Short-Read vs. Long-Read Sequencing Platforms
The evolution of sequencing technologies has introduced platform-specific biases that interact with library preparation methods:
Table 2: Sequencing Platform Comparison and Associated Biases
| Sequencing Approach | Read Characteristics | Advantages | Technical Biases | Suitable Applications |
|---|---|---|---|---|
| Short-Read Illumina | 50-300 bp, high accuracy | Cost-effective, high throughput, well-established | 3' bias, GC content bias, limited isoform resolution | Gene expression quantification, differential expression |
| Nanopore Direct RNA | Full-length, direct RNA sequencing | Detects modifications, no RT or amplification bias | Higher error rate, throughput limitations | Isoform discovery, RNA modification analysis [70] |
| Nanopore cDNA | Full-length cDNA, amplification-free | High throughput, reduced amplification bias | Reverse transcription bias, still requires cDNA synthesis | Comprehensive transcriptome characterization [70] |
| PacBio Iso-Seq | Full-length cDNA, high accuracy | Excellent isoform resolution, low false positive rate | Lower throughput, higher input requirements, cost | Annotation, novel isoform discovery [70] |
The Singapore Nanopore Expression (SG-NEx) project conducted a systematic benchmark of Nanopore long-read RNA sequencing, demonstrating that long-read technologies more robustly identify major isoforms compared to short-read approaches [70]. However, each platform exhibits distinct bias profiles that must be considered in experimental design.
Reverse Transcription and Molecular Conversion Biases
The conversion of RNA to sequencing-compatible DNA libraries introduces multiple potential biases:
Primer Binding Bias: Random hexamer primers used in reverse transcription exhibit non-random binding preferences, potentially underrepresenting specific transcript regions [75]. This bias can be addressed through a read count reweighing scheme that adjusts for the bias and makes the distribution of reads more uniform [75].
Template-Switching Artifacts: Reverse transcriptases may generate chimeric sequences through template switching, particularly problematic in isoform quantification.
Degradation Bias: In partially degraded samples (e.g., FFPE tissues), RNA integrity influences representation, with better-preserved fragments overrepresented in final libraries [75]. Using random priming instead of oligo-dT for degraded samples helps mitigate 3' bias [75].
Experimental Protocols for Bias Mitigation
Optimized Library Preparation Protocol for mRNA Sequencing
The following detailed protocol minimizes technical artifacts in mRNA sequencing:
RNA Quality Assessment: Verify RNA Integrity Number (RIN) > 8.0 using Bioanalyzer or TapeStation. For degraded samples (RIN < 7), consider total RNA with rRNA depletion instead of poly-A selection.
Poly-A Enrichment: Use magnetic oligo-dT beads with strict washing conditions to minimize rRNA contamination. Include RNA spike-ins (e.g., ERCC) to monitor enrichment efficiency.
Fragmentation Optimization: Employ metal-ion based fragmentation at elevated temperature (94°C for 5-15 minutes) to achieve desired fragment distribution (200-300 bp). Avoid enzymatic fragmentation methods that may introduce sequence bias.
Reverse Transcription: Use high-temperature reverse transcription (50-55°C) with locked nucleic acid (LNA) enhanced random hexamers to improve priming uniformity and reduce secondary structure bias.
Adapter Ligation: Implement UMI-containing adapters using T4 DNA ligase with extended incubation (30 minutes at room temperature) and precise adapter:insert molar ratios (typically 10:1) to minimize dimer formation.
Library Amplification: Limit PCR cycles (8-12 cycles) using high-fidelity polymerases with proofreading activity. Include qPCR monitoring to determine minimal cycles required while maintaining library complexity.
Size Selection and Cleanup: Perform double-sided bead-based size selection (e.g., 0.6x followed by 0.8x AMPure XP ratios) to remove primer dimers and large fragments while retaining optimal insert sizes.
Optimized Protocol for Total RNA Sequencing
The total RNA sequencing protocol differs in critical aspects to maximize non-coding RNA recovery:
rRNA Depletion: Use probe-based ribosomal RNA removal systems (e.g., Ribo-Zero) with increased incubation times and optimized probe ratios to maximize depletion efficiency across diverse RNA classes.
RNA Fragmentation: Adjust fragmentation conditions to accommodate broader size distribution of non-coding RNAs, using slightly milder conditions (94°C for 3-8 minutes) to preserve smaller RNA species.
Adapter Ligation Modifications: For small RNA inclusion, use T4 RNA ligase without fragmentation, employing pre-adenylated adapters and PEG enhancers to improve ligation efficiency for non-canonical RNA structures.
Amplification Considerations: Increase PCR cycles slightly (12-15 cycles) to compensate for lower starting material after rRNA depletion, while monitoring for over-amplification artifacts.
Quality Control: Include Bioanalyzer traces to verify broad size distribution (50-6000 nt) and assess small RNA recovery specifically.
mRNA vs. Total RNA Sequencing Workflows
Diagram 1: mRNA vs Total RNA Sequencing Workflows and Bias Sources. This diagram illustrates the key procedural differences between the two main RNA sequencing approaches and highlights where specific technical biases are introduced at each step of library preparation.
Diagram 2: Comprehensive Overview of Bias Sources Across the RNA Sequencing Workflow. This diagram categorizes technical artifacts according to their point of introduction throughout the experimental pipeline, from sample preparation through data analysis.
The Scientist's Toolkit: Essential Reagents and Solutions
Table 3: Key Research Reagent Solutions for Bias-Reduced Library Preparation
| Reagent Category | Specific Examples | Function | Bias Mitigation Role |
|---|---|---|---|
| RNA Stabilization | RNAlater, PAXgene | Preserve RNA integrity post-collection | Minimizes degradation bias, maintains accurate transcript abundance [75] |
| rRNA Depletion Kits | Ribo-Zero Plus, NEBNext rRNA Depletion | Remove ribosomal RNA from total RNA | Enables comprehensive transcriptome coverage beyond mRNA [73] |
| High-Fidelity Enzymes | Kapa HiFi Polymerase, SuperScript IV | cDNA synthesis and library amplification | Reduces PCR errors and amplification bias [75] |
| UMI Adapters | IDT for Illumina UMI Adapters, NEBNext Multiplex Oligos | Unique molecular identifier incorporation | Enables computational correction of PCR duplicates and amplification bias [73] |
| Fragmentation Systems | Covaris AFA, Bioruptor | Controlled DNA shearing | Provides unbiased fragmentation compared to enzymatic methods [74] |
| Size Selection Beads | AMPure XP, SPRIselect | Fragment size selection | Removes adapter dimers and optimizes insert size distribution [72] |
| Quality Control Kits | Agilent Bioanalyzer, Qubit dsDNA HS Assay | Library quantification and qualification | Ensures optimal library stoichiometry and minimizes sequencing failures [72] |
| Spike-in Controls | ERCC RNA Spike-In Mix, SIRVs | External RNA controls | Monitors technical performance and enables normalization [70] |
Mitigating technical artifacts in library preparation and sequencing requires a comprehensive strategy addressing each step of the experimental workflow. The choice between mRNA and total RNA sequencing represents a fundamental decision with cascading effects on transcriptome coverage and potential biases. While mRNA sequencing provides focused, cost-effective profiling of protein-coding genes, total RNA sequencing enabled by rRNA depletion offers a more comprehensive view of the transcriptome, including non-coding RNAs that play critical roles in cellular regulation [73].
Successful bias mitigation employs multiple complementary approaches: optimized fragmentation methods like acoustic shearing to reduce sequence-specific bias [74], minimal PCR amplification with high-fidelity enzymes to maintain library complexity [75], UMI incorporation to correct for amplification artifacts [73], and comprehensive quality control throughout the workflow [72]. Furthermore, the integration of spike-in controls provides essential quality metrics and normalization standards [70].
As sequencing technologies continue to evolve, with long-read platforms offering improved isoform resolution [70], the principles of rigorous bias management remain constant. By implementing these systematic approaches to identify and mitigate technical artifacts, researchers can generate more reliable, reproducible transcriptomic data capable of driving meaningful biological insights and therapeutic development.
In the era of precision medicine, next-generation sequencing (NGS) has become a cornerstone of biological research and drug development. However, the reliability of any RNA sequencing (RNA-seq) study—whether using mRNA-seq or total RNA-seq approaches—is fundamentally constrained by the quality of its foundational maps: the reference genome and its gene annotation. These reference materials determine the upper limits of what can be discovered, influencing everything from read mapping accuracy to transcript quantification reliability. Within bulk RNA research, the choice between mRNA and total RNA sequencing carries distinct implications for how these reference quality limitations manifest. This technical guide examines how genome reference quality directly impacts analytical outcomes in bulk RNA-seq, providing frameworks for evaluation and strategic experimental design to mitigate these effects in pharmaceutical and clinical research.
Reference Genome Quality: The Foundation of Mapping
The reference genome serves as the coordinate system for aligning sequencing reads. Its quality directly determines mapping efficiency and accuracy, impacting all downstream analyses. Key quality metrics include contiguity (N50, scaffold lengths), completeness (BUSCO scores), and complexity (repeat element content) [76].
Quantitative Metrics for Genome Assessment
Benchmark studies across 114 species have identified effective indicators for evaluating reference genome quality. These metrics help researchers understand technological boundaries in each species [76].
Table 1: Key Metrics for Evaluating Reference Genome Quality
| Metric Category | Specific Metric | Impact on RNA-Seq Analysis |
|---|---|---|
| Contiguity | N50 length, number of scaffolds | Higher contiguity improves mapping accuracy and reduces ambiguous alignments |
| Completeness | BUSCO completeness score | Measures presence of universal single-copy orthologs; higher scores indicate more complete gene space |
| Complexity | Repeat element percentage, tandem repeat frequency | High repeat content increases multi-mapping reads, complicating unique transcript assignment |
| Alignment-based | Overall mapping rate, unique mapping rate | Directly measured from RNA-seq data; indicates practical usability |
Practical Implications for Bulk RNA-Seq
In bulk RNA-seq experiments, reference genome quality directly influences data quality and interpretability:
- Low-quality genomes with fragmented assemblies or inaccuracies cause reduced mapping rates, increased multi-mapped reads, and higher apparent "noise" in gene expression measurements [76].
- High repeat content particularly challenges total RNA-seq protocols that capture non-polyadenylated transcripts, as repetitive elements are more prevalent in non-coding RNAs [76].
- For evolutionary studies or work with non-model organisms, these effects are magnified, potentially confounding cross-species comparisons [76].
Gene Annotation Quality: Determining Quantification Accuracy
Gene annotation defines the coordinates and structures of transcripts within the reference genome. Its quality directly controls the accuracy of transcript identification and quantification—a critical consideration for both mRNA and total RNA sequencing approaches.
Annotation Quality Assessment Framework
Systematic evaluation of gene annotations requires specialized metrics that reflect their practical use in RNA-seq analysis [76]:
Table 2: Gene Annotation Quality Assessment Framework
| Assessment Method | Key Metrics | Interpretation |
|---|---|---|
| Transcript Diversity | Proportion of protein-coding vs. non-coding genes, isoform representation | Higher diversity indicates more comprehensive annotation |
| Quantification Success Rate | Percentage of uniquely quantifiable reads, ambiguity rates | Measures practical utility for expression analysis |
| Comparative Annotation | Ortholog comparison with closely related species | Identifies potential missing annotations |
| Experimental Validation | RT-PCR validation rates for predicted isoforms | Confirms biological relevance of annotated transcripts |
Impact on mRNA vs. Total RNA Sequencing
Annotation quality affects mRNA and total RNA sequencing differently:
- mRNA-seq primarily depends on accurate annotation of protein-coding genes and their isoforms. Incomplete annotation leads to underestimation of expression levels for missing genes.
- Total RNA-seq captures both coding and non-coding RNAs, making it more vulnerable to annotation gaps for non-coding RNA species (e.g., lncRNAs, snRNAs, miRNAs) [51].
- In drug discovery contexts, poor annotation of specific gene families (e.g., metabolic enzymes, transporters, or drug targets) can directly impact target identification and validation studies [77].
Figure 1: RNA-Seq Workflow and Reference Quality Impact Points
Integrated DNA-RNA Sequencing: Enhancing Detection Capabilities
Combining whole exome sequencing (WES) with RNA-seq from a single tumor sample substantially improves detection of clinically relevant alterations in cancer. Integrated approaches enable direct correlation of somatic alterations with gene expression profiles and recover variants missed by DNA-only testing [78].
Validation of Combined Assays
Robust validation frameworks for integrated RNA-DNA sequencing include:
- Analytical validation using custom reference samples containing thousands of variants (e.g., 3,042 SNVs and 47,466 CNVs) across multiple sequencing runs [78].
- Orthogonal testing with patient samples to verify clinical reproducibility [78].
- Clinical utility assessment in real-world cohorts to demonstrate improved detection of actionable alterations [78].
Practical Benefits in Research Applications
Applied to 2,230 clinical tumor samples, the combined RNA-DNA approach demonstrated significant advantages:
- Improved fusion detection through RNA-seq complementing DNA-based findings [78].
- Recovery of variants missed by DNA-only approaches, particularly in low-coverage regions [78].
- Uncovering complex genomic rearrangements that would likely remain undetected without RNA data [78].
- Revealing allele-specific expression of oncogenic drivers through correlation of somatic variants with expression profiles [78].
Experimental Design for Robust Results
Careful experimental design is crucial for generating meaningful RNA-seq data, particularly when reference materials have inherent limitations. This is especially critical in drug discovery pipelines where decisions have significant resource implications [77].
Sample Size and Replication Strategy
Appropriate replication is essential for reliable results:
- Biological replicates (independent samples for the same experimental condition) account for natural variation between individuals, tissues, or cell populations [77].
- Technical replicates (same biological sample measured multiple times) assess technical variation from sequencing runs and laboratory workflows [77].
- Minimum recommendations: At least 3 biological replicates per condition, with 4-8 replicates preferred for increased reliability, especially when variability is high [77].
Table 3: Replication Strategies for RNA-Seq Experiments
| Replicate Type | Purpose | Example | When to Use |
|---|---|---|---|
| Biological Replicates | Assess biological variability | 3 different animals or cell samples in each experimental group | Always included to ensure findings are generalizable |
| Technical Replicates | Assess technical variation | 3 separate RNA sequencing experiments for the same RNA sample | When validating new protocols or assessing technical noise |
| Pilot Studies | Determine appropriate sample size | Small-scale experiment to assess variability before main study | When biological variability is unknown or resources are limited |
Platform and Protocol Selection
The choice between mRNA and total RNA sequencing depends on research objectives:
- mRNA sequencing is optimal for protein-coding gene expression analysis, differential expression studies, and pathway analysis [35].
- Total RNA sequencing enables comprehensive transcriptome characterization, including non-coding RNAs, and is less susceptible to RNA integrity biases [51].
- 3' mRNA-seq methods (e.g., QuantSeq) are cost-effective for large-scale drug screens focusing on gene expression patterns or pathways, allowing library preparation directly from lysates [77].
Figure 2: Experimental Design Decision Framework for Bulk RNA-Seq
The Scientist's Toolkit: Essential Research Materials
Successful RNA-seq experiments require carefully selected reagents and computational tools. The following table details essential materials for conducting robust bulk RNA-seq studies in drug discovery contexts.
Table 4: Essential Research Reagents and Solutions for RNA-Seq Experiments
| Category | Specific Product/Kit | Function in RNA-Seq Workflow |
|---|---|---|
| Nucleic Acid Isolation | AllPrep DNA/RNA Mini Kit (Qiagen) | Simultaneous extraction of DNA and RNA from same sample [78] |
| RNA Extraction | Various specialized kits for blood, FFPE, cells | Isolate high-quality RNA; protocol depends on sample type [77] |
| Library Preparation | TruSeq stranded mRNA kit (Illumina) | mRNA library construction with strand specificity [78] |
| Library Preparation | SureSelect XTHS2 RNA kit (Agilent) | Library construction from FFPE tissue samples [78] |
| Exome Capture | SureSelect Human All Exon V7 + UTR (Agilent) | Target enrichment for exome sequencing [78] |
| Quality Control | TapeStation 4200 (Agilent) | Assess RNA integrity and library quality [78] |
| Spike-in Controls | SIRVs (Spike-in RNA Variants) | Internal standards for quantification accuracy and technical variability assessment [77] |
Genome reference and annotation quality fundamentally constrains the validity and interpretability of bulk RNA-seq results. These limitations manifest differently in mRNA versus total RNA sequencing approaches, with implications for study design and analytical choices. As drug discovery increasingly relies on transcriptomic profiling, understanding these foundational dependencies becomes essential for generating clinically actionable insights. By adopting rigorous validation frameworks, strategic experimental designs, and appropriate analytical corrections, researchers can mitigate reference-related biases and maximize the translational potential of their RNA-seq data.
Benchmarking and Integration: Validating Findings and Leveraging Complementary Technologies
Within the context of bulk RNA sequencing research, the choice between mRNA sequencing (mRNA-Seq) and total RNA sequencing (Total RNA-Seq) is a fundamental experimental design decision. This technical guide provides an in-depth performance benchmarking of these two predominant approaches, focusing on their sensitivity, false discovery rates, and detection concordance. The ability to accurately detect and quantify gene expression is paramount for researchers and drug development professionals who rely on these technologies for biomarker discovery, therapeutic target identification, and mode-of-action studies. By synthesizing current data and methodologies, this review aims to equip scientists with the evidence needed to select the optimal transcriptomic profiling strategy for their specific research objectives.
Key Performance Metrics in RNA-Seq Technologies
The performance of mRNA-Seq and Total RNA-Seq can be evaluated through several critical metrics that directly impact data quality and biological interpretation.
Sensitivity and Dynamic Range
Sensitivity in RNA-Seq refers to the method's ability to detect low-abundance transcripts. mRNA-Seq, which focuses sequencing reads on protein-coding genes, typically provides superior sensitivity for mRNA molecules due to its enrichment strategy. By selectively capturing polyadenylated RNAs, mRNA-Seq concentrates sequencing power on a smaller subset of the transcriptome, resulting in higher sequencing depth for coding genes and improved detection of lowly-expressed mRNAs [4]. This comes at the expense of excluding non-polyadenylated non-coding RNAs from analysis.
Total RNA-Seq offers a comprehensive view of the transcriptome by capturing both coding and non-coding RNA species after ribosomal RNA (rRNA) depletion. This provides a more complete picture of transcriptional activity but distributes sequencing reads across a wider array of RNA types. Consequently, for a given sequencing depth, Total RNA-Seq may demonstrate reduced sensitivity for individual mRNA transcripts compared to mRNA-Seq [4] [9]. The dynamic range of RNA-Seq technologies substantially exceeds that of microarray platforms, with RNA-Seq demonstrating a detection range of approximately 5 orders of magnitude compared to 3-4 orders of magnitude for microarrays [79] [80].
False Discovery Rates and Specificity
False discovery rates (FDR) in RNA-Seq can arise from multiple sources, including technical artifacts during library preparation, sequencing errors, and bioinformatic misalignment. Targeted RNA-Seq approaches have demonstrated capabilities for controlling false positive rates while maintaining high sensitivity when appropriate bioinformatic parameters are implemented [81].
In one comprehensive assessment of RNA-Seq accuracy, rigorous quality control measures and pipeline optimization were shown to be critical for minimizing false positives. The SEQC consortium found that with proper filtering and analysis, RNA-Seq can achieve high reproducibility across laboratories and platforms [79]. Specificity challenges can emerge in Total RNA-Seq due to the detection of overlapping transcriptional regions; approximately 20% of human genes are transcribed from both strands, creating overlapping regions that require strand-specific methods to accurately assign reads to their correct transcriptional origin [4].
Detection Concordance Between Platforms
Studies comparing RNA-Seq technologies have revealed both concordance and divergence in transcript detection. When comparing mRNA-Seq and Total RNA-Seq, there is generally high agreement in protein-coding gene expression measurements for moderately to highly expressed transcripts [3]. However, significant differences emerge in the detection of non-coding RNAs, novel transcripts, and splice variants that are exclusively captured by Total RNA-Seq approaches [4] [9].
Comparative analyses between RNA-Seq and microarray technologies have shown that while RNA-Seq detects a larger number of differentially expressed genes with wider dynamic range, the biological conclusions drawn from pathway and enrichment analyses are often highly consistent between platforms [80]. This suggests that for many applications, the choice of platform may not substantially alter the core biological interpretations, though RNA-Seq provides additional layers of transcriptomic information.
Table 1: Comparative Performance of mRNA-Seq vs. Total RNA-Seq
| Performance Metric | mRNA-Seq | Total RNA-Seq |
|---|---|---|
| Target Transcripts | Polyadenylated mRNA only | Coding + non-coding RNA (including lncRNA, miRNA) |
| Typical Sequencing Depth | 25-50 million reads/sample [4] | 100-200 million reads/sample [4] |
| Sensitivity for mRNA | High (due to enrichment) | Moderate (broader target distribution) |
| Non-Coding RNA Detection | Limited | Comprehensive |
| rRNA Depletion Required | No (polyA selection used) | Yes (rRNA constitutes 80-90% of total RNA) [4] |
| Ability to Detect Novel Features | Limited to polyadenylated transcripts | Extensive (novel isoforms, non-coding RNAs) |
| Strandedness Information | Optional | Required for accurate annotation of overlapping genes [4] |
Experimental Protocols for Performance Assessment
Robust benchmarking of RNA-Seq methods requires carefully controlled experimental designs and standardized analysis pipelines to ensure meaningful comparisons.
Reference Sample Designs
High-quality benchmarking studies employ reference samples with established "ground truth" characteristics. The Sequencing Quality Control (SEQC) consortium utilized well-characterized reference RNA samples (Universal Human Reference RNA and Human Brain Reference RNA) spiked with synthetic RNA controls from the External RNA Control Consortium (ERCC) [79]. These samples were mixed in known ratios (3:1 and 1:3) to create samples with predetermined expression differences, enabling objective assessment of detection accuracy and differential expression performance.
The use of spike-in controls is particularly valuable for quantifying sensitivity limits and technical variation. These synthetic RNAs, added at known concentrations across samples, provide an internal standard for evaluating detection thresholds, accuracy of fold-change measurements, and normalization efficacy [79]. This approach allows researchers to distinguish technical artifacts from biological signals and establish quantitative performance metrics across different sequencing methods.
Library Preparation Methodologies
Substantial technical differences exist between mRNA-Seq and Total RNA-Seq library preparation protocols, directly impacting performance outcomes.
The mRNA-Seq workflow typically involves poly(A) selection using oligo(dT) magnetic beads to enrich for polyadenylated transcripts, followed by RNA fragmentation, reverse transcription, and adapter ligation [3] [80]. The 3' mRNA-Seq methods such as QuantSeq further streamline this process by generating one fragment per transcript through initial oligo(dT) priming, significantly simplifying both library preparation and subsequent data analysis [3].
For Total RNA-Seq, the standard approach involves ribosomal RNA depletion using species-specific probes, followed by RNA fragmentation and library construction. The removal of rRNA is crucial as it constitutes 80-90% of total RNA [4]. Methods such as Prime-seq have implemented early barcoding and unique molecular identifiers (UMIs) to enhance cost efficiency and reduce PCR amplification biases [82]. The Prime-seq protocol has been validated across multiple studies and organisms, demonstrating robust detection of over 20,000 genes per sample with approximately 70% of reads mapping to exonic and intronic regions [82].
Bioinformatic Processing and Analysis
Bioinformatic pipelines significantly influence performance metrics in RNA-Seq comparisons. The SEQC project evaluated multiple analysis pipelines and demonstrated that the choice of alignment tools, reference annotations, and quantification methods substantially impacts gene detection, junction discovery, and differential expression results [79].
For splice junction detection, performance varies considerably among analysis tools. In comparative assessments, different pipelines reported millions of junctions, with only approximately 32% of previously unannotated splice junctions consistently predicted across all methods [79]. This highlights the importance of using multiple, complementary analysis approaches and orthogonal validation for novel transcript discovery.
The selection of reference annotations also dramatically affects mapping rates and gene detection. In the SEQC study, AceView annotations captured 97.1% of mappable reads compared to 85.9% for RefSeq and 92.9% for GENCODE [79]. These differences substantially impact sensitivity calculations and detection concordance between methodologies.
Table 2: Key Reagent Solutions for RNA-Seq Benchmarking
| Reagent/Category | Specific Examples | Function in Experiment |
|---|---|---|
| Poly(A) Selection Kits | Illumina Stranded mRNA Prep, Lexogen QuantSeq | Enrichment of polyadenylated RNA for mRNA-Seq |
| rRNA Depletion Kits | Illumina Ribo-Zero, QIAseq FastSelect | Removal of abundant ribosomal RNA for Total RNA-Seq |
| Spike-In Controls | ERCC RNA Spike-In Mix, SIRVs | Quality control and normalization standards |
| Library Prep Kits | TruSeq, NEBNext, Prime-seq | Construction of sequencing-ready libraries |
| Reverse Transcriptases | MMLV, SmartScribe | cDNA synthesis from RNA templates |
| UMI Adapters | 10x Barcodes, Custom UMIs | Molecular counting and duplicate removal |
Visualization of RNA-Seq Experimental Workflows
The following diagrams illustrate key experimental workflows and decision pathways for selecting and implementing RNA-Seq methodologies.
Bulk RNA-Seq Method Selection and Workflow
Performance Trade-offs in RNA-Seq Methodologies
Discussion and Best Practice Recommendations
Context-Dependent Method Selection
The choice between mRNA-Seq and Total RNA-Seq should be driven by specific research questions and experimental constraints. For focused gene expression studies where the primary goal is quantifying differential expression of protein-coding genes, mRNA-Seq provides a cost-effective solution with superior sensitivity for coding transcripts [4] [3]. This approach is particularly advantageous for large-scale screening studies where many samples need to be processed within budget constraints.
For exploratory transcriptome studies aimed at discovering novel biomarkers, non-coding RNAs, or splicing variants, Total RNA-Seq offers unparalleled comprehensiveity [4] [9]. The ability to capture both coding and non-coding RNA species makes it ideal for biobank projects, disease mechanism studies, and when investigating poorly characterized biological systems. The inclusion of non-coding RNAs can provide critical insights into regulatory networks underlying disease states and therapeutic responses.
Emerging Methods and Future Directions
Recent methodological advances are blurring the traditional distinctions between RNA-Seq approaches. Early barcoding methods like Prime-seq combine the cost efficiency of 3' sequencing with enhanced sensitivity through unique molecular identifiers (UMIs) [82]. These approaches demonstrate that optimized protocols can achieve performance comparable to standard methods at significantly reduced costs, making larger-scale studies with better statistical power more accessible.
Targeted RNA-Seq panels represent another emerging trend, particularly in clinical applications. These panels focus sequencing power on genes of clinical relevance, enabling high-sensitivity detection of expressed mutations and fusion transcripts that might be missed by broader approaches [81]. As demonstrated in oncology applications, targeted RNA-Seq can identify clinically actionable mutations with high accuracy, complementing DNA-based mutation screening.
Recommendations for Performance Optimization
To maximize data quality and biological insights from RNA-Seq experiments, researchers should:
- Implement spike-in controls for normalized quality assessment and cross-platform comparisons [79]
- Select appropriate sequencing depths based on methodological choice (25-50M reads for mRNA-Seq; 100-200M reads for Total RNA-Seq) [4]
- Utilize strand-specific protocols when working with Total RNA-Seq to accurately assign reads to their correct transcriptional origin [4]
- Apply multiple bioinformatic pipelines for novel transcript discovery, as concordance between methods significantly increases validation rates [79]
- Consider sample-specific factors such as RNA quality, input material, and expected transcriptome complexity when selecting the appropriate method [4] [3]
As RNA-Seq technologies continue to evolve, the distinction between mRNA-Seq and Total RNA-Seq is likely to further blur with the development of hybrid approaches that optimize both cost-efficiency and comprehensiveness. The ongoing reduction in sequencing costs will make deeper transcriptome coverage more accessible, potentially shifting the balance toward more comprehensive approaches even for focused research questions.
In the context of mRNA sequencing research, scientists must choose between two fundamental approaches that offer dramatically different resolutions: bulk RNA sequencing (bulk RNA-seq) and single-cell RNA sequencing (scRNA-seq). Bulk RNA-seq provides a population-average gene expression profile from an entire tissue sample, effectively blending signals from all constituent cells [35] [83]. In contrast, scRNA-seq captures the transcriptome of individual cells, enabling researchers to resolve cellular heterogeneity and identify rare cell populations that are masked in bulk analyses [84] [85]. This technical guide examines these complementary methodologies, their experimental protocols, applications, and how their integration advances biomedical research and drug development.
Fundamental Technical Principles and Comparisons
Core Methodological Differences
Bulk RNA-seq analyzes RNA extracted from thousands to millions of cells simultaneously, generating an averaged expression profile for the entire cell population [35] [86]. The methodology involves tissue digestion, RNA extraction, cDNA conversion, and sequencing library preparation from the pooled RNA [35]. This approach is comparable to observing a forest from a distance, seeing the overall structure but missing individual tree characteristics.
Single-cell RNA-seq employs fundamentally different sample preparation, beginning with creating viable single-cell suspensions through enzymatic or mechanical dissociation [35] [84]. Critical quality control steps ensure appropriate cell concentration, viability, and absence of clumps or debris [35]. Instead of bulk processing, scRNA-seq partitions individual cells using microfluidic systems like the 10x Genomics Chromium platform, which isolates cells into gel bead-in-emulsion (GEM) reactions where cell-specific barcodes are added to all transcripts from each cell [35]. This barcoding enables tracing analytes back to their cell of origin after sequencing [35].
Comparative Analysis of Technical Specifications
Table 1: Technical Comparison of Bulk RNA-seq vs. Single-Cell RNA-seq
| Parameter | Bulk RNA-seq | Single-Cell RNA-seq |
|---|---|---|
| Resolution | Population average | Single-cell level |
| Sample Input | Pooled cell populations | Individual cells (100s to 1,000,000s) |
| Key Applications | Differential gene expression between conditions, transcriptome annotation, alternative splicing analysis [35] [85] | Cell type identification, cellular heterogeneity analysis, developmental trajectory reconstruction, tumor microenvironment characterization [35] [85] |
| Cost Considerations | Lower cost per sample [35] [86] | Higher cost per sample, but decreasing with new technologies [35] |
| Data Complexity | Lower complexity, established analytical pipelines [35] [86] | High-dimensional data, requires specialized bioinformatics expertise [35] [84] |
| Throughput | Suitable for large cohort studies [35] | Rapidly improving with high-throughput methods like GEM-X Flex [35] |
| Limitations | Masks cellular heterogeneity and rare cell types [35] [83] | Gene dropout effect for low-abundance transcripts, sample preparation challenges [35] [87] |
Experimental Workflows and Methodologies
Bulk RNA-seq Experimental Protocol
The bulk RNA-seq workflow follows a relatively straightforward path [35]:
- Sample Collection: Biological samples are collected and preserved
- RNA Extraction: Total RNA is extracted from the entire tissue or cell population, with optional enrichment for mRNA or ribosomal RNA depletion
- Library Preparation: RNA is converted to cDNA and processed into sequencing-ready libraries
- Sequencing & Analysis: Libraries are sequenced, and data analysis reveals average gene expression profiles across the sample
This protocol generates data suitable for identifying differentially expressed genes between conditions (e.g., diseased vs. healthy, treated vs. control), discovering biomarkers, and investigating pathway-level changes [35].
Single-Cell RNA-seq Experimental Protocol
The scRNA-seq workflow incorporates additional complexity to preserve single-cell resolution [35] [84]:
- Single-Cell Suspension: Tissues are dissociated into viable single-cell suspensions using enzymatic or mechanical methods
- Cell Partitioning: Single cells are isolated into micro-reaction vessels (e.g., GEMs) using microfluidic systems
- Cell Barcoding: Gel beads dissolve, releasing barcoded oligos that label all RNA from each cell
- Library Preparation & Sequencing: Barcoded products create sequencing libraries, enabling gene expression measurement per cell
This protocol requires careful quality control throughout, focusing on cell viability, absence of doublets, and mitochondrial content [84] [88]. Specialized methods like single-nuclei RNA sequencing (snRNA-seq) enable work with frozen samples, advantageous for clinical applications [84].
Analytical Approaches and Bioinformatics
Bulk RNA-seq Data Analysis
Bulk RNA-seq analysis employs established bioinformatics pipelines focusing on:
- Differential Expression: Identifying genes with significant expression changes between conditions using tools like DESeq2 or edgeR
- Pathway Analysis: Determining biological pathways enriched in specific conditions
- Alternative Splicing Detection: Identifying differentially spliced transcripts
- Biomarker Discovery: Finding gene signatures correlated with clinical outcomes
Single-Cell RNA-seq Data Analysis
scRNA-seq data analysis presents unique computational challenges and requires specialized approaches [84] [88]:
- Quality Control: Filtering low-quality cells based on detected genes, library size, and mitochondrial content
- Dimensionality Reduction: Using PCA, t-SNE, or UMAP to visualize high-dimensional data
- Cell Clustering: Identifying cell populations based on transcriptome similarities
- Cell Type Annotation: Labeling clusters using known marker genes
- Trajectory Inference: Reconstructing developmental or differentiation pathways
- Differential Expression: Identifying genes varying between subpopulations or conditions
Table 2: Essential Research Reagents and Platforms
| Reagent/Platform | Function | Application Context |
|---|---|---|
| 10x Genomics Chromium | Microfluidic partitioning system for single-cell barcoding | High-throughput scRNA-seq [35] [89] |
| Cell Hashing Antibodies | Antibody-oligonucleotide conjugates for sample multiplexing | Allows pooling multiple samples in one scRNA-seq run [90] |
| Demonstrated Protocols | Optimized sample preparation methods | Ensuring experimental reproducibility [35] |
| Seurat Package | Comprehensive scRNA-seq analysis toolkit | Data integration, clustering, and visualization [84] [88] |
| Harmony Algorithm | Batch effect correction tool | Integrating datasets from different experiments [88] |
| Monocle3 | Trajectory inference software | Reconstructing cellular differentiation paths [88] |
Integrated Analysis Strategies
Combining Bulk and Single-Cell Approaches
The most powerful applications emerge from integrating bulk and single-cell approaches, as demonstrated in a rheumatoid arthritis (RA) study [88]. Researchers combined scRNA-seq and bulk RNA-seq to investigate macrophage heterogeneity in RA synovial tissue, identifying STAT1 as a key regulator in pro-inflammatory macrophages through these steps:
- scRNA-seq Analysis: Revealed macrophage heterogeneity and identified STAT1+ macrophage subpopulation
- Bulk RNA-seq Validation: Confirmed STAT1 upregulation in RA samples
- Functional Experiments: Established STAT1's role in modulating autophagy and ferroptosis pathways
- Therapeutic Testing: Demonstrated that fludarabine (STAT1 inhibitor) reversed pathogenic changes
This integrated approach provided both cellular-resolution discovery (scRNA-seq) and population-level validation (bulk RNA-seq), offering a comprehensive disease mechanism understanding.
Advanced Applications in Drug Discovery
scRNA-seq transforms drug discovery through high-throughput pharmacotranscriptomic profiling [91] [90]. A 2025 Nature Chemical Biology study established a multiplexed scRNA-seq pipeline screening 45 drugs across 13 mechanism-of-action classes in high-grade serous ovarian cancer models [90]. This approach:
- Profiled drug responses at single-cell resolution in primary patient-derived cells
- Identified resistance mechanisms, including PI3K-AKT-mTOR inhibitor-induced EGFR activation mediated by caveolin-1 upregulation
- Revealed synergistic drug combinations to overcome resistance
- Created a resource for investigating drug-perturbed phenotypes at single-cell level
Bulk and single-cell RNA sequencing offer complementary approaches to transcriptome analysis, each with distinct strengths and applications. Bulk RNA-seq remains valuable for population-level studies, differential expression analysis in large cohorts, and applications where average expression profiles suffice [35] [86]. Single-cell RNA-seq enables unprecedented resolution of cellular heterogeneity, discovery of rare cell types, and reconstruction of developmental trajectories [35] [84]. The integration of both approaches, along with emerging spatial transcriptomics and multi-omics technologies, provides a powerful framework for advancing biological understanding and therapeutic development [84] [83]. As methodologies evolve and costs decrease, these technologies will continue transforming precision medicine and drug discovery landscapes.
In the evolving landscape of transcriptomics, the debate between mRNA versus total RNA sequencing in bulk research often centers on balancing comprehensive transcriptome coverage with practical experimental considerations. While bulk RNA sequencing (bulk RNA-seq) provides a population-averaged gene expression profile, single-cell RNA sequencing (scRNA-seq) resolves cellular heterogeneity but may miss low-abundance transcripts [35] [83]. This case study examines an integrated analytical approach that leverages the complementary strengths of both methodologies, using a groundbreaking study on the C. elegans nervous system as a paradigm for disease research. The integrated approach preserves the specificity of scRNA-seq data while incorporating the sensitivity of bulk RNA-seq to detect lowly expressed and noncoding RNAs, thereby addressing fundamental limitations inherent in using either method in isolation [92].
Experimental Design and Methodologies
Model System and Research Objective
The case study employs the adult C. elegans hermaphrodite nervous system, comprising 302 neurons divided into 118 anatomically distinct types with completely mapped connectivity and lineage [92]. This well-defined system provides an ideal platform for developing integration methodologies with direct relevance to understanding complex mammalian brains and disease states. The primary objective was to generate a refined gene expression atlas for individual neuron classes that captures both high-abundance poly-adenylated transcripts and low-abundance non-polyadenylated species, including noncoding RNAs that may play crucial roles in neuronal fate and function [92].
Bulk RNA-Seq Experimental Protocol
Sample Preparation and Cell Isolation:
- Strain Engineering: Transgenic C. elegans strains expressing fluorophores in specific neuron classes were generated using established laboratory techniques [92].
- Fluorescence-Activated Cell Sorting (FACS): Synchronized L4 stage larvae were dissociated, and labeled neuron types were isolated using a BD FACSAria III equipped with a 70-micron diameter nozzle. DAPI staining (1 mg/mL final concentration) enabled labeling of dead and dying cells for exclusion [92].
- Cell Collection: Sorted cells were collected directly into TRIzol LS reagent, with periodic mixing during the sorting process. Samples were stored at -80°C until RNA extraction [92].
RNA Extraction and Library Preparation:
- RNA Isolation: Chloroform extraction was performed using Phase Lock Gel-Heavy tubes, followed by purification with Zymo-Spin IC columns and wash buffers according to manufacturer protocols [92].
- Quality Control: RNA integrity and yield were assessed using the Agilent 2100 Bioanalyzer Picochip system [92].
- Library Construction: Libraries were prepared using the SoLo Ovation Ultra-Low Input RNaseq kit with modifications for optimal rRNA depletion in C. elegans. The protocol utilized random primers for robust detection of both poly-adenylated and non-coding RNAs, unlike standard poly-A selection methods [92].
- Sequencing: Libraries were sequenced on Illumina Hiseq 2500 or Novaseq6000 platforms with 150 bp paired-end reads [92].
Single-Cell RNA-Seq Experimental Protocol
The complementary scRNA-seq dataset was generated by the CeNGEN project using 10x Genomics technology, which primarily captures poly-adenylated transcripts [92]. This method isolates individual cells through droplet-based partitioning where single cells are encapsulated in oil-based emulsion droplets (GEMs) containing barcoded beads [35]. Within these micro-reactions, cells are lysed, and mRNA is captured and barcoded with cell-specific identifiers before conversion to cDNA and library preparation for sequencing [35].
Computational Integration and Data Analysis
Primary Data Processing:
- Read Alignment: Bulk RNA-seq reads were mapped to the C. elegans reference genome (WormBase version WS289) using STAR (version 2.7.7a) with the option
--outFilterMatchNminOverLread 0.3[92]. - Duplicate Removal: Unique Molecular Identifiers (UMIs) were utilized with UMI-tools (v1.1.4) to remove PCR duplicates [92].
- Quantification: A counts matrix was generated using the featureCounts tool of SubRead (v2.0.3) [92].
- Transgene Masking: To prevent artifacts from transgene transcription, 5kb regions of all genes whose promoters were used in transgenes were masked, removing 231 genes from analysis [92].
Data Integration Methodology: The integration strategy employed the bMIND algorithm, which leverages deconvolution approaches to combine the specificity of scRNA-seq with the sensitivity of bulk RNA-seq [92]. Key steps included:
- Pre-integration Processing: Intra-sample normalization (gene length normalization for bulk samples) was performed before integration, followed by inter-sample normalization (library size normalization) using TMM correction in edgeR after integration [92].
- Ground-Truth Validation: The integrated dataset was validated against a curated set of 160 genes with precisely known neuron-type-specific expression patterns from fosmid fluorescent reporters and CRISPR strains [92].
- Contamination Assessment: A list of 445 genes exclusively expressed outside the nervous system was used to evaluate potential non-neuronal contamination in each sample [92].
- Ubiquitous Expression Analysis: 936 ubiquitously expressed genes identified from scRNA-seq data were used to evaluate gene expression accuracy in the integrated dataset [92].
Table 1: Key Computational Tools and Parameters for Data Integration
| Analysis Step | Tool/Package | Version | Key Parameters/Approaches |
|---|---|---|---|
| Read Alignment | STAR | 2.7.7a | --outFilterMatchNminOverLread 0.3 |
| Duplicate Removal | UMI-tools | 1.1.4 | UMI-based deduplication |
| Read Quantification | featureCounts (SubRead) | 2.0.3 | Default parameters |
| Normalization | edgeR | 4.0.1 | TMM (Trimmed Mean of M-values) |
| Integration Algorithm | bMIND | N/A | Deconvolution-based integration |
| Quality Assessment | FASTQC | N/A | Pre-alignment quality control |
Key Findings and Technical Validation
Enhanced Sensitivity and Specificity
The integrated analysis demonstrated significant improvements in both sensitivity and specificity compared to either method alone. Bulk RNA-seq data successfully captured lowly expressed and noncoding RNAs that were undetected in the scRNA-seq profiles, while scRNA-seq data provided the cellular resolution necessary to identify contamination artifacts in bulk samples [92]. The approach enhanced accurate detection of gene expression and improved differential gene analysis by leveraging the complementary strengths of both datasets [92].
Table 2: Performance Comparison of Sequencing Methodologies
| Parameter | Bulk RNA-seq | scRNA-seq | Integrated Approach |
|---|---|---|---|
| Detection of Low-Abundance Transcripts | High sensitivity | Limited by gene dropout effect | Enhanced sensitivity |
| Identification of Noncoding RNAs | Effective with random primers | Limited to poly-adenylated species | Comprehensive detection |
| Cellular Resolution | No resolution (averaged) | High resolution | Preserved high resolution |
| Contamination Identification | Challenging | Possible through clustering | Enhanced through cross-validation |
| Quantitative Accuracy | High for abundant transcripts | Affected by sparsity | Improved through integration |
Noncoding RNA Profiling
A particularly significant finding was the robust detection of differentially expressed non-coding RNAs across neuron types in the bulk RNA-seq data, including multiple families of non-polyadenylated transcripts that were largely absent from the scRNA-seq dataset [92]. This demonstrates the critical importance of library preparation methods (random primed vs. poly-A selected) in transcriptome coverage, with direct implications for bulk RNA-seq experimental design in disease research.
Validation Against Ground Truth Data
When validated against the ground-truth dataset of 160 genes with known neuron-type-specific expression, the integrated approach showed superior performance in accurately recapitulating established expression patterns compared to either method alone [92]. This validation confirmed that the integration strategy successfully preserved the specificity of scRNA-seq data while incorporating the sensitivity advantages of bulk RNA-seq.
Visualization of Integrated Analytical Workflow
The following diagram illustrates the complete experimental and computational workflow for integrating bulk and single-cell RNA sequencing data:
The Scientist's Toolkit: Essential Research Reagents and Solutions
Table 3: Key Research Reagents and Solutions for Integrated Transcriptomics
| Reagent/Solution | Application | Function | Specific Example |
|---|---|---|---|
| TRIzol LS Reagent | RNA Stabilization | Maintains RNA integrity during cell sorting and storage | Invitrogen TRIzol LS [92] |
| Phase Lock Gel-Heavy Tubes | RNA Extraction | Improves phase separation during chloroform extraction | Quantabio Phase Lock Gel-Heavy [92] |
| Zymo-Spin IC Columns | RNA Purification | Concentrates and purifies RNA after extraction | Zymo Research IC Columns [92] |
| SoLo Ovation Ultra-Low Input RNaseq Kit | Library Preparation | Generates sequencing libraries from low-input RNA | Tecan Genomics SoLo Kit [92] |
| DAPI Stain | Viability Assessment | Labels dead/dying cells for exclusion during FACS | 1 mg/mL final concentration [92] |
| 10x Genomics Chemistry | Single-Cell Partitioning | Enables barcoding and partitioning of single cells | Chromium Single Cell 3' Kit [35] [92] |
| Agilent PicoChip | RNA Quality Control | Assesses RNA integrity and quantity | Agilent 2100 Bioanalyzer PicoChip [92] |
Implications for Disease Research and Therapeutic Development
The integrated analytical approach demonstrated in this case study has significant implications for disease research, particularly in neurological disorders, cancer, and inflammatory conditions where cellular heterogeneity plays a crucial role in pathogenesis. The strategy enables researchers to:
- Identify Novel Therapeutic Targets: By capturing both abundant and rare transcripts across cell types, the method reveals previously overlooked disease mechanisms [92] [10].
- Validate Biomarkers: The combined approach increases confidence in candidate biomarkers by cross-validating findings across complementary methodologies [10].
- Understand Drug Mechanisms: Integrated analysis can pinpoint specific cell populations responding to therapeutics and identify resistance mechanisms [10] [87].
- Bridge Discovery and Clinical Application: The sensitivity of bulk RNA-seq combined with the resolution of scRNA-seq creates a pipeline from initial discovery to clinical translation [10] [87].
This case study exemplifies how the strategic integration of bulk and single-cell transcriptomic approaches can overcome the limitations of either method alone, providing a more comprehensive understanding of biological systems and disease processes. The methodologies outlined here serve as a template for researchers designing similar integrated studies in other model systems and disease contexts.
The field of transcriptomics serves as a fundamental pillar in the advancement of personalized medicine, providing critical insights into gene expression patterns that underlie disease mechanisms and treatment responses. Within this context, the methodological choice between mRNA sequencing and total RNA sequencing represents a crucial strategic decision for researchers investigating bulk samples [4]. mRNA sequencing utilizes poly(A) enrichment to focus specifically on protein-coding genes, offering a cost-effective approach for quantitative gene expression analysis. In contrast, total RNA sequencing employs ribosomal RNA depletion to capture a comprehensive view of both coding and non-coding RNA species, including long non-coding RNAs (lncRNAs) and microRNAs (miRNAs), thereby providing a more complete picture of the transcriptome's regulatory landscape [4] [3].
Recent technological revolutions are dramatically transforming this research landscape. The emergence of long-read sequencing technologies from Pacific Biosciences and Oxford Nanopore Technologies has overcome previous limitations in resolving complex genomic regions and full-length transcript isoforms [93]. Concurrently, artificial intelligence methodologies, particularly machine learning and deep learning, are revolutionizing how researchers analyze complex transcriptomic datasets, enabling the identification of subtle patterns that escape conventional analytical approaches [94]. This whitepaper examines how these converging technologies are shaping the future of bulk RNA sequencing research within personalized medicine, providing researchers and drug development professionals with a technical framework for navigating this rapidly evolving landscape.
Technical Foundations: mRNA vs. Total RNA Sequencing in Bulk Analysis
Methodological Comparison and Selection Criteria
Bulk RNA sequencing remains an essential technique for capturing a comprehensive snapshot of gene expression across cell populations, offering a balance between insight depth and cost efficiency that makes it suitable for large-scale studies [86] [95]. The fundamental distinction between mRNA-seq and total RNA-seq lies in the initial RNA selection and enrichment steps, which dramatically influence the scope and focus of the resulting data.
Table 1: Methodological Comparison Between mRNA-seq and Total RNA-seq for Bulk Analysis
| Parameter | mRNA Sequencing | Total RNA Sequencing |
|---|---|---|
| Enrichment Method | Poly(A) selection | Ribosomal RNA depletion |
| RNA Targets | Protein-coding polyadenylated transcripts | All RNA species (coding and non-coding) |
| Coverage | 3' end-focused or full-length | Distributed across entire transcripts |
| Typical Read Requirements | 25-50 million reads/sample [4] | 100-200 million reads/sample [4] |
| Key Applications | Differential gene expression, biomarker discovery | Alternative splicing, novel isoform detection, non-coding RNA analysis |
| Ideal Sample Types | High-quality RNA, eukaryotic samples | Prokaryotic samples, degraded material (e.g., FFPE) [3] |
| Cost Considerations | Lower sequencing costs [4] | Higher sequencing costs [4] |
| Sensitivity to Degradation | Higher (depends on 3' integrity) | Lower (random priming across transcripts) |
The selection between these approaches must be guided by specific research objectives. mRNA sequencing through poly(A) enrichment is the preferred choice when focusing specifically on protein-coding regions, as it effectively eliminates ribosomal RNA and provides superior gene expression data for this subset of the transcriptome [4]. The process typically requires less starting material and enables more cost-effective sequencing through reduced read requirements, making it ideal for large-scale expression profiling studies [4] [3].
Total RNA sequencing offers a more comprehensive approach by capturing both coding and non-coding RNA species through ribosomal RNA depletion rather than poly(A) selection. This makes it particularly valuable for discovering novel transcripts, analyzing alternative splicing patterns, identifying fusion genes, and studying non-coding RNAs [4] [3]. The method's random priming approach also provides better performance with degraded samples or those with compromised RNA integrity, as it does not rely exclusively on 3' poly(A) tails [3].
Experimental Workflow: From Sample to Data
The core workflow for bulk RNA sequencing shares common steps across both methodologies, with the critical divergence occurring at the library preparation stage. The following diagram illustrates the key decision points in experimental design:
For bulk RNA-seq experiments, the initial RNA extraction and quality control steps are critical, as RNA integrity directly impacts data quality [4]. Following library preparation through either poly(A) selection or rRNA depletion, the resulting cDNA libraries undergo sequencing, with read depth requirements determined by the methodology and research questions [4]. The subsequent data analysis phase leverages established bioinformatics pipelines for read alignment, quantification, and differential expression analysis, with the complexity of analysis increasing with the comprehensiveness of the sequencing approach.
Emerging Technological Innovations
The Transformative Potential of Long-Read Sequencing
Long-read sequencing technologies from Pacific Biosciences and Oxford Nanopore Technologies are revolutionizing transcriptomics by providing unprecedented resolution of complex genomic regions and full-length transcript isoforms [93]. Unlike short-read sequencing, which struggles with repetitive elements and complex genomic regions, long-read technologies offer single-molecule sequencing that captures complete transcripts without fragmentation, enabling direct observation of alternative splicing patterns, fusion events, and precise determination of transcript boundaries [93].
The application of long-read sequencing to bulk RNA samples provides particularly valuable insights for personalized medicine approaches. These technologies enable comprehensive detection of structural variants (SVs), which play crucial roles in disease pathogenesis but have been notoriously difficult to characterize with short-read technologies [93]. Long-read sequencing typically identifies more than twice the number of germline SVs per individual genome compared to short-read approaches, dramatically expanding the variant landscape available for association studies [93]. Additionally, the ability to perform haplotype-resolved sequencing—phasing genetic variants across individual chromosomes—provides critical information for understanding compound heterozygosity and cis-regulatory interactions that influence gene expression [93].
Table 2: Long-Read vs. Short-Read Sequencing for Bulk Analysis
| Characteristic | Long-Read Sequencing | Short-Read Sequencing |
|---|---|---|
| Read Length | Thousands to millions of bases | 50-300 bases |
| SV Detection | Comprehensive for all SV classes | Limited to large copy-number variants |
| Transcript Resolution | Full-length isoform sequencing | Inference required from fragments |
| Phasing Ability | Read-based phasing over long ranges | Limited phasing requiring statistical methods |
| Complex Regions | Direct interrogation of repeats, centromeres, telomeres | Poor performance in repetitive regions |
| Error Rate | Higher per-base error (though improving) | Lower per-base error |
| Cost per Sample | Higher | Lower |
| Ideal Applications | De novo assembly, SV discovery, isoform characterization | Variant calling, expression quantification |
The recent improvements in accuracy and throughput for long-read platforms are making them increasingly viable for population-scale studies [93]. While costs remain higher than short-read sequencing, the SOLVE-RD consortium has demonstrated a 13% improvement in diagnostic yield using long-read sequencing, highlighting its potential clinical value for genetic diagnoses [93]. For bulk transcriptomics, this translates to more complete annotation of transcriptomes and the ability to associate specific full-length isoforms with disease states—critical advancements for personalized therapeutic development.
Artificial Intelligence and Advanced Analytics
Artificial intelligence is dramatically transforming the analysis of bulk RNA sequencing data, enabling researchers to extract previously inaccessible insights from complex transcriptomic datasets. Machine learning algorithms can identify subtle patterns in gene expression that correlate with disease subtypes, treatment responses, and clinical outcomes [94]. These approaches are particularly valuable in personalized medicine contexts, where multi-dimensional data integration is essential for developing accurate predictive models.
Deep learning, a specialized subset of machine learning utilizing multi-layered neural networks, has demonstrated remarkable success in analyzing complex transcriptomic data [94]. Convolutional Neural Networks (CNNs) can identify spatial patterns in gene expression, while Recurrent Neural Networks (RNNs) and transformer architectures excel at modeling sequential dependencies in time-series transcriptomic data [94]. These capabilities enable more accurate classification of disease subtypes based on expression profiles and improved prediction of patient trajectories.
Natural Language Processing (NLP) methods represent another AI application with growing importance in transcriptomics. NLP techniques can extract meaningful information from unstructured clinical notes, scientific literature, and public databases to contextualize bulk RNA sequencing findings [94]. This integration of structured expression data with unstructured clinical information enables more comprehensive patient stratification and biomarker discovery.
The following diagram illustrates how these advanced analytical approaches integrate with bulk RNA sequencing data:
Generative models represent another frontier in AI applications for transcriptomics. Techniques such as Generative Adversarial Networks (GANs) can produce synthetic transcriptomic data that mimics real patient profiles, helping to address data scarcity issues and balance datasets for rare diseases [94]. These models also show promise in simulating patient disease trajectories and predicting how transcriptomic profiles might evolve under different treatment regimens [94].
The Scientist's Toolkit: Essential Research Reagent Solutions
Table 3: Key Research Reagent Solutions for Advanced Bulk RNA Sequencing
| Reagent Category | Specific Examples | Function & Application |
|---|---|---|
| Library Prep Kits | QuantSeq 3' mRNA-Seq, KAPA Stranded mRNA-Seq, CORALL Total RNA-Seq | Convert RNA to sequencing-ready libraries with method-specific optimization [3] |
| RNA Enrichment | Poly(A) selection beads, rRNA depletion kits | Target specific RNA fractions (mRNA vs. total RNA) [4] |
| Single-Cell Suspension | Enzymatic dissociation kits, viability stains | Prepare quality single-cell suspensions for validation studies [35] |
| Barcoding & Multiplexing | Cell hashing antibodies, sample multiplexing oligos | Pool multiple samples to reduce costs and batch effects [35] |
| Quality Control | RNA integrity assays, fluorometric quantitation | Assess sample quality and quantity before library prep [4] |
| AI-Ready Analysis | Pre-trained neural networks, automated pipelines | Standardize analysis and enable complex pattern recognition [94] |
Future Outlook and Strategic Recommendations
The integration of AI, long-read sequencing, and advanced bulk transcriptomics represents the future of personalized medicine research. Each technology brings complementary strengths: long-read sequencing provides unprecedented resolution of transcriptomic complexity, AI and machine learning extract subtle patterns from high-dimensional data, and bulk RNA sequencing offers a cost-effective framework for population-scale studies [93] [94] [95]. The convergence of these technologies will enable more precise patient stratification, biomarker discovery, and therapeutic development.
We anticipate several key trends will shape the coming years. First, hybrid approaches that combine the comprehensive variant detection of long-read technologies with the cost-efficiency of short-read sequencing for large cohorts will become increasingly common [93]. Second, AI integration throughout the analytical pipeline—from experimental design to clinical interpretation—will become standard practice, with emphasis on explainable AI to ensure clinical transparency and trust [94] [96]. Finally, multi-omic integration will advance, with simultaneous analysis of transcriptomic, genomic, epigenomic, and proteomic data from the same samples providing unprecedented insights into disease mechanisms.
For researchers planning studies in this rapidly evolving landscape, we recommend several strategic considerations. When designing bulk RNA sequencing experiments, clearly define primary objectives to guide the choice between mRNA-seq and total RNA-seq, considering that 3' mRNA-seq (e.g., QuantSeq) provides robust quantitative expression data with lower sequencing depth, while total RNA-seq enables comprehensive transcriptome characterization [3]. For rare disease studies, prioritize long-read sequencing to identify structural variants and novel transcripts missed by short-read approaches [93]. In common disease research with larger cohorts, employ a hybrid strategy using long-read sequencing for discovery and short-read technologies for validation and scaling. Most importantly, invest in AI and computational infrastructure, as these capabilities will become increasingly essential for extracting maximal insights from transcriptomic data [94].
The future of personalized medicine depends on our ability to accurately interpret the complex language of gene expression. Through the strategic integration of advanced sequencing technologies and artificial intelligence, researchers and drug development professionals can unlock deeper insights into disease mechanisms and therapeutic opportunities, ultimately enabling more precise and effective patient care.
In the evolving landscape of high-throughput transcriptomics, RNA sequencing (RNA-seq) has emerged as a powerful tool for characterizing gene expression profiles, identifying novel transcripts, and uncovering splicing variants [97]. However, the complexity of RNA-seq methodologies and analyses introduces potential for technical artifacts and biological misinterpretations. Orthogonal validation—the practice of confirming results using methodologically independent techniques—provides an essential framework for verifying transcriptomic findings and ensuring research rigor. This approach is particularly crucial when differentiating between the distinct outputs of total RNA-seq and 3' mRNA-seq methodologies, each offering unique insights and limitations within bulk RNA research [3] [98].
The fundamental principle of orthogonal validation involves cross-referencing antibody-based or sequencing-based results with data obtained using non-antibody-based, independent detection methods [99]. This strategy helps researchers distinguish genuine biological signals from methodology-specific artifacts, thereby strengthening experimental conclusions. As transcriptomic studies increasingly inform drug development and clinical decision-making, implementing robust validation frameworks becomes not merely advantageous but essential for producing translatable scientific insights.
RNA-seq Methodologies: Implications for Validation
Comparative Analysis of Total RNA-seq and 3' mRNA-Seq
Bulk RNA-seq approaches primarily diverge into two methodological pathways: total RNA-seq and 3' mRNA-seq. Understanding their technical distinctions is fundamental for designing appropriate validation strategies, as each method profiles different aspects of the transcriptome with inherent biases and coverage limitations [98].
Table 1: Key Characteristics of Total RNA-seq vs. 3' mRNA-seq
| Parameter | Total RNA-Seq | 3' mRNA-Seq |
|---|---|---|
| RNA Types Captured | Coding and non-coding RNAs (lncRNAs, miRNAs, etc.) | Primarily protein-coding polyadenylated RNAs |
| Transcript Coverage | Even coverage across 5' to 3' ends | Biased toward 3' ends |
| Primary Applications | Whole transcriptome analysis, isoform identification, alternative splicing, novel transcript discovery | Differential gene expression (DGE) analysis focusing on protein-coding genes |
| Sequencing Depth Requirements | High (typically 100-200 million reads/sample) | Moderate (typically 25-50 million reads/sample) |
| rRNA Removal | rRNA depletion methods | Poly(A) selection enriches mRNA while excluding rRNA |
| Cost Considerations | Higher per sample | Lower per sample, enabling higher throughput |
| Degraded RNA Tolerance | More tolerant if rRNA depletion is used | Less effective with degraded RNA lacking intact poly-A tails |
Total RNA-seq provides a comprehensive view of the transcriptome by capturing both coding and non-coding RNA species after ribosomal RNA (rRNA) depletion, which typically constitutes 80-90% of total RNA [98] [4]. This approach enables investigators to examine global transcript expression, splicing patterns, exon-intron boundaries, and RNA regulation across the entire transcript length [98]. In contrast, 3' mRNA-seq employs oligo-dT primers to target polyadenylated mRNA directly, generating data biased toward the 3' end of transcripts [3]. This method is optimized for differential gene expression (DGE) analysis of protein-coding genes and provides a cost-effective solution for high-throughput screening of numerous samples [3] [98].
Validation Implications by Methodology
The selection between these methodologies directly influences validation requirements. Total RNA-seq data may require confirmation of non-coding RNA expression, alternative splicing events, or novel transcript structures using techniques such as northern blotting or RNA in situ hybridization [99]. For 3' mRNA-seq findings, orthogonal validation typically focuses on confirming differential expression of specific protein-coding genes through quantitative methods like qPCR or digital PCR [100]. The broader scope of total RNA-seq necessitates more comprehensive validation strategies, while 3' mRNA-seq validation can concentrate specifically on expression quantitation of targeted genes.
Orthogonal Validation Methodologies
Quantitative PCR and Digital PCR
Quantitative PCR (qPCR) represents the most widely employed orthogonal method for validating RNA-seq findings, particularly for confirming differential expression of protein-coding genes. This technique offers exceptional sensitivity and dynamic range for transcript quantification while requiring minimal RNA input compared to sequencing approaches. A comprehensive benchmark study analyzing over 18,000 protein-coding genes revealed that approximately 15-20% of genes showed non-concordant results when comparing RNA-seq and qPCR data, with most discrepancies occurring in lowly expressed genes or those with small fold-changes (below 1.5-2) [100]. This evidence supports prioritizing qPCR validation for genes with low expression levels or modest fold-changes that form critical components of the research narrative.
Digital PCR (dPCR) provides an advanced validation approach offering absolute nucleic acid quantification without requiring standard curves. This method partitions samples into thousands of individual reactions, enabling precise measurement of transcript copies through Poisson statistical analysis. dPCR demonstrates particular utility for validating genes with very low expression levels where qPCR may lack sufficient sensitivity or precision.
Non-antibody-Based Validation Techniques
Orthogonal strategies extending beyond PCR-based methods provide critical validation through fundamentally different detection principles:
- In situ hybridization (ISH) allows spatial localization of transcripts within tissue sections or cells, confirming both expression levels and patterns observed in RNA-seq data [99]. RNAscope represents an advanced ISH technology with enhanced sensitivity and specificity, enabling single-molecule detection in formalin-fixed paraffin-embedded (FFPE) samples.
- Nanostring nCounter technology provides digital quantification of transcript abundance without amplification steps, eliminating potential PCR biases. This method uses color-coded molecular barcodes that hybridize directly to target RNAs, offering exceptional reproducibility and sensitivity, particularly for degraded samples like FFPE tissues.
- Single-cell RNA-seq (scRNA-seq) serves as an orthogonal method to bulk RNA-seq by resolving transcriptional heterogeneity within samples. While bulk RNA-seq provides population-averaged expression profiles, scRNA-seq can validate whether expression changes occur uniformly across cell populations or are driven by specific subpopulations [97].
Integration with Public Data Repositories
Mining publicly available genomic and transcriptomic databases provides a valuable preliminary orthogonal validation strategy. Resources such as the Cancer Cell Line Encyclopedia (CCLE), BioGPS, Human Protein Atlas, DepMap Portal, and COSMIC contain extensive expression data across diverse biological contexts [99]. Comparing RNA-seq findings with these established datasets helps researchers determine whether observed expression patterns align with existing knowledge or represent potential methodological artifacts. For example, consistent expression of a target across multiple independent datasets strengthens confidence in RNA-seq results, while discordant patterns may indicate technical artifacts or novel biological contexts requiring further investigation.
Experimental Design for Effective Validation
Strategic Selection of Validation Targets
Orthogonal validation should prioritize genes with particular characteristics that increase their potential for discordant results between methodologies. Based on empirical evidence, validation resources should focus on:
- Genes with low expression levels: Low-abundance transcripts demonstrate higher variability in both RNA-seq and orthogonal methods, with approximately 93% of non-concordant genes showing fold-changes lower than 2 [100].
- Genes with small fold-changes: Subtle expression differences (below 1.5-fold) show higher rates of technical variability and require confirmation through independent methods.
- Critical pathway components: When research conclusions heavily depend on expression changes in specific genes or pathways, regardless of effect size, orthogonal validation provides essential supporting evidence.
- Novel transcripts or splice variants: Discoveries without previous experimental confirmation warrant rigorous validation using multiple independent methods.
Table 2: Orthogonal Validation Methods and Their Applications
| Validation Method | Key Strengths | Optimal Applications | Technical Considerations |
|---|---|---|---|
| Quantitative PCR (qPCR) | High sensitivity, wide dynamic range, cost-effective | Validating differential expression of protein-coding genes | Requires specific primer design, limited to known transcripts |
| Digital PCR (dPCR) | Absolute quantification, high precision, resistant to PCR inhibitors | Validating low-abundance transcripts, detecting subtle fold-changes | Higher cost, limited multiplexing capability |
| In situ Hybridization | Spatial context preservation, morphology correlation | Confirming expression patterns in tissue context, cell-type specific expression | Semi-quantitative, technical complexity for some samples |
| Nanostring nCounter | No amplification bias, high reproducibility, FFPE-compatible | Validating large gene panels, analyzing degraded samples | Limited to targeted sequences, higher initial equipment cost |
| Single-cell RNA-seq | Cellular resolution, heterogeneity assessment | Validating cell-type-specific expression, confirming cellular expression patterns | High cost per cell, complex data analysis |
Workflow Integration
Implementing orthogonal validation requires strategic planning throughout the experimental timeline. The following workflow diagram outlines key decision points in designing and executing an effective validation strategy for RNA-seq findings:
Implementing robust orthogonal validation requires access to specialized reagents and computational resources. The following table outlines essential components of the validation toolkit:
Table 3: Research Reagent Solutions for Orthogonal Validation
| Tool Category | Specific Examples | Function in Validation |
|---|---|---|
| qPCR Reagents | SYBR Green master mix, TaqMan assays, reverse transcription kits | Quantify expression of specific targets identified in RNA-seq |
| ISH Platforms | RNAscope reagents, ViewRNA kits, BaseScope assays | Visualize spatial distribution of transcripts in tissue samples |
| Public Data Repositories | CCLE, BioGPS, Human Protein Atlas, DepMap Portal | Compare RNA-seq findings with independent datasets |
| Digital PCR Systems | Bio-Rad QX200, Thermo Fisher QuantStudio 3D | Absolute quantification of transcript copies without standard curves |
| Targeted Gene Expression Panels | Nanostring nCounter panels | Multiplexed validation of dozens to hundreds of targets |
| Single-cell RNA-seq Kits | 10X Genomics Chromium, Parse Biosciences kits | Resolve cellular heterogeneity in expression patterns |
Case Studies in Orthogonal Validation
Validation of Nectin-2 Expression Patterns
A compelling example of orthogonal validation comes from a study analyzing Nectin-2 expression across multiple human cell lines [99]. Researchers initially performed western blot analysis using the Nectin-2/CD112 (D8D3F) rabbit monoclonal antibody, which revealed elevated expression in RT4 and MCF7 cell lines with minimal detection in HDLM-2 and MOLT-4 cells. This pattern was confirmed through immunohistochemical analysis of cell pellets, with both antibody-based techniques showing strong correlation. Critically, orthogonal validation using transcriptomic data from public databases confirmed that the observed protein expression patterns aligned with predicted expression based on genomics and transcriptomics resources, thereby substantiating the antibody specificity and experimental findings through methodologically independent approaches [99].
Benchmarking RNA-seq Technologies
The Long-read RNA-Seq Genome Annotation Assessment Project (LRGASP) Consortium conducted a systematic evaluation of long-read RNA-seq methods, generating over 427 million long-read sequences to address transcript identification, quantification, and de novo detection challenges [101]. This comprehensive benchmarking revealed that libraries with longer, more accurate sequences produced more precise transcript identifications compared to those with increased read depth, while greater read depth improved quantification accuracy. The consortium recommended incorporating orthogonal data and replicate samples when detecting rare and novel transcripts or using reference-free approaches, highlighting the importance of validation strategies tailored to specific analytical goals [101].
Orthogonal validation represents an indispensable component of rigorous transcriptomic research, particularly when distinguishing between biological signals and methodological artifacts in bulk RNA-seq experiments. The strategic implementation of validation frameworks must account for the fundamental differences between total RNA-seq and 3' mRNA-seq approaches, with validation techniques carefully matched to methodological limitations and research objectives. As transcriptomic technologies continue evolving toward longer reads, single-cell resolution, and enhanced throughput [101] [97], orthogonal validation will maintain its critical role in ensuring research reproducibility and biological relevance. By integrating these practices throughout the experimental workflow—from strategic target selection to method implementation—researchers and drug development professionals can advance transcriptomic discoveries with heightened confidence and translational potential.
Conclusion
The choice between bulk mRNA and total RNA sequencing is not a matter of one being superior, but rather which is optimal for a specific research question. mRNA-seq offers a cost-effective, focused approach for high-throughput gene expression quantification, while total RNA-seq provides a comprehensive view of the transcriptome, essential for discovering regulatory mechanisms and non-coding RNA functions. Robust experimental design, particularly adequate sample sizes, is paramount for data reliability. Future directions will be shaped by integration with single-cell and spatial transcriptomics, AI-driven bioinformatics, and the expanding role of RNA analysis in clinical diagnostics and personalized RNA therapeutics. By strategically selecting and implementing these powerful technologies, researchers can continue to unlock profound insights into biology and disease.
References
- 1. Transcriptome: Connecting the Genome to Gene Function [https://www.nature.com/scitable/topicpage/transcriptome-connecting-the-genome-to-gene-function-605/]
- 2. Transcriptome - an overview | ScienceDirect Topics [https://www.sciencedirect.com/topics/pharmacology-toxicology-and-pharmaceutical-science/transcriptome]
- 3. Whole Transcriptome vs 3' mRNA-Seq: How to Choose ... [https://www.lexogen.com/blog/choosing-between-whole-transcriptome-total-rna-seq-and-3-mrna-seq/]
- 4. mRNA Sequencing vs Total RNA Sequencing [https://www.cd-genomics.com/mrna-sequencing-vs-total-rna-sequencing.html]
- 5. From bulk, single-cell to spatial RNA sequencing [https://www.nature.com/articles/s41368-021-00146-0]
- 6. Changing Technologies of RNA Sequencing and Their ... [https://pmc.ncbi.nlm.nih.gov/articles/PMC7160325/]
- 7. Transcriptomes and Proteomes - Genomes - NCBI - NIH [https://www.ncbi.nlm.nih.gov/books/NBK21121/]
- 8. mRNA Sequencing | A comprehensive view of the coding ... [https://www.illumina.com/techniques/sequencing/rna-sequencing/mrna-seq.html]
- 9. Total RNA Sequencing | Whole-transcriptome ... [https://www.illumina.com/techniques/sequencing/rna-sequencing/total-rna-seq.html]
- 10. Should I Choose Single Cell Sequencing or Bulk ... [https://singleron.bio/should-i-choose-single-cell-sequencing-or-bulk-sequencing/]
- 11. Poly(A) Enrichment vs. rRNA Depletion Strategy [https://rna.cd-genomics.com/resource/choose-polya-vs-rrna-depletion.html]
- 12. Choosing Poly(A) Selection or rRNA Depletion for RNA-seq [https://www.revvity.com/blog/polya-selection-vs-rrna-depletion-guide-picking-right-upstream-method]
- 13. A comparative analysis of mRNA enrichment strategies ... [https://www.nature.com/articles/s41598-025-02082-z]
- 14. A comparison of mRNA sequencing (RNA-Seq) library ... [https://bmcgenomics.biomedcentral.com/articles/10.1186/s12864-022-08543-3]
- 15. Comparative evaluation of RNA-Seq library preparation ... [https://www.nature.com/articles/s41598-019-49889-1]
- 16. Whole Transcriptome vs 3’ mRNA-Seq: How to Choose the Right Method [https://www.lexogen.com/blog/choosing-between-whole-transcriptome-total-rna-seq-and-3-mrna-seq]
- 17. Considerations for Choosing between Total RNA-Seq and ... [https://www.zymoresearch.com/pages/technote-considerations-for-choosing-between-total-rna-seq-and-3-mrna-seq?srsltid=AfmBOooNvi22pViCwvMDEBQSCchVs5T6LgpAQdTt5ApUmI801Huuvi6h]
- 18. RNA Sequencing | RNA-Seq methods & workflows [https://www.illumina.com/techniques/sequencing/rna-sequencing.html]
- 19. Quantitative and Qualitative RNA-Seq-Based Evaluation of ... [https://pmc.ncbi.nlm.nih.gov/articles/PMC3004295/]
- 20. Comparing the Most Popular Tools and Pipelines for Bulk ... [https://www.elucidata.io/blog/bulk-rna-sequencing-a-comparison-of-the-most-popular-tools-and-pipelines]
- 21. Systematic comparison and assessment of RNA-seq procedures for gene expression quantitative analysis | Scientific Reports [https://www.nature.com/articles/s41598-020-76881-x]
- 22. Market Size, Growth & Insights mRNA -2035 Sequencing 2025 [https://www.futuremarketinsights.com/reports/mrna-sequencing-market]
- 23. Long Non-coding RNA Sequencing (lncRNA-seq) [https://www.archivemarketresearch.com/reports/long-non-coding-rna-sequencing-lncrna-seq-137531]
- 24. Single-cell multi-omics as a window into the non-coding ... [https://pmc.ncbi.nlm.nih.gov/articles/PMC12439418/]
- 25. Integrated bulk and single-cell RNA sequencing reveals a ... [https://pmc.ncbi.nlm.nih.gov/articles/PMC12211307/]
- 26. Exploring microRNAs, One Cell at a Time - PMC [https://pmc.ncbi.nlm.nih.gov/articles/PMC12641660/]
- 27. miRNA Tools and Services Market Size 2025 To 2034 [https://www.precedenceresearch.com/mirna-tools-and-services-market]
- 28. Integration of Single-cell and bulk RNA sequencing data ... [https://www.nature.com/articles/s41598-025-22803-8]
- 29. a user-friendly interface for seamless dual and bulk -Seq analysis RNA [https://www.frontiersin.org/journals/bioinformatics/articles/10.3389/fbinf.2025.1696823/full]
- 30. Scanning sample-specific miRNA regulation from bulk and ... [https://bmcbiol.biomedcentral.com/articles/10.1186/s12915-024-02020-x]
- 31. Single-cell and bulk RNA-sequence identify an immune ... [https://www.sciencedirect.com/science/article/pii/S0141813025035664]
- 32. Comparison of RNA isolation methods on RNA-Seq [https://bmcgenomics.biomedcentral.com/articles/10.1186/s12864-020-6673-2]
- 33. Comparative analysis of library preparation approaches for ... [https://www.nature.com/articles/s41598-025-12992-7]
- 34. A comparison of mRNA sequencing (RNA-Seq) library ... [https://pmc.ncbi.nlm.nih.gov/articles/PMC9008973/]
- 35. Bulk vs. single cell RNA-seq: Experimental differences and ... [https://www.10xgenomics.com/blog/bulk-vs-single-cell-RNA-seq-experimental-differences-and-advantages-of-single-cell-resolution]
- 36. Discovery of Novel Protein-Coding and Long Non ... [https://pmc.ncbi.nlm.nih.gov/articles/PMC11885362/]
- 37. Long-read sequencing reveals the RNA isoform repertoire of ... [https://genomebiology.biomedcentral.com/articles/10.1186/s13059-025-03724-1]
- 38. A Guide to Basic RNA Sequencing Data Processing and ... [https://pmc.ncbi.nlm.nih.gov/articles/PMC12067304/]
- 39. Quality control recommendations for RNASeq using FFPE ... [https://bmcmedgenomics.biomedcentral.com/articles/10.1186/s12920-022-01355-0]
- 40. Whole Blood RNA-Seq: Best Practice [https://www.lexogen.com/blog/whole-blood-rna-seq-best-practice/]
- 41. The Impact of Blood Sample Processing on Ribonucleic ... [https://pmc.ncbi.nlm.nih.gov/articles/PMC11050547/]
- 42. A Whole-Tissue RNA-seq Toolkit for Organism-Wide ... [https://pmc.ncbi.nlm.nih.gov/articles/PMC7872736/]
- 43. Low-Input RNA Sequencing [https://www.psomagen.com/low-input-rna-sequencing]
- 44. FFPE Transcriptomics: 3' mRNA-Seq vs Whole ... [https://www.lexogen.com/blog/transcriptomics-on-ffpe-samples-3-mrna-seq-vs-whole-transcriptome-sequencing/]
- 45. Reducing costs for DNA and RNA sequencing by sample ... [https://pmc.ncbi.nlm.nih.gov/articles/PMC9400246/]
- 46. Budgeting for an mRNA-seq project? How much does RNA ... [https://alitheagenomics.com/blog/budgeting-for-an-mrna-seq-project-here-are-the-main-cost-drivers-to-keep-an-eye-on]
- 47. end mRNA library from unpurified bulk RNA in a single tube [https://pmc.ncbi.nlm.nih.gov/articles/PMC10907608/]
- 48. What is a good sequencing depth for bulk RNA-Seq? [https://www.ecseq.com/support/ngs/what-is-a-good-sequencing-depth-for-bulk-rna-seq]
- 49. Efficient experimental design and analysis strategies for the ... [https://pmc.ncbi.nlm.nih.gov/articles/PMC3560154/]
- 50. On the utility of RNA sample pooling to optimize cost and ... [https://bmcgenomics.biomedcentral.com/articles/10.1186/s12864-020-6721-y]
- 51. RNA Analysis Market Driven by Single-Cell Sequencing [https://www.towardshealthcare.com/insights/rna-analysis-market-sizing]
- 52. Flexynesis: A deep learning toolkit for bulk multi-omics data ... [https://www.nature.com/articles/s41467-025-63688-5]
- 53. RNA Sequencing in Drug Discovery and Development [https://www.lexogen.com/blog/rna-sequencing-in-drug-discovery-and-development/]
- 54. Transforming RNA-seq analysis into biomarker discovery ... [https://www.sciencedirect.com/science/article/abs/pii/S1359644625001047]
- 55. Bulk RNAseq Methodology and Analysis Guide [https://www.cores.emory.edu/eicc/_includes/documents/sections/resources/RNAseq_Methodology.html]
- 56. Introduction to Bulk RNAseq data analysis [https://bioinformatics-core-shared-training.github.io/Bulk_RNAseq_Course_2021_June/Markdowns/11_Annotation_and_Visualisation.html]
- 57. Sample size, power and effect size revisited: simplified and ... [https://pmc.ncbi.nlm.nih.gov/articles/PMC7745163/]
- 58. Conducting Power Analyses to Determine Sample Sizes in ... [https://jte-journal.org/articles/10.21061/jte.v35i2.a.5]
- 59. Optimized murine sample sizes for RNA sequencing ... [https://www.nature.com/articles/s41467-025-65022-5]
- 60. Statistical Power Analysis for Designing Bulk, Single-Cell, and ... [https://pmc.ncbi.nlm.nih.gov/articles/PMC9952882/]
- 61. Power analysis and sample size estimation for RNA-Seq ... [https://pmc.ncbi.nlm.nih.gov/articles/PMC4201821/]
- 62. Considerations for Choosing between Total RNA-Seq and ... [https://www.zymoresearch.com/pages/technote-considerations-for-choosing-between-total-rna-seq-and-3-mrna-seq?srsltid=AfmBOopUptayJID5RsAftWj6Hs0XWEtSSnf5PJU--p_b3JSgNRXDz0tu]
- 63. Systematic comparison of quantity and quality of RNA ... [https://translational-medicine.biomedcentral.com/articles/10.1186/s12967-024-05890-5]
- 64. Quality control recommendations for RNASeq using FFPE ... [https://www.rna-seqblog.com/quality-control-recommendations-for-rnaseq-using-ffpe-samples/]
- 65. High-Fidelity Transcriptome Reconstruction of Degraded ... [https://www.mdpi.com/2079-7737/14/12/1652]
- 66. Published Bulk 3' mRNA-seq Technologies: Which is Best ... [https://alitheagenomics.com/blog/published-bulk-3-mrna-seq-technologies-which-is-best-for-your-next-screen]
- 67. Optimization of an RNA sequencing method for low- ... [https://labs.iqvia.com/insights/scientific-posters-optimization-of-an-rna-sequencing-method-for-low-quantity-degraded-samples]
- 68. [Tutorial] Bulk RNA-seq DE analysis [https://informatics.fas.harvard.edu/resources/tutorials/differential-expression-analysis/]
- 69. Battle of the Methods: Whole Transcriptome Versus mRNA- ... [https://bitesizebio.com/42768/battle-of-the-methods-whole-transcriptome-versus-mrnaseq/]
- 70. A systematic benchmark of Nanopore long-read RNA ... [https://www.nature.com/articles/s41592-025-02623-4]
- 71. Long-read RNA sequencing: A transformative technology ... [https://www.sciencedirect.com/science/article/pii/S1525001624007524]
- 72. NGS Library Preparation [https://www.cd-genomics.com/resource-library-preparation-for-ngs.html]
- 73. Total RNA Sequencing Breakthroughs Transform ... [https://broadclinicallabs.org/total-rna-sequencing-breakthroughs-transform-research-accessibility/]
- 74. Unlocking Precision in WGS Through Better Library Preparation [https://www.the-scientist.com/unlocking-precision-in-wgs-through-better-library-preparation-73559]
- 75. Bias in RNA-seq Library Preparation: Current Challenges ... [https://pmc.ncbi.nlm.nih.gov/articles/PMC8079181/]
- 76. Benchmark study for evaluating the quality of reference ... [https://www.frontiersin.org/journals/veterinary-science/articles/10.3389/fvets.2023.1128570/full]
- 77. RNA-Seq Experimental Design Guide for Drug Discovery [https://www.lexogen.com/blog/planning-for-success-a-strategic-design-guide-for-rna-seq-experiments-in-drug-discovery/]
- 78. Clinical and analytical validation of a combined RNA ... [https://www.nature.com/articles/s43856-025-00934-3]
- 79. A comprehensive assessment of RNA-seq accuracy, reproducibility and information content by the Sequencing Quality Control consortium - PMC [https://pmc.ncbi.nlm.nih.gov/articles/PMC4321899/]
- 80. An updated comparison of microarray and RNA-seq for ... [https://pmc.ncbi.nlm.nih.gov/articles/PMC12016467/]
- 81. Augmenting precision medicine via targeted RNA-Seq ... [https://www.nature.com/articles/s41698-025-00993-8]
- 82. Prime-seq, efficient and powerful bulk RNA sequencing [https://genomebiology.biomedcentral.com/articles/10.1186/s13059-022-02660-8]
- 83. Bioinformatics perspectives on transcriptomics [https://www.rna-seqblog.com/bioinformatics-perspectives-on-transcriptomics-a-comprehensive-review-of-bulk-and-single-cell-rna-sequencing-analyses/]
- 84. Clinical application of single‐cell RNA sequencing in disease ... [https://pmc.ncbi.nlm.nih.gov/articles/PMC12576031/]
- 85. Bulk RNA Sequencing versus Single-Cell RNAseq: 2 Powerful... [https://sampled.com/bulk-rna-sequencing-vs-single-cell-rna-sequencing/]
- 86. Challenges and Considerations in Bulk RNA-seq [https://alitheagenomics.com/blog/challenges-and-considerations-in-bulk-rna-seq]
- 87. Whole Transcriptome vs. Targeted Gene Expression Profiling [https://missionbio.com/company/blog/comparison-whole-transcriptome-vs-targeted-gene-expression-profiling/]
- 88. Integrated analysis of single-cell RNA-seq and bulk RNA-seq ... [https://pmc.ncbi.nlm.nih.gov/articles/PMC12548165/]
- 89. Comparison of single-cell RNA-seq methods to enable ... [https://www.sciencedirect.com/science/article/pii/S2667237525002097]
- 90. A multiplex single-cell RNA-Seq pharmacotranscriptomics ... [https://www.nature.com/articles/s41589-024-01761-8]
- 91. Applications of single-cell RNA sequencing in drug ... [https://www.rna-seqblog.com/applications-of-single-cell-rna-sequencing-in-drug-discovery-and-development/]
- 92. Integrating bulk and single cell RNA-seq refines ... [https://elifesciences.org/reviewed-preprints/106183]
- 93. The impact of long-read sequencing on human population ... [https://pmc.ncbi.nlm.nih.gov/articles/PMC12047236/]
- 94. Artificial intelligence in healthcare and medicine: clinical ... [https://pmc.ncbi.nlm.nih.gov/articles/PMC12455834/]
- 95. Understanding Bulk and Single-Cell RNA Sequencing [https://www.cd-genomics.com/resource-bulk-rna-sequencing-vs-single-cell-rna-sequencing.html]
- 96. The role of AI and personalized medicine in healthcare [https://bmcmededuc.biomedcentral.com/articles/10.1186/s12909-025-07771-x]
- 97. High-throughput transcriptomics | Scientific Reports [https://www.nature.com/articles/s41598-022-23985-1]
- 98. Considerations for Choosing between Total RNA-Seq and ... [https://www.zymoresearch.com/pages/technote-considerations-for-choosing-between-total-rna-seq-and-3-mrna-seq?srsltid=AfmBOor60SvmxRWcH-CgRtONtSqHODTQttzIte4fZ5MwoiyMZBseuuGx]
- 99. Hallmarks of Antibody Validation: Orthogonal Strategy [https://www.cellsignal.com/about-us/approach-validation-principles/orthogonal-data?srsltid=AfmBOop54B0-tviDzYVJgMXe9H4xf2Ljj83eAhaYZkNPzC7Nyh-aSiwY]
- 100. Do results obtained with RNA-sequencing require ... [https://pmc.ncbi.nlm.nih.gov/articles/PMC7823214/]
- 101. Systematic assessment of long-read RNA-seq methods for ... [https://www.nature.com/articles/s41592-024-02298-3]