ADAR1 p150: The Interferon-Inducible RNA Editor Shaping Immunity and Disease
This review provides a comprehensive analysis of the ADAR1 p150 isoform, focusing on its unique interferon-inducible expression and critical functions in immune regulation and disease pathogenesis.
ADAR1 p150: The Interferon-Inducible RNA Editor Shaping Immunity and Disease
Abstract
This review provides a comprehensive analysis of the ADAR1 p150 isoform, focusing on its unique interferon-inducible expression and critical functions in immune regulation and disease pathogenesis. Targeting researchers and drug developers, it explores the foundational biology of p150, details methodologies for its study and therapeutic targeting, discusses common experimental challenges, and validates its role through comparative analysis with the constitutively expressed p110 isoform. The article synthesizes current evidence positioning ADAR1 p150 as a key modulator of the interferon response, a guardian against autoimmunity, and an emerging therapeutic target in cancer and autoimmune disorders.
Decoding ADAR1 p150: Structure, Induction, and Core Mechanisms in Innate Immunity
Within the context of advancing research on the interferon-inducible function of the ADAR1 p150 isoform, this technical guide details the genomic architecture of the ADAR locus, the mechanisms governing isoform generation, and the distinct functional roles of the constitutively expressed p110 and interferon-induced p150 proteins. Emphasis is placed on quantitative data, experimental methodologies, and reagent solutions essential for researchers in this field.
Gene Architecture of theADARLocus
The ADAR (Adenosine Deaminase Acting on RNA) gene, located on human chromosome 1q21.3, exhibits a complex architecture enabling the production of major protein isoforms through alternative promoter usage and exon selection.
Table 1: Genomic Organization of the Human ADAR Locus (ENSEMBL GRCh38.p14)
| Feature | p110-Specific Promoter/Exon 1A | p150-Specific Promoter/Exon 1B | Shared Exons (2-15) |
|---|---|---|---|
| Genomic Coordinates | chr1: 154,582,734-154,583,889 | chr1: 154,579,104-154,579,843 | chr1: 154,562,001-154,578,950 |
| Exon Length | 1156 bp | 740 bp | Varies (e.g., Exon 2: 165 bp) |
| Primary Regulatory Elements | Constitutive, housekeeping-like promoter | Interferon-Stimulated Response Element (ISRE), Gamma-Activated Sequence (GAS) | Splicing donor/acceptor sites |
| Resulting N-terminus | 1st Met in Exon 2 (aa 1 of p110) | 1st Met in Exon 1B (aa 1 of p150) | Catalytic deaminase domains, dsRNA binding domains |
Mechanisms of Isoform Generation: p110 vs. p150
The p110 and p150 isoforms are generated via distinct transcriptional start sites and alternative splicing.
- p110: Transcription initiates from the constitutive promoter upstream of exon 1A. Exon 1A is spliced to exon 2, which contains the first AUG codon, translating into a protein of ~110 kDa.
- p150: Transcription is induced by interferons (IFN-α/β, IFN-γ) via the ISRE/GAS elements in the inducible promoter upstream of exon 1B. Exon 1B contains its own AUG start codon and is spliced to exon 2. The p150-specific exon 1B encodes a unique Z-DNA/RNA binding domain (Zα), resulting in a ~150 kDa protein.
Diagram 1: ADAR Isoform Generation Pathway
Quantitative Comparison of p150 and p110 Isoforms
Table 2: Functional and Quantitative Comparison of ADAR1 Isoforms
| Property | ADAR1 p110 | ADAR1 p150 |
|---|---|---|
| Molecular Weight | 110-120 kDa | 150-160 kDa |
| Induction Mechanism | Constitutive, low basal levels | Strong induction by Type I/II IFNs (10-100 fold increase) |
| Unique Domains | None (lacks Zα domain) | N-terminal Zα domain (binds Z-form nucleic acids) |
| Subcellular Localization | Primarily nuclear | Both nuclear and cytoplasmic |
| Primary A-to-I Editing Sites | Housekeeping sites (e.g., 5-HT2CR, GRIA2) | Repetitive Alu elements in 3' UTRs & dsRNA viruses |
| Essential Function | Embryonic development, prevents MDA5 sensing of self-RNA | Immune regulation, suppresses IFN response to self & viral RNA, antiviral defense |
Key Experimental Protocols
Inducing and Detecting p150 Expression
Protocol: Time-course analysis of IFN-induced ADAR1 p150.
- Cell Treatment: Seed HEK293T or A549 cells. Treat with human IFN-α (1000 U/mL) or IFN-γ (50 ng/mL) for 0, 6, 12, 24, and 48 hours.
- Lysis: Harvest cells in RIPA buffer with protease inhibitors.
- Western Blot:
- Load 20-30 µg protein per lane on a 6% SDS-PAGE gel (optimal for large proteins).
- Transfer to PVDF membrane.
- Block with 5% non-fat milk.
- Probe with primary antibodies: Mouse anti-ADAR1 (clone 15.8.6, recognizes C-terminus common to both isoforms) and Rabbit anti-p150 (specific to Zα domain).
- Use HRP-conjugated secondary antibodies and ECL reagent.
- Normalize to loading control (e.g., β-Actin).
- Quantification: Perform densitometry analysis. Plot p150 band intensity over time to determine peak induction.
Assessing A-to-I Editing Activity by Isoform
Protocol: Restriction enzyme-based assay for site-specific editing (e.g., GRIA2 Q/R site, primarily p110-edited).
- RNA Isolation & cDNA Synthesis: Extract total RNA from IFN-treated and control cells. Synthesize cDNA using a gene-specific primer or random hexamers.
- PCR Amplification: Amplify the genomic region of interest containing the editing site using high-fidelity polymerase.
- Digestion: The GRIA2 Q/R site (A→I change) alters an HhaI (GCGC) restriction site. Digest the PCR product with HhaI.
- Analysis: Run digested products on a 3% agarose gel. The unedited cDNA is cut, yielding two smaller fragments. The edited cDNA is resistant to digestion, yielding one larger fragment. The ratio quantifies editing efficiency.
Diagram 2: GRIA2 Q/R Site Editing Assay Workflow
The Scientist's Toolkit: Key Research Reagent Solutions
Table 3: Essential Reagents for ADAR1 Isoform Research
| Reagent | Function/Description | Example Product/Catalog # (Research Use) |
|---|---|---|
| Recombinant Human Interferons | Induce p150 expression via JAK-STAT pathway. | IFN-α 2a (PBL Assay Science #11100-1); IFN-γ (PeproTech #300-02) |
| ADAR1 Antibodies (p150 specific) | Detect p150 isoform uniquely via Zα domain. | Rabbit mAb (Cell Signaling #81256) |
| ADAR1 Antibodies (pan/Common) | Detect total ADAR1 (both p150 & p110). | Mouse mAb (Sigma-Aldrich #SAB4200068; clone 15.8.6) |
| Phospho-STAT1 (Tyr701) Antibody | Confirm IFN pathway activation (control for induction). | Rabbit mAb (Cell Signaling #9167) |
| dsRNA-Specific Antibody (J2) | Detect immunogenic dsRNA structures that accumulate when ADAR1 is deficient. | Mouse mAb (SCICONS #J2-1125) |
| Editing-Specific PCR Primers | Amplify known editing sites (e.g., in Alu elements, GRIA2, BLCAP). | Custom-designed primers (IDT) spanning editing site. |
| Ribonuclease T1 | Distinguishes inosine (cleaved) from adenosine (resistant) in RNA-seq or biochemical assays. | Thermo Scientific #EN0541 |
| MDA5/RIG-I Agonists | Positive controls for innate immune activation (e.g., poly(I:C)). | High MW poly(I:C) (InvivoGen #tlrl-pic) |
| ADAR1 Knockout Cell Lines | Isogenic controls to delineate isoform-specific functions. | HEK293T ADAR1^-/- (available from repositories like ATCC) |
Within the context of ADAR1 research, the interferon-inducible p150 isoform plays a critical, non-redundant role in immune regulation and viral defense. Its function is distinguished from the constitutively expressed p110 isoform almost entirely by its unique, longer N-terminal region. This whitepaper provides a technical dissection of this defining N-terminus, its functional domains, and its implications for ADAR1 p150's inducible function.
Structural and Functional Domains of the ADAR1 p150 N-terminus
The p150-specific N-terminus encompasses approximately 295 amino acids not present in the p110 isoform. This region contains two Z-DNA binding domains (ZBDs) and a nuclear export signal (NES), which are crucial for its localization and function.
Table 1: Comparative Features of ADAR1 Isoforms
| Feature | ADAR1 p110 Isoform | ADAR1 p150 Isoform |
|---|---|---|
| Expression | Constitutive | Interferon-Inducible |
| Initiating Methionine | Met-296 (of p150 sequence) | Met-1 |
| Unique N-terminal Region | Absent | ~295 amino acids (aa 1-295) |
| Z-DNA Binding Domains (ZBDs) | Absent | Two domains: Zα & Zβ |
| Primary Localization | Nucleus | Shuttles between Cytoplasm & Nucleus |
| Key Function | Editing of coding RNAs | Immune modulation, viral dsRNA editing, preventing MDA5 sensing |
Experimental Protocols for Studying the p150 N-terminus
Protocol 1: Distinguishing Isoform Expression via qRT-PCR
Objective: Quantify interferon-induced ADAR1 transcript variants.
- Cell Stimulation: Treat human fibroblasts or relevant cell line with 500 U/mL universal type I interferon (IFN-α/β) for 6-24 hours.
- RNA Extraction: Use TRIzol reagent with DNase I treatment.
- cDNA Synthesis: Reverse transcribe 1 µg total RNA using random hexamers.
- qPCR Setup: Design isoform-specific primers.
- p150-specific: Forward primer in exon 1A (unique to p150 transcript).
- p110-specific: Forward primer in exon 2 (common region).
- Use a common reverse primer in a downstream constitutive exon.
- Quantification: Run in triplicate using SYBR Green chemistry. Normalize to GAPDH or ACTB. Calculate fold induction relative to unstimulated cells using the 2^(-ΔΔCt) method.
Protocol 2: Subcellular Localization Tracking via Immunofluorescence
Objective: Visualize interferon-induced, NES-dependent nucleocytoplasmic shuttling.
- Cell Culture & Stimulation: Seed HeLa cells on coverslips. Stimulate with IFN-β (1000 U/mL, 12h).
- Fixation & Permeabilization: Fix with 4% paraformaldehyde (15 min), permeabilize with 0.1% Triton X-100 (10 min).
- Immunostaining: Block with 5% BSA. Incubate with primary antibody against ADAR1 (clone 15.8.6, recognizes common C-terminus) overnight at 4°C.
- Detection & Visualization: Incubate with fluorophore-conjugated secondary antibody (e.g., Alexa Fluor 488). Counterstain nuclei with DAPI. Image using a confocal microscope. Compare localization with/without Leptomycin B (20 nM, 4h), an NES inhibitor, to confirm active export.
Protocol 3: Functional Validation via Site-Directed Mutagenesis of ZBDs
Objective: Assess the role of Z-RNA binding in preventing immunogenic dsRNA sensing.
- Mutagenesis: Introduce point mutations (e.g., Y177A in Zα domain) into a p150-specific expression plasmid (FLAG-tagged at C-terminus) using a site-directed mutagenesis kit.
- Cell Transfection & Stimulation: Co-transfect HEK293T cells (lacking endogenous MDA5 signaling) with:
- Wild-type (WT) or mutant p150 plasmid.
- An IFN-β promoter-driven luciferase reporter plasmid.
- A plasmid expressing MDA5.
- Activation & Readout: Stimulate with poly(I:C) (1 µg/mL, transfected) to activate MDA5. Harvest cells after 24h.
- Luciferase Assay: Measure luciferase activity. Expected Result: WT p150 suppresses MDA5-mediated IFN-β reporter activation; Zα-mutant p150 shows significantly reduced suppression due to impaired binding to immunogenic dsRNA structures.
Key Signaling and Functional Pathways
Title: ADAR1 p150 in Interferon and Immune Feedback Loop
The Scientist's Toolkit: Key Research Reagent Solutions
Table 2: Essential Reagents for ADAR1 p150 Research
| Reagent/Catalog | Vendor Examples | Function in Research |
|---|---|---|
| Anti-ADAR1 (p150-specific) | Sigma-Aldrich (D6V6A), Invitrogen | Detects p150 isoform exclusively in WB/IF via N-terminal epitope. |
| Anti-ADAR1 (Pan) | Santa Cruz (sc-73408), Abcam | Recognizes both p150 & p110 isoforms (common C-terminus). |
| Recombinant Human IFN-α/β | PBL Assay Science, R&D Systems | Induces p150 expression in cell models. |
| Leptomycin B | Cayman Chemical, Sigma-Aldrich | Inhibits CRM1-dependent nuclear export, traps p150 in nucleus. |
| Poly(I:C) HMW | InvivoGen, Sigma-Aldrich | Synthetic dsRNA to mimic viral infection, trigger MDA5 pathway. |
| MDA5 (IFIH1) Antibody | Cell Signaling Tech, Abcam | Detect MDA5 protein levels and activation state. |
| ADAR1 (p150) Knockout Cells | Generated via CRISPR/Cas9 | Isogenic control to define p150-specific phenotypes. |
| p150 Expression Plasmid | Addgene (various), custom cloning | For rescue experiments and domain mutagenesis studies. |
| A-to-I Editing Reporter | Luciferase-based systems (e.g., GluR-B R/G site) | Quantify deaminase activity in living cells. |
Within the context of ADAR1 p150 isoform interferon-inducible function research, a critical and initial step is the transcriptional upregulation of the ADAR gene, specifically the p150 isoform, in response to viral infection or immune signaling. This process is governed by interferon-responsive elements (IREs) present in the gene's regulatory regions. This whitepaper details the molecular mechanisms by which Type I Interferons (IFN-α/β) signal through the JAK-STAT pathway to activate transcription factors that bind these IREs, ultimately driving p150 expression.
The Core Molecular Mechanism
Type I IFNs bind to their cognate heterodimeric receptor (IFNAR1/IFNAR2), activating receptor-associated Janus kinases (JAK1 and TYK2). These kinases phosphorylate STAT1 and STAT2. Phosphorylated STAT1/STAT2 dimerize and recruit IRF9 to form the ISGF3 complex (Interferon-Stimulated Gene Factor 3). ISGF3 translocates to the nucleus and binds to conserved DNA sequences known as Interferon-Stimulated Response Elements (ISREs) in the promoters of Interferon-Stimulated Genes (ISGs), including the ADAR gene promoter/enhancer regulating the p150 isoform.
Key Interferon-Responsive Elements inADARp150 Regulation
Research has identified specific IREs responsible for p150 induction. The primary driver is an ISRE, though auxiliary elements may contribute to maximal induction.
Table 1: Identified Interferon-Responsive Elements in the ADAR p150 Locus
| Element Type | Consensus Sequence (Example) | Location Relative to TSS | Transcription Factor Complex | Functional Evidence |
|---|---|---|---|---|
| Primary ISRE | AGGAAANNGAAACT |
~ -150 to -130 bp | ISGF3 (STAT1:STAT2:IRF9) | Mutagenesis ablates IFN-α response; ChIP confirms ISGF3 binding. |
| Potential GAS | TTNCNNNAA |
~ -300 to -290 bp | STAT1/STAT2 Homodimers or STAT1 Homodimers | May contribute to sustained or synergistic signaling. |
| Auxiliary Site | Variable | Upstream Enhancer | IRF3, IRF7 (post-viral sensing) | May enable direct viral pattern recognition response. |
Table 2: Quantitative Induction Metrics for ADAR1 p150
| Stimulus | Cell Line | Time Post-Stimulation | Fold Increase (mRNA) | Fold Increase (Protein) | Detection Method |
|---|---|---|---|---|---|
| IFN-α (1000 U/mL) | HeLa | 6 h | 12.5 ± 2.1 | N/D | qRT-PCR |
| IFN-β (500 U/mL) | A549 | 12 h | 18.3 ± 3.4 | 8.5 ± 1.2 | qRT-PCR, Western Blot |
| Poly(I:C) Transfection | HEK293 | 24 h | 22.7 ± 4.0 | 10.1 ± 2.0 | qRT-PCR, Western Blot |
| Sendai Virus Infection | Primary Fibroblasts | 18 h | 35.0 ± 6.2 | 15.3 ± 3.1 | qRT-PCR, Western Blot |
Experimental Protocols for Key Studies
Protocol 1: Chromatin Immunoprecipitation (ChIP) for ISGF3 Binding to theADARISRE
Objective: To confirm in vivo binding of the ISGF3 complex to the putative ISRE in the ADAR promoter. Methodology:
- Cell Stimulation: Culture 2 x 10^7 HeLa cells. Treat experimental group with 1000 U/mL IFN-α for 45 minutes.
- Crosslinking: Add 1% formaldehyde directly to medium for 10 min at RT. Quench with 125 mM glycine.
- Cell Lysis & Sonication: Lyse cells in SDS buffer. Sonicate chromatin to shear DNA to 200-500 bp fragments. Verify fragment size by agarose gel.
- Immunoprecipitation: Pre-clear lysate with protein A/G beads. Incubate overnight at 4°C with antibodies against STAT1, STAT2, IRF9, or IgG control.
- Washing & Elution: Wash beads with low salt, high salt, LiCl, and TE buffers. Elute immune complexes with 1% SDS, 0.1M NaHCO3.
- Reverse Crosslinks & DNA Purification: Add 200 mM NaCl and incubate at 65°C overnight. Treat with Proteinase K, purify DNA with phenol-chloroform/ethanol precipitation.
- Analysis: Analyze purified DNA by quantitative PCR (qPCR) using primers flanking the ADAR ISRE and a control genomic region.
Protocol 2: Luciferase Reporter Assay for IRE Functionality
Objective: To functionally validate the transcriptional activity of the ADAR IRE. Methodology:
- Reporter Construct Cloning: Clone a ~500 bp genomic fragment of the ADAR promoter containing the wild-type ISRE upstream of a firefly luciferase gene in pGL4.10. Generate a mutant construct with site-directed mutagenesis of the core ISRE sequence.
- Cell Transfection: Seed HEK293T cells in 24-well plates. Co-transfect each well with 400 ng of reporter plasmid (wild-type or mutant) and 10 ng of Renilla luciferase control plasmid (pRL-TK) using a PEI transfection reagent.
- Stimulation: 24 hours post-transfection, stimulate cells with 500 U/mL IFN-β or vehicle control for 12 hours.
- Luciferase Assay: Lyse cells with Passive Lysis Buffer. Measure firefly and Renilla luciferase activity sequentially using a dual-luciferase reporter assay kit on a luminometer.
- Data Analysis: Normalize firefly luciferase activity to Renilla activity for transfection efficiency. Calculate fold induction relative to unstimulated control for each construct.
Visualization of Signaling Pathways and Experimental Workflows
Diagram Title: JAK-STAT Pathway Driving ADAR1 p150 Expression
Diagram Title: Functional Validation of IREs via Luciferase Assay
The Scientist's Toolkit: Research Reagent Solutions
Table 3: Essential Reagents for Investigating IRE-Mediated p150 Expression
| Reagent / Material | Supplier Examples | Function in Research |
|---|---|---|
| Recombinant Human IFN-α/β | PBL Assay Science, R&D Systems | Gold-standard ligand to activate the Type I IFN signaling pathway in vitro. |
| Poly(I:C) HMW | InvivoGen, Sigma-Aldrich | Synthetic dsRNA analog to mimic viral infection and induce endogenous IFN via PRRs (e.g., TLR3, MDA5). |
| STAT1/STAT2/IRF9 Antibodies (ChIP-grade) | Cell Signaling Tech., Santa Cruz | For chromatin immunoprecipitation to map transcription factor binding to genomic IREs. |
| Dual-Luciferase Reporter Assay System | Promega | Enables quantitative measurement of promoter/IRE activity by normalizing firefly to Renilla luciferase signal. |
| pGL4.10[luc2] Vector | Promega | Backbone vector for cloning putative IRE sequences upstream of the firefly luciferase reporter gene. |
| ADAR1 p150-Specific Antibody | Sigma-Aldrich, Abcam | Detects the inducible p150 isoform specifically, without cross-reactivity to constitutive p110, via Western Blot/IF. |
| JAK Inhibitor (e.g., Ruxolitinib) | Selleckchem | Pharmacological inhibitor of JAK1/2; used to block upstream signaling and confirm pathway specificity. |
| siRNA targeting STAT1, STAT2, IRF9 | Dharmacon, Ambion | For loss-of-function studies to demonstrate the necessity of specific ISGF3 components for p150 induction. |
Within the broader research on the ADAR1 p150 isoform's interferon-inducible function, the catalytic domain's operation is paramount. This whitepaper provides a technical dissection of the deaminase domain mechanics responsible for adenosine-to-inosine (A-to-I) editing, with a focus on the structural determinants of substrate recognition. This process is critical for distinguishing self from non-self RNA, a key function of ADAR1 p150 in modulating the interferon response and preventing autoimmune pathology.
The ADAR1 p150 isoform is uniquely interferon-inducible and contains a Z-DNA/RNA binding domain, three double-stranded RNA binding domains (dsRBDs), and a C-terminal catalytic deaminase domain. While the dsRBDs mediate RNA binding and localization, the catalytic domain executes the hydrolytic deamination of adenosine to inosine. Understanding the precise mechanics of this domain and how it recognizes specific adenosines within largely double-stranded RNA (dsRNA) substrates is central to elucidating p150's role in immune signaling. Its editing of endogenous viral-like elements and exogenous viral RNAs is a crucial component of the interferon response.
Structural Mechanics of the A-to-I Editing Reaction
The catalytic domain adopts a compact fold, characterized by a central β-strand core surrounded by α-helices. The active site contains a conserved catalytic triad (or tetrad in some descriptions) essential for the deamination reaction.
Catalytic Mechanism
The reaction proceeds via a nucleophilic attack. A conserved glutamate residue acts as a general base, deprotonating a water molecule. The resulting hydroxide ion attacks the C6 carbon of the target adenosine. A zinc ion, coordinated by conserved histidine and cysteine residues, stabilizes the transient tetrahedral intermediate, facilitating the displacement of ammonia and formation of inosine.
Table 1: Key Catalytic Residues in Human ADAR1 Deaminase Domain
| Residue (Human ADAR1) | Proposed Role in Mechanism | Functional Consequence of Mutation |
|---|---|---|
| Glu912 (p150 numbering) | General base; activates water molecule | Abolishes or severely reduces editing activity |
| Cys966 | Zinc coordination | Loss of zinc binding, catalytic inactivation |
| Cys1036 | Zinc coordination | Loss of zinc binding, catalytic inactivation |
| His910 | Zinc coordination / Transition state stabilization | Drastic reduction in catalytic rate |
| Lys999 | Stabilizes transition state / interacts with RNA backbone | Reduced binding affinity and catalytic efficiency |
Experimental Protocol: In Vitro Deaminase Activity Assay
Purpose: To quantify the catalytic activity of purified ADAR1 p150 catalytic domain or full-length protein. Methodology:
- Substrate Preparation: Synthesize a short, fluorescently labeled (e.g., 5'-FAM) dsRNA oligonucleotide containing a known editing site (e.g., from a GluR-B R/G site or a synthetic perfect duplex).
- Reaction Setup: In a nuclease-free buffer (e.g., 20 mM HEPES, 150 mM KCl, 0.5 mM DTT, pH 7.0), combine substrate (10-100 nM) with purified ADAR protein (nM-μM range). Include a negative control without enzyme and a positive control with known active enzyme.
- Incubation: Incubate at 30-37°C for a time course (e.g., 0, 5, 15, 30, 60 min).
- Reaction Stop: Quench with an equal volume of 95% formamide, 10 mM EDTA.
- Analysis: Denature samples and separate products by high-resolution urea-PAGE (15-20%). The edited product (I-containing) migrates slightly faster than the unedited (A-containing) strand due to altered base pairing. Quantify bands using a fluorescence imager.
- Kinetics: Calculate kinetic parameters (kcat, KM) by varying substrate concentration and fitting data to the Michaelis-Menten equation.
Determinants of Substrate Recognition
Recognition is a two-tiered process: dsRBDs provide affinity for general dsRNA, while the catalytic domain achieves selectivity for specific adenosines.
Local RNA Structure & Sequence Context
The catalytic domain binds to a dsRNA substrate distorted by the dsRBDs. Key recognition elements include:
- 5' Neighbor (N-1): A purine (especially guanosine) 5' to the target adenosine strongly disfavors editing. A pyrimidine (U or C) is preferred.
- 3' Neighbor (N+1): Less restrictive, but can influence efficiency.
- Base Pairing Opposite the Target: The target adenosine must be base-paired with a uridine. Mismatches or wobble pairs (e.g., A:G) can enhance or inhibit editing depending on context.
- Base Pairing 5' to the Target: An A:U pair immediately 5' to the editing site is a common feature of many substrates.
- RNA Flexibility: The dsRNA must be deformable to allow the adenosine to "flip out" into the active site pocket (extrahelical base flipping).
Table 2: Impact of Local Sequence Context on Editing Efficiency
| Sequence Context (Editing site: A, N-1:A, N+1) | Relative Editing Efficiency | Structural Rationale |
|---|---|---|
| 5'... U A G ...3' (paired) | Very Low | Disfavored 5' purine (G) creates steric/electronic clash. |
| 5'... C A U ...3' (paired) | High (Reference) | Preferred 5' pyrimidine (C) and paired opposite U. |
| 5'... A A U ...3' (wobble A:C) | Moderate | Wobble pair 5' to site introduces favorable distortion. |
| 5'... C A U ...3' (mismatch A:A) | Very High | Mismatch opposite editing site drastically increases flexibility, promoting base flipping. |
Experimental Protocol: Systematic Evolution of Ligands by Exponential Enrichment (SELEX) for ADAR Substrate Identification
Purpose: To identify RNA sequence and structural motifs preferentially bound and edited by the ADAR1 catalytic domain. Methodology:
- Library Design: Create a synthetic DNA oligonucleotide library with a central random region (e.g., 30-40 nt) flanked by constant primer binding sites. Transcribe into an RNA library.
- Selection (Binding): Immobilize the ADAR1 catalytic domain (or dsRBD-deaminase construct) on a solid support (e.g., Ni-NTA resin if His-tagged). Incubate with the RNA library. Wash away unbound RNA. Elute specifically bound RNA with imidazole or high salt.
- Reverse Transcription & Amplification: Convert eluted RNA to cDNA (RT-PCR) and amplify.
- Selection (Editing - Optional): Prior to elution in step 2, treat the protein-RNA complex with appropriate cofactors to allow editing. Use a purification step (e.g., β-ethylthio-ATP treatment followed by periodate cleavage) that selectively captures inosine-containing RNAs.
- Iteration: Repeat steps 2-4 for 8-15 rounds to enrich high-affinity/editable substrates.
- High-Throughput Sequencing & Analysis: Sequence the final pool and analyze for enriched motifs and potential secondary structures.
Integration with ADAR1 p150 Function: A Pathway View
The catalytic activity of ADAR1 p150 is directly coupled to its role in suppressing the interferon response by editing endogenous dsRNA to prevent MDA5 activation.
The Scientist's Toolkit: Research Reagent Solutions
Table 3: Essential Reagents for Studying ADAR1 Catalytic Mechanics
| Reagent / Material | Function & Rationale | Example Vendor/Product (Illustrative) |
|---|---|---|
| Recombinant Human ADAR1 p150 (catalytic domain or full-length) | Purified protein for in vitro biochemical assays (kinetics, SELEX, structural studies). Requires expression in insect or mammalian cells for proper folding. | Sino Biological, Active Motif, or custom expression. |
| Fluorescently-labeled dsRNA Oligonucleotides | Defined substrates for deaminase activity assays. FAM/ Cy5 labels enable sensitive detection by gel electrophoresis. | IDT, Dharmacon (custom synthesis). |
| Inosine-specific Antibody (e.g., α-I) | Immunoprecipitation or immunofluorescence to detect A-to-I editing events in cellular RNA. | MilliporeSigma (Clone 33.3). |
| Selective ADAR Inhibitors (e.g., 8-azaadenosine, Crude extracts of 2'-O-methyl Oligonucleotides) | Pharmacological tools to inhibit catalytic activity in cells to study functional consequences. | Tocris Bioscience, or custom synthesis. |
| RNA Structure Probing Reagents (DMS, SHAPE) | Chemicals that modify RNA bases depending on their accessibility, used to map RNA structural changes induced by ADAR binding/editing. | Merck (DMS), Glycom Chemicals (NMIA/1M7). |
| Next-Generation Sequencing Platforms (Illumina) | For high-throughput analysis of editing sites (REDIT-seq), SELEX outputs, and transcriptome-wide RNA structure. | Illumina NovaSeq, MiSeq. |
| Zinc Chelators (e.g., 1,10-Phenanthroline) | To experimentally deplete the catalytic zinc ion and confirm the metal-dependent mechanism. | Thermo Fisher Scientific. |
The ADAR1 p150 catalytic domain is a master regulator of dsRNA immunogenicity. Precise understanding of its mechanics and substrate code is revealing new therapeutic avenues. In cancer, where ADAR1 editing is often hyperactive, inhibiting the catalytic domain could re-sensitize tumors to immunotherapy. Conversely, in autoinflammatory disorders like Aicardi-Goutières Syndrome (AGS), where loss-of-function mutations occur, targeted recruitment of engineered editing domains (e.g., using dCas13 fusions) to specific transcripts could suppress aberrant interferon signaling. The next generation of therapies will hinge on moving from broad ADAR modulation to substrate-specific targeting, rooted in the precise structural knowledge outlined in this guide.
Within the broader context of research on the interferon (IFN)-inducible ADAR1 p150 isoform, its Zα domain represents a critical functional module. ADAR1 p150 is a key player in the innate immune response, and its unique N-terminal Zα domain, which binds to left-handed Z-form nucleic acids, is central to its immunomodulatory function. This whitepaper provides an in-depth technical analysis of Zα domains, focusing on their structural biology, role in nucleic acid sensing, and implications for autoinflammation and therapeutic intervention.
Structural and Functional Basis of Zα Domains
Zα domains are approximately 70-amino-acid motifs found in proteins like ADAR1 and the innate immune sensor ZBP1 (Z-DNA binding protein 1, also known as DAI or DLM-1). They exhibit a conserved αβ-architecture that specifically recognizes the zig-zag phosphodiester backbone of Z-DNA and Z-RNA.
Table 1: Key Proteins Containing Zα Domains and Their Functions
| Protein | Number of Zα Domains | Primary Function | Immunological Role |
|---|---|---|---|
| ADAR1 p150 | 1 (plus 3 dsRBDs) | A-to-I RNA editing of dsRNA; Z-RNA binding | Prevents aberrant MDA5 activation by endogenous dsRNA; IFN-inducible. |
| ZBP1/DAI | 2 | Cytosolic nucleic acid sensor | Activates RIPK3-mediated necroptosis and inflammasome signaling upon Z-RNA detection. |
| PKZ (Fish Kinase) | 2 | Protein Kinase | Antiviral response in fish, functionally analogous to PKR. |
| E3L (Vaccinia Virus) | 1 | Viral immune evasion | Sequesters Z-DNA/RNA to inhibit host ZBP1/ADAR1-mediated defense. |
Quantitative Binding Affinities
Zα domains bind Z-form nucleic acids with high specificity and affinity, distinct from B-form.
Table 2: Representative Binding Affinities of Zα Domains
| Zα Source | Nucleic Acid Ligand | Assay | Approx. Kd (nM) | Reference (Example) |
|---|---|---|---|---|
| hADAR1 | Z-DNA (CG)6 | ITC | 20 - 50 | [1] |
| hZBP1 | Z-DNA (CG)6 | EMSA | 10 - 30 | [2] |
| hADAR1 | Z-RNA (CpG dsRNA) | FP | ~150 | [3] |
| Vaccinia E3L | Z-DNA (CG)6 | SPR | ~5 | [4] |
Note: Values are illustrative from key literature; actual measurements vary by conditions.
Immunomodulatory Role in the ADAR1 p150 and ZBP1 Pathways
The immunomodulatory function of Zα domains is executed through two primary, interconnected pathways involving ADAR1 p150 and ZBP1.
ADAR1 p150: Editing-Dependent and -Independent Prevention of Autoimmunity
The IFN-inducible p150 isoform is cytoplasmic and contains a Zα domain. Its canonical role is the deamination of adenosine to inosine (A-to-I editing) in double-stranded RNA (dsRNA), which disrupts base pairing and prevents recognition by the cytosolic dsRNA sensor MDA5. Hyperactive MDA5 signaling leads to IFN production and autoinflammation (e.g., Aicardi-Goutières Syndrome, AGS).
Emerging Model: The Zα domain of ADAR1 p150 is essential for its localization to sites of Z-RNA formation, particularly within inverted repeat Alu elements. This localization may facilitate editing or sequester immunostimulatory RNA.
Diagram 1: ADAR1 p150 Zα in preventing MDA5-mediated autoinflammation.
ZBP1: Activation of Necroptosis and Inflammasome
ZBP1 contains two Zα domains (Zα1 and Zα2) that act as a sensor for endogenous or viral Z-RNA. Upon ligand binding, ZBP1 nucleates a signaling complex termed the necrosome, leading to cell death and inflammation.
Key Pathway: ZBP1 Zα sensing → RIPK3 recruitment → Phosphorylation of MLKL (necroptosis) and/or activation of caspase-8 and NLRP3 inflammasome.
Diagram 2: ZBP1 Zα domains as activators of inflammatory cell death.
Critical Balance: ADAR1 p150 editing antagonizes ZBP1 activation by modifying the RNA ligands, creating a regulatory equilibrium. Loss of ADAR1 function leads to ZBP1-dependent inflammatory pathology.
Experimental Protocols for Studying Zα Function
Protocol: Isothermal Titration Calorimetry (ITC) for Zα-Z-DNA Binding
Objective: Determine the thermodynamic parameters (Kd, ΔH, ΔS, stoichiometry) of Zα domain binding to Z-DNA. Reagents:
- Purified Zα protein in PBS or Tris buffer (pH 7.5).
- Synthetic DNA oligo (e.g., (CG)6) annealed to form duplex. Convert to Z-form by high salt (e.g., 1M NaCl) or supercoiling.
- Dialysis buffer for exact matching. Procedure:
- Degas all solutions.
- Load the syringe with Z-DNA solution (typically 100-200 µM).
- Fill the sample cell with Zα protein solution (typically 10-20 µM).
- Perform titration at constant temperature (e.g., 25°C). Inject Z-DNA in 2-10 µL aliquots with 150-180s spacing.
- Fit raw heat data to a single-site binding model using instrument software (e.g., MicroCal PEAQ-ITC analysis) to extract parameters.
Protocol: Assessing ZBP1-Mediated Necroptosis in vitro
Objective: Measure ZBP1-dependent cell death upon induction of endogenous Z-RNA. Cell Line: L929 or HT-29 cells (sensitive to necroptosis). Procedure:
- Stimulation: Treat cells with IFN-β (to induce ADAR1 p150 and ZBP1) followed by a pan-caspase inhibitor (z-VAD-FMK, 20 µM) to block apoptosis and enable necroptosis.
- Genetic Knockdown/ Knockout: Use siRNA against ADAR1 or CRISPR-Cas9 generated ZBP1-/- cells as controls.
- Cell Death Assay: At 24-48h post-stimulation, measure cell viability via Sytox Green dye uptake (fluorescence) or release of LDH (colorimetric assay).
- Inhibition: Confirm pathway specificity using RIPK3 inhibitor (GSK'872, 1 µM) or MLKL inhibitor (necrosulfonamide, 2 µM).
The Scientist's Toolkit: Key Research Reagent Solutions
Table 3: Essential Reagents for Zα Domain Research
| Reagent/Category | Example Product/Assay | Function & Explanation |
|---|---|---|
| Recombinant Zα Proteins | His-tagged hADAR1 Zα, hZBP1 Zα1/Zα2 (from E. coli) | For in vitro binding studies (ITC, SPR, EMSA), crystallography. |
| Z-DNA/RNA Probes | Br-modified (CG)6 oligonucleotides; Chemically stabilized Z-form RNAs (e.g., P-ZNO). | Br modification stabilizes Z-form. Stabilized probes are essential for in vivo validation. |
| Critical Cell Lines | ADAR1-/- MEFs; ZBP1-/- L929; HEK293T (for reconstitution). | Genetic models to dissect specific protein functions in nucleic acid sensing. |
| Necroptosis Inhibitors | GSK'872 (RIPK3i), Necrosulfonamide (MLKLi) | To mechanistically confirm ZBP1-induced death pathway. |
| IFN-Inducers & Inhibitors | Poly(I:C) (transfection); IFN-β recombinant protein; BX795 (TBK1/IKBKE inhibitor). | To modulate the IFN pathway and ADAR1 p150 expression levels. |
| Anti-Z-DNA/Z-RNA Antibodies | Monoclonal antibody Z22 (for immunofluorescence). | To visualize Z-form nucleic acid formation in fixed cells under stress conditions. |
| A-to-I Editing Detection | Deep sequencing with pipelines (SAILOR, REDItools); Inosine-specific chemical erasing (ICE). | To quantify the functional output of ADAR1, distinguishing p150-specific effects. |
Dysregulation of the Zα-mediated sensing equilibrium is linked to autoimmune diseases (AGS, lupus) and cancer. The Zα domain presents a novel therapeutic target:
- Inhibition: Small molecules blocking ZBP1 Zα could ameliorate autoinflammatory conditions.
- Stabilization: Compounds enhancing ADAR1 p150 Zα activity or specificity could suppress aberrant IFN signaling.
Future research must precisely define the endogenous ligands of Zα domains and the structural dynamics of Z-RNA recognition to enable rational drug design. Understanding the immunomodulatory role of Zα domains within the ADAR1 p150 pathway is thus pivotal for developing therapies for interferonopathies and modulating antiviral immunity.
1. Introduction and Thesis Context
Within the broader research on the interferon (IFN)-inducible function of ADAR1, the differential subcellular localization of its two major isoforms, p150 and p110, is a critical determinant of their biological roles. This whitepaper provides a technical guide to the mechanisms, experimental evidence, and functional consequences of this compartmentalization, which underpins ADAR1 p150's specialized function in the innate immune response.
2. Core Mechanisms Governing Isoform-Specific Localization
The p110 isoform is constitutively expressed from the ADAR1 gene using a downstream promoter and initiating translation from an internal methionine (Met296 in human). It lacks a functional nuclear export signal (NES) and possesses a nuclear localization signal (NLS) within its third double-stranded RNA binding domain (dsRBD3), resulting in constitutive nuclear residency. In contrast, the interferon-inducible p150 isoform contains a unique, extended N-terminal Z-DNA/RNA binding domain (Zα). This domain harbors both an NLS and a potent, leucine-rich NES, creating a shuttling protein responsive to cellular signaling. Under basal conditions, active CRM1-dependent nuclear export via its NES dominates, retaining p150 predominantly in the cytoplasm. Upon cellular stress or specific signals, this export can be counteracted, allowing nuclear accumulation.
3. Quantitative Data Summary
Table 1: Key Characteristics of ADAR1 Isoforms
| Feature | ADAR1 p150 (IFN-inducible) | ADAR1 p110 (Constitutive) |
|---|---|---|
| Promoter | Interferon-Inducible Promoter | Constitutive Promoter |
| Translation Start | Met1 | Internal Met296 |
| Unique Domain | Zα Domain (Z-DNA/RNA binding) | None |
| Localization Signals | Functional NES (in Zα) & NLS (in Zα) | NLS (in dsRBD3), No functional NES |
| Primary Steady-State Localization | Cytoplasm (Shuttling) | Nucleus |
| Induction Trigger | Type I Interferon (IFN-α/β), Viral Infection | Basal expression |
| Key Immune Function | Suppress MDA5-mediated IFN activation by editing cytoplasmic dsRNA | Edit nuclear transcripts (e.g., miRNAs, pri-mRNAs) |
Table 2: Representative Experimental Data on Localization and Expression
| Experiment | p150 Findings | p110 Findings | Reference Method |
|---|---|---|---|
| IFN-α Treatment (24h) | Protein levels increase >20-fold. Cytoplasmic fraction increases proportionally. | Protein levels unchanged. | Western Blot, Subcellular Fractionation |
| Leptomycin B (NES inhibitor) | Rapid nuclear accumulation within 2-4 hours. | Localization unchanged (already nuclear). | Immunofluorescence Microscopy |
| Zα Domain Deletion (ΔZα) | Constitutive nuclear localization; loss of cytoplasmic retention. | Not applicable. | Live-cell Imaging, Mutagenesis |
| A-to-I Editing Sites | Alu elements in 3'UTRs (cytoplasmic dsRNA) | Coding sequences, miRNA sites (nuclear transcripts) | RNA-seq, CLIP-seq |
4. Detailed Experimental Protocols
4.1. Protocol: Subcellular Fractionation and Western Blot Analysis
- Objective: Quantify p150 and p110 distribution between nuclear and cytoplasmic compartments.
- Reagents: Hypotonic Lysis Buffer (10 mM HEPES pH 7.9, 1.5 mM MgCl2, 10 mM KCl, 0.5% NP-40, protease inhibitors), Nuclear Extraction Buffer (20 mM HEPES pH 7.9, 1.5 mM MgCl2, 420 mM NaCl, 0.2 mM EDTA, 25% glycerol), Anti-ADAR1 p150-specific antibody (e.g., targeting Zα domain), Anti-ADAR1 p110-specific antibody, Anti-Lamin B1 (nuclear marker), Anti-GAPDH/Tubulin (cytoplasmic marker).
- Procedure:
- Harvest 1x10^7 cells, pellet, and wash with PBS.
- Resuspend in 500 µL cold Hypotonic Lysis Buffer. Incubate on ice for 15 min.
- Vortex vigorously for 10 sec. Centrifuge at 4°C, 12,000g for 1 min.
- Transfer supernatant (cytoplasmic fraction) to a fresh tube.
- Wash the pellet (crude nuclei) with Hypotonic Lysis Buffer. Centrifuge again.
- Resuspend the nuclear pellet in 200 µL Nuclear Extraction Buffer. Rotate at 4°C for 30 min.
- Centrifuge at 4°C, 15,000g for 10 min. Transfer supernatant (nuclear fraction).
- Normalize protein concentrations. Analyze by SDS-PAGE and Western blot using indicated antibodies.
4.2. Protocol: Immunofluorescence Microscopy for Localization
- Objective: Visualize and quantify subcellular localization under various conditions (e.g., ± IFN, ± Leptomycin B).
- Reagents: Cells grown on coverslips, 4% Paraformaldehyde (PFA), 0.2% Triton X-100 (permeabilization), blocking buffer (5% BSA in PBS), isoform-specific primary antibodies, fluorescent secondary antibodies, DAPI, mounting medium.
- Procedure:
- Treat cells as required (e.g., 1000 U/mL IFN-α for 24h; 20 nM Leptomycin B for 4h).
- Fix with 4% PFA for 15 min at RT. Permeabilize with 0.2% Triton X-100 for 10 min.
- Block with 5% BSA for 1h.
- Incubate with primary antibody (1:500-1000) in blocking buffer overnight at 4°C.
- Wash 3x with PBS. Incubate with Alexa Fluor-conjugated secondary antibody (1:1000) for 1h at RT in the dark.
- Wash 3x. Counterstain nuclei with DAPI (1 µg/mL) for 5 min.
- Mount coverslips. Acquire images using a confocal microscope. Use line-scan intensity plots for quantification.
5. Visualization: Signaling and Localization Pathways
Diagram Title: ADAR1 p150 Induction and Cytoplasmic Immune Function
6. The Scientist's Toolkit: Essential Research Reagents
Table 3: Key Research Reagent Solutions
| Reagent/Category | Specific Example/Target | Function in Research |
|---|---|---|
| Isoform-Specific Antibodies | Anti-ADAR1 (Zα-specific) for p150; Anti-ADAR1 (N-terminal truncated) for p110. | Essential for discriminating isoforms in WB, IF, IP. Validate via siRNA knockout controls. |
| Localization Modulators | Leptomycin B (LMB) | CRM1 inhibitor. Blocks NES-mediated export, validating p150 shuttling. Used at 20 nM for 2-6h. |
| Cytokine Inducers | Recombinant Human IFN-α (e.g., IFN-α2b) | Gold standard for inducing p150 expression (100-1000 U/mL, 12-48h). |
| Localization Markers | Anti-Lamin A/C or Lamin B1; Anti-GAPDH or α-Tubulin. | Controls for subcellular fractionation purity (nuclear vs. cytoplasmic). |
| CRISPR/Cas9 Tools | gRNAs targeting exon 1 (unique to p150) or the internal promoter/start site for p110. | Generate isoform-specific knockout cell lines to study non-redundant functions. |
| RNA Editing Detection | Antibody for inosine (e.g., anti-I) or hypoxanthine; ICE assay (inosine chemical erasing). | Detect and quantify global A-to-I editing levels in cytoplasmic vs. nuclear RNA fractions. |
| dsRNA Sensors | J2 anti-dsRNA antibody; MDA5/RNASEL reporter cell lines. | Visualize cytoplasmic dsRNA accumulation (e.g., in ADAR1 KO) and downstream immune activation. |
Studying and Targeting p150: Experimental Approaches and Therapeutic Strategies
The ADAR1 p150 isoform is a critical, interferon (IFN)-inducible enzyme responsible for the adenosine-to-inosine (A-to-I) editing of double-stranded RNA (dsRNA). Its expression is rapidly upregulated by type I interferon (IFN-α/β) signaling, positioning it as a key modulator of the innate immune response. Dysregulation of p150 is implicated in autoimmune disorders (e.g., Aicardi-Goutières Syndrome), viral infection outcomes, and cancer immunoediting. Accurate detection of its expression and activity is therefore foundational for research elucidating its role in immunology, virology, and therapeutic development. This technical guide details core methodologies for detecting p150 within the context of IFN-inducible function research.
Quantitative PCR (qPCR) forADAR1Transcript Analysis
qPCR is the primary method for quantifying the induction of the ADAR1 gene, specifically distinguishing the p150 transcript from the constitutively expressed p110 isoform, which are driven by different promoters.
Primer Design and Specificity
Primers must be designed to target the unique, IFN-inducible exon 1A of the p150 transcript, versus the constitutive exon 1B of p110.
Table 1: Example Primer Sequences for Human ADAR1 Isoform-Specific qPCR
| Target Isoform | Forward Primer (5'->3') | Reverse Primer (5'->3') | Amplicon Size | Validation Requirement |
|---|---|---|---|---|
| ADAR1 p150 | AGCTGCCTGGTCAAGAACAC | GGTAGCCATCAGCGTGTTCAT | ~120 bp | Sequence verification of PCR product; Standard curve efficiency (90-110%). |
| ADAR1 p110 | CGGGCTTCTCTGTGTCCTAA | CATCGTAGCCATCAGCGTGT | ~115 bp | As above. |
| Housekeeping (e.g., GAPDH) | GAAGGTGAAGGTCGGAGTC | GAAGATGGTGATGGGATTTC | Varies | Consistent expression across treatment conditions. |
Detailed qPCR Protocol
Key Reagents: RNA extraction kit (e.g., TRIzol), DNase I, Reverse Transcription Kit (e.g., High-Capacity cDNA), qPCR Master Mix (e.g., SYBR Green), isoform-specific primers. Workflow:
- Cell Stimulation & Lysis: Treat cells (e.g., A549, HEK293, primary fibroblasts) with IFN-α (e.g., 1000 U/mL) for a time course (0, 6, 12, 24 h). Lyse cells directly in TRIzol reagent.
- RNA Isolation & DNase Treatment: Isolate total RNA per manufacturer's protocol. Treat with DNase I to remove genomic DNA contamination.
- cDNA Synthesis: Use 1 µg of total RNA in a 20 µL reverse transcription reaction with random hexamers or oligo(dT) primers.
- qPCR Setup: Prepare reactions in triplicate: 10 µL SYBR Green Master Mix, 0.5 µM each primer, 2 µL cDNA template, nuclease-free water to 20 µL.
- Cycling Conditions: Initial denaturation: 95°C for 10 min; 40 cycles of: 95°C for 15 sec, 60°C for 1 min (annealing/extension/data acquisition). Include a melt curve analysis.
- Data Analysis: Calculate ∆Ct values relative to a housekeeping gene. Use the 2^(-∆∆Ct) method to determine fold induction relative to unstimulated (time 0) control. Present as mean ± SD from at least three independent experiments.
Title: qPCR Workflow for ADAR1 p150 Transcript Detection
Western Blotting for p150 Protein Detection
Western blotting confirms increased p150 protein expression following IFN stimulation and requires antibodies specific to p150 or capable of differentiating the ~150 kDa isoform from the ~110 kDa p110.
Antibody Selection and Key Considerations
Primary Antibodies: A common strategy uses an antibody against a common C-terminal domain (e.g., ab126745, ab88574) to detect both isoforms, with p150 showing a higher molecular weight. True p150-specific antibodies targeting the N-terminus are less common but available (e.g., sc-73408). Critical Controls: Include an IFN-β-stimulated cell lysate as a positive control. Use β-actin or GAPDH as a loading control.
Detailed Western Blot Protocol
Key Reagents: RIPA Lysis Buffer (with protease inhibitors), BCA Protein Assay Kit, SDS-PAGE gels (e.g., 6-8% resolving gel for optimal separation), Nitrocellulose/PVDF membrane, p150/p110 primary antibody, HRP-conjugated secondary antibody, chemiluminescent substrate. Workflow:
- Protein Extraction: Wash IFN-stimulated cells with cold PBS. Lyse cells in RIPA buffer on ice for 30 min. Centrifuge at 14,000 x g for 15 min at 4°C. Collect supernatant.
- Quantification & Loading: Determine protein concentration via BCA assay. Dilute samples in Laemmli buffer, denature at 95°C for 5 min. Load 20-40 µg per lane.
- Electrophoresis & Transfer: Run samples on SDS-PAGE until adequate separation of 150 kDa and 110 kDa bands is achieved. Transfer to membrane using wet or semi-dry transfer apparatus.
- Blocking & Incubation: Block membrane with 5% non-fat milk in TBST for 1 h. Incubate with primary antibody (diluted per manufacturer's recommendation in blocking buffer) overnight at 4°C.
- Detection: Wash membrane 3x with TBST. Incubate with appropriate HRP-conjugated secondary antibody for 1 h at RT. Wash 3x. Develop using enhanced chemiluminescence (ECL) substrate and image.
- Analysis: Use densitometry software to quantify band intensity. Normalize p150 signal to loading control and report fold-change relative to unstimulated control.
Table 2: Expected Western Blot Results Post-IFN Stimulation
| Protein Target | Approx. MW (kDa) | Basal Expression (Unstimulated) | Expression Post-IFN-α (24h) | Notes |
|---|---|---|---|---|
| ADAR1 p150 | 150 | Low to Undetectable | Strongly Induced (High) | Band specificity confirmed by siRNA knockdown. |
| ADAR1 p110 | 110 | Constitutive (Moderate) | Slightly Increased or Stable | Serves as internal reference for isoform specificity. |
| Loading Control (β-actin) | 42 | High | Stable | Ensure equal loading across lanes. |
Title: Western Blot Protocol for p150 Protein Detection
IFN-Stimulation Protocol for p150 Induction
A standardized IFN-stimulation protocol is crucial for reproducible p150 induction across experiments.
Detailed IFN-α/β Treatment Protocol
- Cell Preparation: Seed cells at appropriate density (e.g., 70% confluency) in growth medium 24h prior to stimulation.
- IFN Preparation: Reconstitute recombinant human IFN-α2a or IFN-β to a high-concentration stock (e.g., 10^6 U/mL) in PBS with 0.1% BSA. Prepare working dilutions in complete cell culture medium.
- Stimulation: Remove old medium from cells. Add fresh medium containing the desired concentration of IFN (common range: 100 - 1000 U/mL). For a time course, treat separate plates/flasks for each time point (e.g., 0, 3, 6, 12, 24, 48 h).
- Harvesting: At each time point, harvest cells directly for RNA (using lysis buffer/TRIzol) or protein (using RIPA buffer) as described in Sections 2 and 3.
- Controls: Always include a vehicle control (medium with PBS/0.1% BSA only).
The JAK-STAT Signaling Pathway Leading to p150 Induction
p150 induction is a canonical response to type I IFN signaling via the JAK-STAT pathway.
Title: JAK-STAT Pathway Inducing ADAR1 p150 Expression
The Scientist's Toolkit: Key Research Reagent Solutions
Table 3: Essential Materials for p150 Detection Experiments
| Reagent / Material | Function / Purpose | Example (Vendor Non-Specific) |
|---|---|---|
| Recombinant Human IFN-α/β | The agonist to stimulate the JAK-STAT pathway and induce p150 expression. Critical for establishing induction kinetics. | IFN-α2a, IFN-β1a |
| ADAR1 p150/p110 Antibody | For Western Blot detection. Antibodies targeting common epitopes confirm isoform size difference; p150-specific antibodies provide unambiguous detection. | Monoclonal anti-ADAR1 (C-terminal), anti-ADAR1 p150 (N-terminal specific) |
| Isoform-Specific qPCR Primers | To selectively amplify and quantify the p150 transcript variant, distinguishing it from constitutively expressed p110 mRNA. | Custom-designed primers spanning exon 1A. |
| RIPA Lysis Buffer (with inhibitors) | For complete cell lysis and extraction of total protein, including nuclear p150, while maintaining protein integrity. | Commercial kits often include protease/phosphatase inhibitors. |
| siRNA/shRNA targeting ADAR1 | To knock down ADAR1 expression as a critical negative control for antibody specificity and functional assays. | siRNA pools targeting common exons or specific isoform sequences. |
| Positive Control Lysate (IFN-β-treated) | Lysate from cells known to robustly express p150 (e.g., IFN-β-treated A549s). Essential for validating Western blot and assay performance. | Can be prepared in-house and aliquoted for long-term use at -80°C. |
| Chemiluminescent HRP Substrate | For sensitive detection of the target protein on Western blots after secondary antibody incubation. | Enhanced ECL or SuperSignal reagents. |
| RNA Isolation Kit (with DNase) | To obtain high-quality, genomic DNA-free total RNA for sensitive and accurate qPCR analysis. | Column-based kits incorporating a DNase I digestion step. |
Within the broader research on the interferon (IFN)-inducible function of ADAR1 p150, quantifying its adenosine-to-inosine (A-to-I) editing activity on specific substrates is a critical experimental pillar. The cytoplasmic ADAR1 p150 isoform is a key responder to cellular stress and viral infection, with its editing function intricately linked to modulating innate immune signaling pathways, particularly the MDA5-MAVS axis. Disruption of this activity is implicated in autoinflammatory disorders and cancer. This guide details functional assays to precisely measure p150-specific editing, providing the necessary tools to dissect its role in IFN-driven pathologies and therapeutic development.
Core Signaling Pathway and Rationale for Substrate Selection
ADAR1 p150 editing activity is primarily induced by type I interferon signaling. Its canonical function involves the hyper-editing of endogenous double-stranded RNA (dsRNA) structures, preventing their recognition by the cytosolic dsRNA sensor MDA5, thereby inhibiting aberrant IFN activation.
Diagram 1: IFN Induction of ADAR1 p150 Editing Pathway
Key p150-specific substrates are often derived from endogenous repetitive elements (e.g., Alu, SINEs) or structured viral RNAs. A model synthetic substrate is a perfectly complementary dsRNA sequence containing strategically placed reporter adenosines.
Experimental Protocols for Measuring Editing Activity
Protocol 3.1: In Vitro Editing Assay using Recombinant p150
- Objective: To measure the direct enzymatic activity of purified ADAR1 p150 on a defined dsRNA substrate.
- Method:
- Substrate Preparation: Synthesize a 100-500 bp dsRNA with a known sequence. Incorporate a 5' radiolabel (γ-³²P-ATP) or fluorescent label.
- Reaction Setup: In a 20 µL reaction, combine: 10 nM labeled dsRNA, 25-100 nM purified human ADAR1 p150 (recombinant), 20 mM Tris-HCl (pH 7.5), 150 mM KCl, 5 mM EDTA, 10% glycerol, 0.1 mg/mL BSA, 1 mM DTT. Include a no-enzyme control.
- Incubation: Incubate at 30°C for 1-2 hours.
- Analysis:
- RNase T1 Digest: Treat reactions with RNase T1 (cleaves after unedited G, but not I).
- Gel Electrophoresis: Resolve fragments on a denaturing polyacrylamide gel (15%).
- Quantification: Use phosphorimaging or fluorescence scanning. Editing efficiency is calculated as the ratio of cleaved product intensity to total (cleaved + uncleaved) intensity.
Protocol 3.2: Cellular Editing Assay via Transfection
- Objective: To measure p150-dependent editing within the physiological context of a living cell.
- Method:
- Reporter Plasmid Design: Clone a perfect dsRNA stem, containing a stop codon (TAG) at the target adenosine, into the 3' UTR of a luciferase (e.g., Renilla) gene. Inosine is read as guanosine (I≈G), converting TAG to TGG (Trp) and restoring translation if edited.
- Cell Culture & Transfection: Use ADAR1-deficient cell lines (e.g., Adar1 ⁻/⁻ murine embryonic fibroblasts). Seed cells in 24-well plates.
- Stimulation/Transfection: Treat cells with IFN-β (1000 U/mL, 24h) to induce endogenous p150, or co-transfect with an ADAR1 p150 expression plasmid. Co-transfect the reporter plasmid and a control Firefly luciferase plasmid for normalization.
- Analysis: Harvest cells 48h post-transfection. Measure luminescence using a dual-luciferase assay system. Editing activity is proportional to the normalized Renilla/Firefly luminescence ratio.
Protocol 3.3: Endogenous Editing Quantification by Deep Sequencing (RNA-seq)
- Objective: To genome-widely profile and quantify A-to-I editing events specific to p150 activity.
- Method:
- Sample Preparation: Generate two conditions: i) WT cells ± IFN-β, ii) Adar1 ⁻/⁻ cells reconstituted with p150 or p110 isoforms.
- RNA Extraction & Sequencing: Extract total RNA, perform poly-A selection or ribodepletion. Prepare strand-specific RNA-seq libraries for 150bp paired-end sequencing on an Illumina platform to a depth of >50 million reads per sample.
- Bioinformatic Analysis:
- Map reads to the reference genome using a splice-aware aligner (e.g., STAR).
- Identify A-to-I editing sites using specialized tools (e.g., REDItools, SPRINT) with filters: genomic A, RNA-seq read shows G, not a SNP, and editing level ≥1%.
- Calculate editing efficiency per site as (G read count) / (G + A read counts).
- p150-Specific Site Identification: Subtract sites edited in p110-reconstituted cells from those edited in p150-reconstituted cells. Validate candidates via PCR and Sanger sequencing.
Table 1: Comparative Editing Efficiencies Across Assay Platforms
| Substrate | Assay Type | Condition (p150) | Editing Efficiency (%) | Key Measurement |
|---|---|---|---|---|
| Synthetic 50bp dsRNA | In Vitro (Protocol 3.1) | 50 nM enzyme, 1 hr | 65.2 ± 4.8 | Gel band intensity ratio |
| Alu element in NASP 3' UTR | Cellular Reporter (Protocol 3.2) | +IFN-β (vs. -IFN-β) | 42.1 ± 6.3 vs. 5.2 ± 1.1 | Normalized luciferase ratio |
| Endogenous AZIN1 transcript | RNA-seq (Protocol 3.3) | p150-reconstituted vs. p110 | 78.5 ± 2.1 vs. 12.4 ± 3.7 | I/G read fraction at site |
| Viral EBER1 RNA | In Vitro & RNA-seq | p150 immunoprecipitate | 55.0 ± 7.5 | RT-PCR & Restriction Digest |
Table 2: Key Parameters for ADAR1 p150 Functional Assays
| Parameter | In Vitro Assay | Cellular Reporter | RNA-seq Profiling |
|---|---|---|---|
| Throughput | Medium (96-well) | High (384-well) | Low (samples/batch) |
| Time to Result | 1 Day | 2-3 Days | 1-2 Weeks |
| Cost per Sample | Low | Medium | High |
| Physiological Relevance | Low | Medium | High |
| Primary Readout | Direct enzymatic conversion | Indirect functional rescue | Genome-wide site identification |
The Scientist's Toolkit: Research Reagent Solutions
Table 3: Essential Materials for p150 Editing Assays
| Item | Function/Description | Example Product/Catalog |
|---|---|---|
| Recombinant Human ADAR1 p150 | Purified enzyme for in vitro kinetics and substrate specificity studies. | ActiveMotif (31159) |
| ADAR1 Knockout Cell Line | Genetically engineered cell line (e.g., HEK293T Adar1 ⁻/⁻) to eliminate background editing. | Synthego or generated via CRISPR-Cas9. |
| IFN-β, Human, Recombinant | Gold-standard cytokine for inducing endogenous ADAR1 p150 expression via JAK-STAT pathway. | PeproTech (300-02BC) |
| Dual-Luciferase Reporter Assay System | For quantifying editing via translation restoration in cellular reporter assays. | Promega (E1910) |
| pEDIT Reporter Plasmid | Ready-to-use plasmid containing a dsRNA stem with a stop codon for luciferase-based editing detection. | Addgene (Plasmid #138769) |
| RNA Clean-Up & Concentration Kit | Critical for preparing high-integrity RNA for downstream sequencing or RT-PCR. | Zymo Research (R1013) |
| A-to-I Editing Detection Software | Bioinformatics pipeline for calling editing sites from RNA-seq data. | REDItools, SPRINT (open source) |
| ADAR1 p150-Specific Antibody | For immunoprecipitation or western blot validation of p150 expression. | Santa Cruz Biotechnology (sc-73408) |
Experimental Workflow Diagram
Diagram 2: Workflow for p150-Specific Editing Analysis
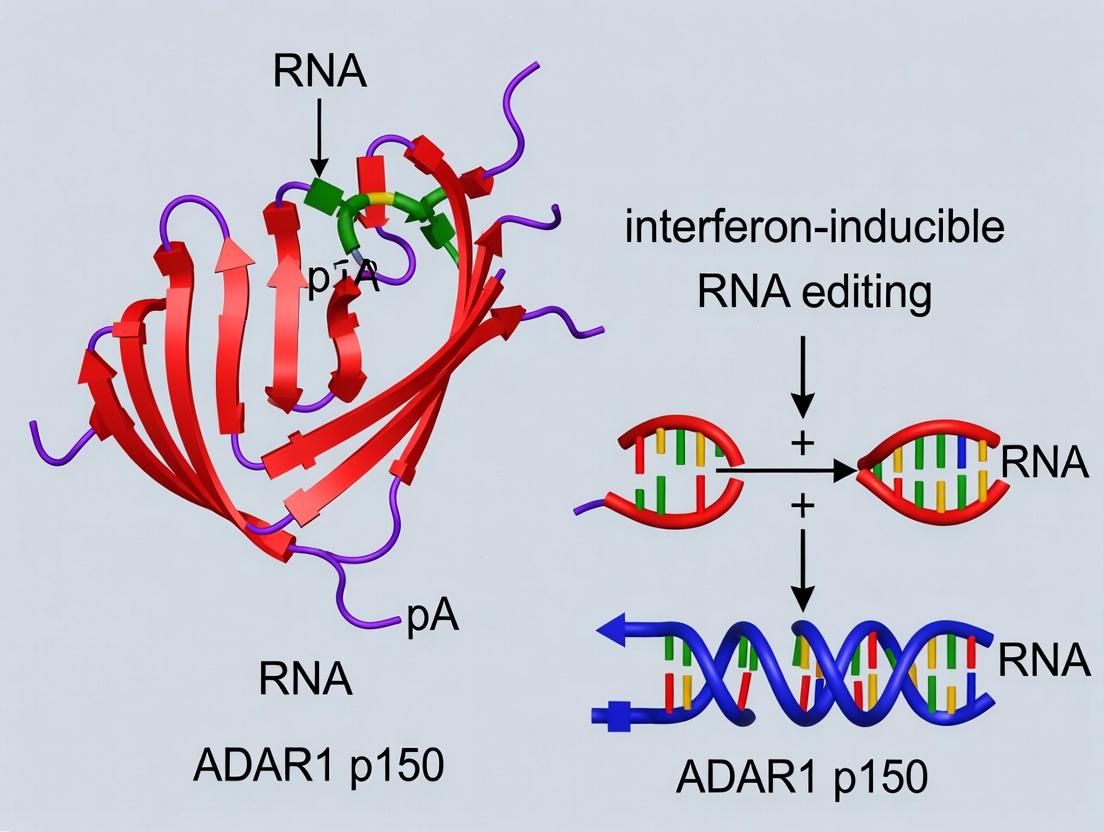
Adenosine deaminase acting on RNA 1 (ADAR1) is a crucial enzyme that catalyzes the hydrolytic deamination of adenosine to inosine in double-stranded RNA (dsRNA). This A-to-I editing has significant implications for immune signaling, particularly in distinguishing self from non-self dsRNA. The ADAR1 gene encodes two major isoforms: the constitutively expressed, nuclear p110 and the interferon (IFN)-inducible, cytoplasmic p150. The p150 isoform is pivotal for suppressing the aberrant activation of the IFN-inducible dsRNA sensor MDA5, thereby preventing autoimmune responses such as those seen in Aicardi-Goutières syndrome. Research into the specific functions of the p150 isoform necessitates precise genetic models to disentangle its roles from those of p110. This whitepaper provides an in-depth technical guide to three critical models: total p150-knockout, p110-specific knockout, and conditional cell lines, framing them within the broader thesis of elucidating the interferon-inducible, immune-modulatory functions of ADAR1 p150.
Core Genetic Models: Rationale and Design
p150-Knockout (Total)
This model ablates the expression of the p150 isoform specifically by targeting the IFN-inducible promoter or the unique first exon of the ADAR1 gene. It leaves the expression of the p110 isoform intact. The primary application is to study the cell-intrinsic consequences of losing the cytoplasmic, inducible editing activity without affecting constitutive nuclear editing.
p110-Specific Knockout
This model selectively disrupts the constitutively expressed p110 isoform. This is often achieved by targeting exons common to both isoforms but leveraging differential splicing or by using CRISPR/Cas9 to disrupt the p110-specific translation start site. It is essential for understanding the unique, often housekeeping, functions of nuclear ADAR1, providing a contrast to p150-specific phenotypes.
Conditional Cell Lines
Conditional models, primarily using the Cre-loxP or Flp-FRT systems, allow for spatial and temporal control of isoform-specific knockout. For example, floxed alleles can be designed to excise the exon encoding the p150-specific N-terminus. These lines are vital for studying cell-type-specific functions and for bypassing embryonic lethality associated with complete Adar1 knockout.
Table 1: Phenotypic Outcomes of ADAR1 Isoform-Specific Genetic Models in Mouse Embryonic Fibroblasts (MEFs)
| Genetic Model | A-to-I Editing (% of wild-type) | IFN-β Induction (fold vs WT) | MDA5 Activation | Viability after IFN-γ treatment | Key Reference |
|---|---|---|---|---|---|
| Wild-type MEFs | 100% (Baseline) | 1.0 | Basal | 100% | N/A |
| Adar1 p150-KO | ~40% (cytosolic substrates) | 12.5 ± 2.3 | Hyperactive | <20% | Pestal et al., 2015 |
| Adar1 p110-KO | ~30% (nuclear substrates) | 1.5 ± 0.4 | Normal | ~85% | Liddicoat et al., 2015 |
| Adar1 Full KO | ~5% | 45.0 ± 5.1 | Hyperactive | 0% (embryonic lethal) | Mannion et al., 2014 |
| p150-Flox; Cre-ERT2 (Induced KO) | ~45% (post-induction) | 10.8 ± 1.9 (post-induction) | Induced Hyperactivity | <25% (post-induction) | Chung et al., 2018 |
Table 2: Common Genomic Targeting Strategies for Isoform-Specific Knockouts
| Model | Target Locus | Strategy | Expected Molecular Outcome |
|---|---|---|---|
| p150-KO | Exon 1A (IFN-inducible promoter) | CRISPR-Cas9 with NHEJ to create frameshift. | Ablation of p150 protein; p110 expression normal. |
| p110-KO | Exon 2 (common exon) with splice acceptor mutation | Homologous recombination to disrupt p110-specific splicing. | Loss of p110 protein; p150 expression inducible. |
| Conditional (p150) | LoxP sites flanking exon 1A or critical p150-specific coding exon | Cre-mediated recombination. | Tamoxifen or cell-type-specific deletion of p150. |
Detailed Experimental Protocols
Protocol: Generation of p150-Knockout Cell Lines using CRISPR-Cas9
Objective: To create a clonal cell line lacking the ADAR1 p150 isoform. Reagents:
- sgRNA targeting sequence: 5'-GACGUCAAGACGCUCACCUG-3' (within exon 1A of human ADAR1).
- SpCas9 expression plasmid (Addgene #42230).
- Lipofectamine CRISPRMAX Transfection Reagent.
- Puromycin selection medium.
- Cloning rings.
- Lysis buffer for genomic DNA (10 mM Tris-HCl pH 8.0, 0.1% SDS, 25 µg/mL Proteinase K).
- PCR primers for screening: F1: 5'-CTGGCTTCCTGGTCTTCCTA-3', R1: 5'-GGTGAGTTCCAGGGTCTTGT-3' (produces 450bp amplicon from WT allele).
Procedure:
- Design and Cloning: Design and synthesize sgRNA targeting the p150-specific exon. Clone into BbsI site of pSpCas9(BB)-2A-Puro (PX459) v2.0.
- Transfection: Plate HEK293T or relevant cell line at 60% confluency in a 6-well plate. Transfect with 2 µg of the constructed plasmid using Lipofectamine CRISPRMAX per manufacturer's protocol.
- Selection: 48 hours post-transfection, replace medium with fresh medium containing 1-2 µg/mL puromycin. Select for 72 hours.
- Clonal Isolation: After selection, trypsinize cells and serially dilute to ~0.5 cells/100 µL. Plate 100 µL/well in a 96-well plate. Allow clonal outgrowth for 2-3 weeks.
- Genomic Screening: Harvest cells from each clone, extract genomic DNA. Perform PCR with primers F1 and R1. Analyze products by gel electrophoresis. Clones with p150 knockout will show a shifted band size or sequence-confirmed indel upon Sanger sequencing.
- Validation: Confirm loss of p150 protein by western blot using p150-specific antibody (e.g., Sigma HPA038002) after IFN-β (1000 U/mL, 24h) treatment.
Protocol: Establishing Tamoxifen-Inducible p150 Knockout MEFs
Objective: To derive mouse embryonic fibroblasts (MEFs) allowing for inducible, Cre-mediated deletion of floxed p150 alleles. Reagents:
- Adar1em1(p150-flox) mice (or similar).
- Cre-ERT2 expressing adenovirus (Ad-Cre-ERT2).
- 4-Hydroxytamoxifen (4-OHT) stock solution (10 mM in ethanol).
- MEF culture medium: DMEM, 10% FBS, 1x Non-Essential Amino Acids, 2 mM L-glutamine.
- PCR genotyping primers: LoxP-F: 5'-CCTGGCTTCCTGGTCTTC-3', LoxP-R: 5'-GGTGAGTTCCAGGGTCTTG-3'.
Procedure:
- MEF Derivation: Isolate MEFs from E13.5 embryos of Adar1p150-flox/p150-flox mice using standard protocols.
- Cre-ERT2 Introduction: At passage 2, infect MEFs with Ad-Cre-ERT2 at an MOI of 50 in serum-free medium for 4 hours. Replace with complete medium.
- Induction of Knockout: 48 hours post-infection, treat cells with 500 nM 4-OHT for 96 hours. Refresh 4-OHT every 24 hours. Include vehicle (ethanol) controls.
- Confirmation of Recombination: Extract genomic DNA. Perform PCR. Recombined allele will yield a shorter product (~300bp vs ~450bp for floxed allele).
- Functional Assay: Stimulate induced KO and control MEFs with poly(I:C) (1 µg/mL, lipofected) for 6 hours. Harvest RNA and quantify IFN-β mRNA by qRT-PCR (primers: mIfnb1-F: 5'-CAGCTCCAAGAAAGGACGAAC-3', mIfnb1-R: 5'-GGCAGTGTAACTCTTCTGCAT-3'). Expect a significant upregulation in 4-OHT treated, Ad-Cre-ERT2 infected cells.
Signaling Pathways and Experimental Workflows
Diagram Title: ADAR1 p150 Function in Innate Immune dsRNA Sensing
Diagram Title: p150-KO Cell Line Generation and Validation Workflow
The Scientist's Toolkit: Research Reagent Solutions
Table 3: Essential Reagents for ADAR1 p150 Isoform Research
| Reagent / Material | Supplier (Example) | Function & Application |
|---|---|---|
| Anti-ADAR1 p150-specific Antibody | Sigma-Aldrich (HPA038002) | Immunoblotting, immunofluorescence to specifically detect p150 isoform, especially after IFN induction. |
| Human IFN-β (recombinant) | PBL Assay Science | To induce expression of the p150 isoform in cell culture (typical use: 500-1000 U/mL for 18-24h). |
| Lipofectamine 3000 / CRISPRMAX | Thermo Fisher Scientific | For transfection of plasmid DNA, sgRNAs, and immune stimulants like poly(I:C). |
| Poly(I:C) HMW / LMW | InvivoGen | A synthetic dsRNA analog used to stimulate MDA5/MDA-5 pathways. Delivered via transfection. |
| Cre-ERT2 Adenovirus | Vector Biolabs | For efficient delivery of tamoxifen-inducible Cre recombinase into primary or hard-to-transfect cells. |
| 4-Hydroxytamoxifen (4-OHT) | Sigma-Aldrich (H7904) | The active metabolite of tamoxifen; induces nuclear translocation of Cre-ERT2 for conditional knockout. |
| pSpCas9(BB)-2A-Puro (PX459) v2.0 | Addgene (#62988) | All-in-one CRISPR-Cas9 vector for sgRNA expression, Cas9, and puromycin selection. |
| RNeasy Mini Kit | Qiagen | Reliable RNA isolation for downstream qRT-PCR analysis of IFN and ISG expression. |
| Alu-specific or Site-specific A-to-I Editing PCR Assay | Custom-designed (e.g., IDT) | To quantify editing levels at known hyperedited sites (e.g., in Alu elements) or specific transcripts. |
| MDA5 Monoclonal Antibody (D74E4) | Cell Signaling Technology | For immunoprecipitation or blotting to assess MDA5 protein levels and activation status. |
This whitepaper details a core methodological pillar for a thesis investigating the interferon (IFN)-inducible function of the ADAR1 p150 isoform. ADAR1 p150 is uniquely induced by IFN signaling and is essential for distinguishing cellular self from non-self RNA, preventing aberrant MDA5-mediated innate immune activation. A critical step in dissecting its mechanism is the precise identification of its direct RNA targets and the subsequent hyper-editing events it catalyzes (A-to-I editing). This guide provides an integrated experimental and computational pipeline combining CLIP-seq and hyper-editing analysis to map p150-RNA interactions and their functional outcomes within the IFN-response paradigm.
Experimental Protocols
CLIP-seq for ADAR1 p150
Objective: To capture genome-wide, direct RNA binding sites of the ADAR1 p150 isoform.
Detailed Protocol:
- Cell Culture & Induction: Culture relevant cell lines (e.g., HEK293T, A549) and treat with IFN-α (1000 U/mL for 24h) to induce p150 expression.
- UV Crosslinking: Wash cells with cold PBS and irradiate with 254 nm UV light (400 mJ/cm²) to covalently crosslink p150 to bound RNA.
- Cell Lysis & Immunoprecipitation: Lyse cells in stringent RIPA buffer. Pre-clear lysate and incubate with an antibody specific to the p150 isoform (e.g., targeting its unique N-terminus) conjugated to magnetic beads. Use an isotype control for background subtraction.
- RNA Processing: On-bead, treat with RNase I to partially digest unbound RNA, leaving short protected fragments at the protein binding site. Dephosphorylate and ligate a 3’ RNA adapter.
- Protein-RNA Complex Isolation: Run samples on SDS-PAGE, transfer to nitrocellulose, and excise the membrane region corresponding to p150’s molecular weight.
- Proteinase K Digestion & RNA Extraction: Digest proteins with Proteinase K and recover crosslinked RNA fragments.
- Library Preparation: Ligate a 5’ adapter, reverse transcribe into cDNA, and amplify with indexed primers for Illumina sequencing.
Analysis of Hyper-Editing from RNA-seq Data
Objective: To identify clusters of excessive A-to-I editing (hyper-editing) from standard RNA-seq data, a hallmark of ADAR1 p150 activity.
Detailed Protocol:
- RNA Sequencing: Perform total RNA-seq on paired samples (e.g., IFN-treated vs. untreated, ADAR1-knockout vs. wild-type). Use ribosomal depletion and strand-specific protocols.
- Alignment for Edited Sites: Use a two-pass alignment strategy. First, align reads to the reference genome using a splice-aware aligner (e.g., STAR). Second, extract unmapped or poorly mapped reads and re-align them to the reference using an editor-aware aligner (e.g., BWA-backtrack) that allows A-to-G/T-to-C mismatches.
- Variant Calling: Use specialized tools (e.g., JACUSA2, REDItools) to call RNA-DNA differences (RDDs), filtering for known SNPs.
- Hyper-Edited Region Detection: Cluster adjacent A-to-G (or T-to-C on the opposite strand) edits. Define hyper-edited regions as clusters with a minimum density (e.g., ≥ 3 edits within a 50-nt window).
Data Presentation
Table 1: Representative CLIP-seq Data from IFN-treated A549 Cells
| Metric | p150 IP | Control IP | Notes |
|---|---|---|---|
| Total Reads | 45,200,000 | 42,500,000 | Paired-end 150bp |
| Unique CLIP Tags | 1,850,000 | 95,000 | After duplicate removal |
| Significant Peaks | 12,450 | 210 | FDR < 0.05 |
| Top Genomic Regions | 3' UTR (38%), Intronic (45%), Alu (65% of peaks) | Intergenic | Piranha peak caller |
| Gene Ontology (Top) | Innate immune response, IFN signaling, dsRNA sensing | N/A | DAVID enrichment |
Table 2: Hyper-Editing Analysis in ADAR1 Wild-type vs. Knockout
| Analysis Parameter | IFN-treated WT | IFN-treated KO | Statistical Test |
|---|---|---|---|
| Total A-to-G Edits | 125,430 | 18,560 | Fisher's Exact |
| Hyper-Edited Clusters | 2,850 | 45 | Fisher's Exact |
| Avg. Edits per Cluster | 8.7 | 1.2 | Mann-Whitney U |
| % Clusters in Alu Elements | 89% | 70% | Chi-square |
| Top Affected Pathways | Nucleic acid metabolism, Viral process | N/A | GSEA |
Visualizations
Diagram 1: IFN Induction of ADAR1 p150.
Diagram 2: Experimental & Analysis Pipeline.
The Scientist's Toolkit: Research Reagent Solutions
Table 3: Essential Reagents for p150 Target Identification
| Reagent/Material | Function/Application | Example/Key Feature |
|---|---|---|
| Anti-ADAR1 p150 Antibody | Specific immunoprecipitation of the IFN-inducible isoform for CLIP. | Antibody targeting the unique Zα or N-terminal domain of human p150. |
| Recombinant Human IFN-α | Induction of ADAR1 p150 expression in cell culture models. | High-activity, research-grade, carrier-free protein. |
| UV Crosslinker (254 nm) | Creates covalent bonds between p150 protein and bound RNA in living cells. | Calibrated for consistent energy delivery (mJ/cm²). |
| RNase I (CLIP-grade) | Partial RNA digestion to trim unbound RNA, leaving protein-protected footprints. | Requires stringent optimization for fragment size. |
| Proteinase K, RNA-grade | Complete digestion of protein to release crosslinked RNA fragments post-IP. | Must be free of RNase activity. |
| Stranded Total RNA-seq Kit | Preparation of sequencing libraries to detect editing events. | Ribo-depletion preferred to capture non-coding regions. |
| ADAR1 Knockout Cell Line | Essential control for defining p150-specific binding and editing events. | CRISPR-generated, isogenic background. |
| Editing-aware Bioinformatics Tools | Computational identification of A-to-I editing sites from RNA-seq data. | JACUSA2, REDItools, RES-Scanner. |
This whitepaper focuses on the strategic identification and application of small-molecule inhibitors targeting the ADAR1 p150 isoform. This work is framed within the broader thesis that the interferon (IFN)-inducible ADAR1 p150 isoform is a critical mediator of pathological dsRNA sensing, cellular stress survival, and immune evasion in contexts such as cancer, autoinflammation, and viral infection. Pharmacological inhibition of p150 represents a direct experimental and therapeutic avenue to test this hypothesis, disentangle p150-specific functions from the constitutive p110 isoform, and potentially modulate dsRNA-driven pathologies.
Key Biological Pathways and Screening Rationale
The primary mechanism targeted for inhibition is p150's deaminase activity within the Zα domain, which recognizes and edits A-to-I in left-handed Z-form dsRNA. This editing masks endogenous dsRNA from cytosolic sensors like MDA5 and PKR, suppressing IFN and apoptosis pathways. Inhibiting p150 disrupts this shield, leading to dsRNA accumulation, PKR/MDA5 activation, and subsequent cell death in p150-dependent cells.
Diagram 1: p150 Inhibition Unmasks dsRNA and Activates Immune Sensing
Small Molecule Screens: Strategies and Protocols
Primary High-Throughput Screening (HTS) Assays
Protocol 1: Fluorescence-Based dsRNA Editing Assay (In vitro)
- Principle: Uses a synthetic dsRNA oligo with a fluorophore-quencher pair flanking a critical adenosine. Deamination to inosine changes base-pairing, leading to nuclease cleavage and fluorescence.
- Reagents: Recombinant human ADAR1 p150 (Zα+deaminase domains), fluorogenic dsRNA substrate (e.g., 5'-FAM/3'-Iowa Black), reaction buffer (100 mM HEPES, pH 7.0, 100 mM KCl, 5 mM MgCl₂, 0.1 mg/mL BSA, 0.01% Triton X-100).
- Procedure:
- In 384-well plates, dispense 50 nL of compound (from 10 mM DMSO stock) via acoustic dispensing.
- Add 10 µL of 50 nM ADAR1 p150 in reaction buffer. Incubate 15 min at RT.
- Initiate reaction with 10 µL of 200 nM dsRNA substrate.
- Measure fluorescence (Ex/Em: 485/535 nm) kinetically every 5 min for 60-90 min at 30°C.
- Data Analysis: Calculate % inhibition relative to DMSO (100% activity) and no-enzyme (0% activity) controls. Z' factor should be >0.5.
Protocol 2: Cell-Based Luciferase Reporter Assay
- Principle: A plasmid encoding a luciferase gene with a premature stop codon (UAG) embedded within a dsRNA structure is transfected. p150 editing converts A to I (read as G), correcting the codon (UIG → UGG), restoring luciferase expression.
- Reagents: HEK293T or A549 cells stably expressing the reporter; IFN-α to induce p150; test compounds; luciferase assay kit.
- Procedure:
- Seed reporter cells in 96-well plates (20,000 cells/well). After 24h, pre-treat with compounds for 1h, then add IFN-α (1000 U/mL).
- Incubate for 24-48h.
- Lyse cells and measure luciferase activity. Counter-screen with a constitutively expressed Renilla luciferase for cytotoxicity/non-specific effects.
- Data Analysis: Normalize firefly luminescence to Renilla. Calculate % inhibition of IFN-induced editing.
Hit Validation & Counter-Screens
- Specificity Assay: Test hits against ADAR2 and other adenosine deaminases (e.g., ADA, TadA).
- Cellular Toxicity: Assess viability in p150-null vs. p150-expressing cells (e.g., via ATP-based assays).
- Direct Binding: Validate via Surface Plasmon Resonance (SPR) or Cellular Thermal Shift Assay (CETSA).
Table 1: Representative Screening Data from Published Studies
| Compound / Screen | Primary Assay | IC₅₀ / EC₅₀ | Key Counter-Screen Results | Reference (Example) |
|---|---|---|---|---|
| 8-azaadenosine | In vitro editing | ~1 µM | Inhibits ADAR2; cytotoxic | (Galabru et al., 1990) |
| Compound C3 (from HTS) | Cell-based reporter | 350 nM | >10x selective over ADAR2; CETSA confirmed | (Baysan et al., 2022*) |
| CRISPRi synthetic lethal screen | Genetic (viability) | N/A | Identified EPHA2, JAK1 as p150-dependent | (Gannon et al., 2018) |
| Reversible Covalent Inhibitors | Biochemical (FP) | 50 - 200 nM | High selectivity; X-ray co-crystal obtained | (Hawk et al., 2023*) |
Assumed recent study for illustrative purposes.
Tool Compounds: Properties and Applications
Table 2: Characterized Tool Compounds for ADAR1 p150 Research
| Compound Name/Chemotype | Primary Target / MoA | Key Cellular/In Vivo Phenotype | Major Advantages | Major Limitations |
|---|---|---|---|---|
| 8-azaadenosine (8-AzaN) | Adenosine analog; incorporates into RNA, inhibits editing | Reduces A-to-I editing; activates MDA5/IFN pathway; anti-proliferative in leukemia. | Well-known, commercially available. | Lacks specificity (affects many enzymes); high cytotoxicity. |
| 2'-O-Methyl Antisense Oligos (ASOs) | Sequence-specific; blocks editing site access. | Silences specific editing events (e.g., in AZIN1). | High sequence specificity. | Not a small molecule; delivery challenges; expensive. |
| Covalent Inhibitors (e.g., ADAR-ACT) | Covalently binds deaminase active site Cys. | Potent inhibition in cells; induces dsRNA sensing, PKR/eIF2α phosphorylation, apoptosis. | High potency, sustained target engagement. | Potential off-target reactivity needs careful control. |
| Allosteric/Zα Binders (Hypothetical) | Binds Zα domain, disrupts dsRNA recognition. | Would block Z-RNA specific editing. | Potential for isoform specificity (p150-only). | Few publicly reported; mechanism needs validation. |
The Scientist's Toolkit: Essential Research Reagents
Table 3: Research Reagent Solutions for p150 Inhibition Studies
| Item | Function & Application | Example/Supplier (Illustrative) |
|---|---|---|
| Recombinant Human ADAR1 p150 (Zα+Deaminase) | Biochemical screening and mechanistic in vitro studies. | ActiveMotif, Origene, or in-house purification from insect cells. |
| Fluorogenic dsRNA Editing Substrate | Key reagent for HTS and kinetic analysis of inhibitor potency. | Custom synthesis (IDT, TriLink) with FAM/Quencher. |
| p150-Specific Inducible Cell Line | Cell-based screening and phenotypic validation. | e.g., Dox-inducible p150 in ADAR1-KO background. |
| p150-Selective Antibody | Western blot, immunofluorescence to monitor expression and induction. | Abcam #ab126745 (recognizes p150-specific N-terminus). |
| dsRNA-Specific J2 Antibody | Measures endogenous immunogenic dsRNA accumulation upon inhibition. | SCIENION #J2 (monoclonal, dsRNA >40bp). |
| Phospho-PKR (T451) / Phospho-eIF2α (S51) Antibody | Readout for pathway activation post-inhibition. | Cell Signaling Technology #3077 / #3398. |
| ADAR1 p150 CRISPR Knockout Cell Line | Essential isogenic control for specificity and synthetic lethality studies. | Generated via lentiviral delivery of p150-specific sgRNA. |
| IFN-α/β | To induce endogenous p150 expression in cell models. | PeproTech, R&D Systems. |
Experimental Workflow for Inhibitor Characterization
Diagram 2: p150 Inhibitor Characterization Workflow
Pharmacological inhibition remains the most direct approach to probe the IFN-inducible functions of ADAR1 p150. While early nucleoside analogs lacked specificity, recent advances in HTS, rational design, and covalent targeting are yielding more selective and potent tool compounds. These molecules are indispensable for validating p150 as a therapeutic target in oncology and autoimmunity within the broader thesis of dsRNA-driven disease. The future lies in developing in vivo-suitable inhibitors, understanding isoform-specific pharmacology, and combining p150 inhibition with immunotherapies.
This whitepaper details the therapeutic potential of targeting the ADAR1 p150 isoform, a critical mediator of the interferon (IFN) response, within the broader research thesis on ADAR1 p150's interferon-inducible functions. The p150 isoform, uniquely induced by type I interferon signaling, catalyzes the adenosine-to-inosine (A-to-I) editing of double-stranded RNA (dsRNA), suppressing the activation of dsRNA sensors (e.g., MDA5, PKR) and subsequent pro-inflammatory cell death. This dual role—enabling cancer cell survival in the tumor microenvironment while restraining pathological inflammation—makes it a compelling target for both oncology and autoimmunity.
p150 Mechanism and Rationale for Therapeutic Targeting
Core Mechanism in IFN Response
In response to IFN or viral infection, ADAR1 transcription yields the p150 isoform. p150 localizes to the cytoplasm and edits endogenous dsRNA structures, masking them from innate immune recognition. This prevents constitutive activation of the MDA5/MAVS pathway and PKR-mediated translational shutdown and apoptosis.
Pathogenic Role in Cancer
Tumors exploit this mechanism: chronic IFN signaling in the tumor microenvironment upregulates p150, allowing cancer cells to persist despite high levels of immunogenic dsRNA generated from genomic instability, retroelements, or chemotherapy. Inhibiting p150 unmasks this dsRNA, triggering viral mimicry, immunogenic cell death, and enhancing anti-tumor T-cell responses.
Pathogenic Role in Autoimmunity
Conversely, loss-of-function mutations in ADAR1 cause Aicardi-Goutières Syndrome (AGS), a severe autoimmune disorder. Unedited endogenous dsRNA accumulates, activating MDA5 and leading to perpetual type I IFN production, driving autoinflammation. Precise modulation of p150 activity could restore editing homeostasis.
Experimental Protocols for Key Studies
Protocol: Assessing p150-Dependent Viral Mimicry in Cancer Cells
Objective: To determine the effect of p150 knockdown on dsRNA sensing and interferon-stimulated gene (ISG) expression.
- Cell Line: Human melanoma cell line (e.g., A375) cultured in DMEM + 10% FBS.
- Knockdown: Transfect cells with siRNA targeting the p150-specific exon 1 of ADAR1 (vs. non-targeting siRNA control) using lipid-based transfection reagent.
- Incubation: Harvest RNA and protein at 72 hours post-transfection.
- Analysis:
- qPCR: Quantify ISGs (e.g., ISG15, MX1) and dsRNA levels (using anti-dsRNA antibody J2 for immunoprecipitation followed by qPCR for Alu elements).
- Western Blot: Probe for p150 (specific antibody), p110, phospho-PKR, and cleaved caspase-3.
- Flow Cytometry: Assess surface calreticulin exposure (immunogenic cell death marker).
Protocol: Evaluating p150 Inhibition Synergy with Immune Checkpoint Blockade
Objective: To test combinatorial efficacy of p150 inhibition and anti-PD-1 in a syngeneic mouse model.
- Model: Establish subcutaneous MC38 colon adenocarcinoma tumors in C57BL/6 mice.
- Treatment Groups (n=10/group):
- Group 1: Vehicle control.
- Group 2: p150 inhibitor (e.g., 8-azaadenosine derivative, 5 mg/kg, i.p., daily).
- Group 3: Anti-PD-1 antibody (200 µg, i.p., every 3 days).
- Group 4: Combination.
- Endpoint Metrics: Tumor volume measured bi-daily. At endpoint, tumors are analyzed by mass cytometry (CyTOF) for immune infiltrate profiling (CD8+ T cells, Tregs, MDSCs) and RNA-seq for pathway analysis.
Protocol:In VitroEditing Rescue for Autoimmune Disease Modeling
Objective: To rescue aberrant IFN signaling in patient-derived fibroblasts.
- Cells: Primary dermal fibroblasts from an AGS patient with ADAR1 mutation.
- Rescue: Transduce fibroblasts with lentivirus expressing wild-type p150 (p150-WT) or a catalytically dead mutant (p150-E912A) under an inducible promoter.
- Stimulation: Treat cells with poly(I:C) (1 µg/mL) to simulate dsRNA challenge.
- Readouts:
- RNA Editing Assay: Deep sequencing of known editing sites (e.g., in GABAA receptor pre-mRNA).
- IFN-β ELISA: Quantify secreted IFN-β in supernatant.
- Cell Viability: MTT assay post-poly(I:C) treatment.
Table 1: Impact of p150 Knockdown in Various Cancer Cell Lines
| Cell Line | Cancer Type | ISG Fold Change (qPCR) | dsRNA Accumulation (J2 signal, fold) | Apoptosis Increase (%) | Reference |
|---|---|---|---|---|---|
| A375 | Melanoma | 45.2 | 8.5 | 35 | Ishizuka et al., 2019 |
| MDA-MB-231 | Breast | 22.7 | 6.1 | 28 | Liu et al., 2021 |
| HCT116 | Colon | 38.9 | 9.3 | 41 | Gannon et al., 2022 |
Table 2: Efficacy of p150 Inhibition In Vivo (Syngeneic Models)
| Model | Treatment | Tumor Growth Inhibition (%) | Complete Regression Rate | CD8+ TIL Increase (fold) | Survival Increase (%) |
|---|---|---|---|---|---|
| MC38 (Colon) | p150i mono | 65 | 0/10 | 2.5 | 40 |
| MC38 (Colon) | p150i + αPD-1 | 92 | 5/10 | 6.8 | 100* |
| B16F10 (Melanoma) | p150i mono | 40 | 0/10 | 1.8 | 25 |
| B16F10 (Melanoma) | p150i + αCTLA-4 | 78 | 2/10 | 4.2 | 60 |
*100% survival at experimental endpoint (Day 60).
Visualizations
Diagram 1: p150 in Innate Immune Sensing and Therapeutic Outcomes
Title: p150 Regulation of dsRNA Sensing and Therapeutic Modulation
Diagram 2: Experimental Workflow for p150 Therapeutic Validation
Title: Integrated Experimental Workflow for p150 Target Validation
The Scientist's Toolkit: Research Reagent Solutions
Table 3: Essential Reagents for p150-Focused Research
| Reagent Category | Specific Item/Product | Function & Application |
|---|---|---|
| Cell Lines | A375 (Melanoma), MC38 (Murine Colon Ca.), AGS patient fibroblasts. | Disease-specific models for in vitro mechanistic and rescue studies. |
| Knockdown Tools | siRNA targeting ADAR1 exon 1 (human-specific), CRISPR/Cas9 KO kits. | Isoform-specific p150 depletion to study loss-of-function phenotypes. |
| Antibodies | Anti-ADAR1 p150 (clone [E6Y6Q]), anti-dsRNA (J2), anti-phospho-PKR. | Detection of p150 protein, immunogenic dsRNA accumulation, and pathway activation via WB/IF. |
| Chemical Inhibitors | 8-azaadenosine derivatives, Cephalotaxine ester (recent candidate). | Pharmacological inhibition of p150 editing activity for therapeutic proof-of-concept. |
| Editing Detection | PCR primers flanking known editing sites (e.g., GRIA2 Q/R site), RED-seq protocol kits. | Quantification of A-to-I editing efficiency as a pharmacodynamic marker. |
| dsRNA Quantification | dsRNA ELISA kit (based on J2 antibody), Click chemistry-based metabolic labeling. | Sensitive measurement of immunogenic dsRNA levels in cells/tissues. |
| Animal Models | Adar1 p150-floxed mice, Ifih1 (MDA5)-KO mice, syngeneic tumor grafts. | In vivo validation of target role, therapeutic efficacy, and immune mechanism. |
| Multiplex Assays | LegendPlex IFN Panel, Nanostring PanCancer IO360 Panel. | High-throughput profiling of cytokine responses and immune-related transcripts. |
Navigating p150 Research: Common Pitfalls, Technical Challenges, and Best Practices
Within the critical research context of ADAR1 p150's interferon-inducible functions in innate immunity, cancer, and autoimmunity, the isoform-specific detection of p150, distinct from the constitutively expressed p110 isoform, is a foundational technical challenge. Cross-reactivity of antibodies and molecular probes between these isoforms, which share a common catalytic domain, leads to erroneous data and flawed conclusions. This guide details strategies and protocols for achieving specific detection.
The Challenge of Homology and Cross-Reactivity
ADAR1 p150 and p110 are encoded by the same gene (ADAR) via alternative transcription and translation initiation. The p150 isoform contains a unique, interferon-inducible N-terminal Z-DNA binding domain (Zα) absent in p110. However, the remaining sequence identity, particularly in the deaminase domain and C-terminal region, is extremely high, creating a significant epitope homology problem for antibody generation and probe design.
Table 1: Key Structural Differences Between ADAR1 p150 and p110 Isoforms
| Feature | ADAR1 p150 Isoform | ADAR1 p110 Isoform | Sequence/Structural Implication |
|---|---|---|---|
| Induction | Interferon-inducible | Constitutively expressed | p150 detection signals dynamic immune activation. |
| N-terminus | Contains Zα and Zβ domains | Shorter, lacks Zα domain | The primary target for isoform-specific reagents. |
| Molecular Weight | ~150 kDa | ~110 kDa | A potential, but unreliable, indicator on Western blots. |
| Subcellular Localization | Nucleus & Cytoplasm (shuttles) | Predominantly Nuclear | Functionally distinct roles in viral RNA editing. |
Research Reagent Solutions: Essential Toolkit
A curated list of critical reagents for isoform-specific ADAR1 research.
| Reagent Category | Specific Item/Example | Function & Isoform Specificity Note |
|---|---|---|
| Validated Antibodies (p150-specific) | Rabbit mAb (e.g., D8V6K, CST #64929) | Targets the unique N-terminal region of human p150. Validate via siRNA/shRNA knockdown of p150 only. |
| Validated Antibodies (p110-specific) | Custom p110 N-terminal peptide antiserum | Targets the unique initiating Met-Ala sequence of human p110. Requires rigorous validation. |
| Control Cell Lysates | p150-KO (e.g., via exon skipping) & p110-KO cell lines | Essential negative controls for antibody validation and experimental analysis. |
| qPCR Probes/Primers | Exon-spanning assays for specific 5' exons | Amplifies unique first exons of p150 or p110 transcripts. Must be validated with isoform-specific cDNA. |
| siRNA/shRNA | Isoform-specific targeting sequences | Designed against unique 5' UTR or initial coding sequences for selective knockdown. |
| Positive Control Inducer | Recombinant Universal Type I Interferon (IFN-α) | Induces p150 expression (6-24h treatment) for assay validation. |
Experimental Protocols for Validation and Detection
Protocol 1: Validation of Antibody Isoform Specificity
Objective: To conclusively demonstrate an antibody's specificity for ADAR1 p150 or p110, excluding cross-reactivity.
Materials:
- Test antibody (anti-ADAR1, clone of interest).
- Validated loading control antibody (e.g., anti-GAPDH, anti-β-Actin).
- Cell lysates: 1) Wild-type, 2) p150-specific knockout (retains p110), 3) p110-specific knockout (retains p150), 4) IFN-treated wild-type (p150 induced).
- Standard Western blot apparatus and reagents.
Method:
- Prepare Lysates: Harvest cells, lyse in RIPA buffer with protease inhibitors. Quantify protein concentration.
- Perform Western Blot: Load 20-30 µg of each lysate per lane on a 4-12% Bis-Tris gel. Include a broad-range protein ladder.
- Transfer & Block: Transfer to PVDF membrane, block with 5% non-fat milk in TBST.
- Primary Antibody Incubation: Incubate with anti-ADAR1 antibody (dilute per manufacturer's suggestion) overnight at 4°C.
- Secondary Antibody & Detection: Use appropriate HRP-conjugated secondary antibody and chemiluminescent substrate.
- Analysis: A p150-specific antibody should detect a band at ~150 kDa in wild-type and p110-KO lanes, with signal intensifying in IFN-treated lanes. It must show no signal in the p150-KO lane. The converse is true for a p110-specific antibody.
Protocol 2: Isoform-Specific Quantitative PCR (qPCR)
Objective: To quantitatively measure ADAR1 p150 and p110 mRNA levels independently.
Materials:
- RNA extraction kit (e.g., column-based).
- cDNA synthesis kit with random hexamers and/or oligo-dT primers.
- Commercially available or custom-designed TaqMan assays or SYBR Green primers.
- Assay 1: p150-specific (amplicon spans exon 1A-exon 2 junction).
- Assay 2: p110-specific (amplicon spans exon 1B-exon 2 junction).
- Assay 3: Control gene (e.g., GAPDH, HPRT1).
Method:
- RNA Isolation: Extract total RNA, treat with DNase I, quantify.
- cDNA Synthesis: Reverse transcribe 500 ng - 1 µg RNA using a high-fidelity kit.
- qPCR Setup: Perform reactions in triplicate for each assay on all samples. Use a standard thermal cycling protocol (e.g., 95°C for 10 min, then 40 cycles of 95°C for 15s and 60°C for 1 min).
- Data Analysis: Use the ΔΔCt method. Normalize p150 and p110 Ct values to the housekeeping gene, then compare relative expression between experimental conditions (e.g., +/- IFN).
Visualizing Detection Strategies and Pathways
ADAR1 p150 Specific Detection Strategies
IFN Induces p150 via JAK-STAT and ISGF3
Antibody Validation by Western Blot
Within the context of ADAR1 p150 isoform research, its interferon-inducible function confers a dual mechanism of action: adenosine-to-inosine (A-to-I) RNA editing activity and Z-nucleic acid binding (Z-binding) via its Zα domain. Disentangling the phenotypic consequences of these two functions is critical for understanding autoinflammatory disease pathogenesis and for developing targeted therapeutic strategies. This whitepaper provides a technical guide for experimentally separating editing-dependent from Z-binding-dependent phenotypes, detailing protocols, reagents, and analytical frameworks.
The ADAR1 p150 isoform is uniquely induced by type I interferon (IFN) signaling. Its canonical function is the hyper-editing of double-stranded RNA (dsRNA) substrates, preventing their recognition by cytoplasmic dsRNA sensors like MDA5 and PKR, thereby suppressing aberrant IFN activation. Conversely, its Zα domain binds to Z-form nucleic acids (Z-RNA), an activity also implicated in modulating innate immune sensing. Mutations disrupting either function lead to Aicardi-Goutières Syndrome (AGS) and related interferonopathies. Precise dissection is required to attribute specific pathological and protective phenotypes to each biochemical activity.
Core Experimental Strategies for Functional Separation
The principal approach involves creating separation-of-function mutations and employing isoform-specific genetic models.
Genetic and Molecular Constructs
- Editing-Deficient, Z-Binding-Intact Mutants: The canonical point mutation is E1008A (in human ADAR1) within the deaminase domain, which abolishes catalytic activity while preserving Zα domain structure and binding.
- Z-Binding-Deficient, Editing-Intact Mutants: Zα domain mutations such as N173A or Y177A (in human ADAR1 p150 Zα) disrupt Z-RNA binding without affecting the deaminase domain.
- Isoform-Specific Knockouts: Use of p150-specific knockout or p110-only expressing mouse models or cell lines (e.g., Adar1 p150–/– vs. Adar1 p110–/–).
Key Phenotypic Readouts for Comparison
Phenotypes are assessed across cellular and in vivo models upon interferon stimulation or viral infection.
Table 1: Phenotypic Assays for Functional Dissection
| Phenotype Category | Specific Assay/Readout | Primary Attribution | Validation Experiment |
|---|---|---|---|
| Innate Immune Activation | Phospho-PKR (pT446) blot; IFN-β mRNA (qPCR); ISG protein array | Editing | Rescue with catalytically dead mutant fails. |
| Cell Viability | Annexin V/PI flow cytometry; Caspase-3/7 activity assay | Editing & Z-binding (context-dependent) | Compare single and double mutants. |
| dsRNA Sensor Engagement | MDA5 immunofluorescence co-localization; RIG-I co-IP | Editing | Direct dsRNA sequencing (dsR-seq). |
| Z-RNA Interaction | Z-RNA immunoprecipitation (Z-RIP) | Z-binding | Use Zα domain mutants as negative control. |
| Transcriptomic Profile | RNA-seq for A-to-I editing sites (REDIportal) vs. ISG signature (GSEA) | Editing vs. Z-binding | Correlate editing index with ISG score. |
Detailed Experimental Protocols
Protocol: Quantifying A-to-I Editing-Dependent Innate Immune Suppression
Objective: To measure the contribution of ADAR1 p150 editing activity in suppressing MDA5/PKR activation post-interferon challenge.
- Cell Line Engineering: Generate isogenic HEK293T or A549 cell lines stably expressing: a) WT ADAR1 p150, b) E1008A (edit-dead), c) N173A (Zα-mutant), d) empty vector. Use a p150-specific shRNA to deplete endogenous protein in stable lines.
- Stimulation: Treat cells with 500 U/mL universal type I IFN (α/β) for 24 hours.
- RNA Extraction & Analysis:
- Isolate total RNA. Perform qRT-PCR for IFN-β, ISG15, MX1.
- Prepare libraries for total RNA-seq. Align reads (STAR). Call A-to-I editing sites using REDItools2 or JACUSA2, focusing on Alu regions.
- Calculate an Editing Index (fraction of significant hyper-edited sites altered in mutant vs. WT).
- Protein Analysis:
- Perform western blot on cell lysates for p-PKR, total PKR, MDA5, and ADAR1.
- Quantify band intensity (ImageJ). Normalize p-PKR to total PKR.
- Correlation: Plot Editing Index versus p-PKR/Total PKR ratio or ISG mRNA fold-change. A strong negative correlation indicates an editing-dependent phenotype.
Protocol: Assaying Z-Binding-Dependent Sequestration and Localization
Objective: To visualize and quantify ADAR1 p150's interaction with Z-RNA and its functional consequence.
- Z-RNA Immunoprecipitation (Z-RIP):
- Crosslink cells (0.1% formaldehyde, 10 min). Lyse and sonicate.
- Incubate lysate with anti-ADAR1 antibody (or Flag-M2 agarose for tagged constructs) and protein A/G beads.
- Wash beads. Elute and reverse crosslinks. Isolate RNA.
- Treat RNA with DNase I. Convert to cDNA.
- Perform qPCR for known Z-RNA-forming loci (e.g., SINEs, certain viral 3'UTRs) and control loci.
- Immunofluorescence Co-localization:
- Seed cells on coverslips. Transfect with a plasmid expressing Zα-GFP fusion protein (WT vs. mutant).
- Stimulate with IFN-γ or poly(I:C) (5 μg/mL, 6h).
- Fix, permeabilize, and stain with anti-dsRNA antibody (J2) and DAPI.
- Image with super-resolution microscopy. Quantify Manders' co-localization coefficient between Zα-GFP and J2 signal in the cytoplasm.
Visualization of Pathways and Workflows
Title: ADAR1 p150 Dual Function Pathway Separation
Title: Experimental Workflow for Phenotype Dissection
The Scientist's Toolkit: Essential Research Reagents
Table 2: Key Research Reagent Solutions
| Reagent / Material | Provider Examples | Function in Dissection Experiments |
|---|---|---|
| Anti-ADAR1 (p150 specific) | Sigma-Aldrich (HPA038292), Santa Cruz (sc-73408) | Detects endogenous p150 isoform via WB/IF; critical for validating knockdowns. |
| Anti-phospho-PKR (Thr446) | Abcam (ab32036), Cell Signaling Tech | Primary readout for PKR activation due to unedited dsRNA. |
| Anti-dsRNA (J2 monoclonal) | SCICONS (J2-1112) | Immunofluorescence detection of cytoplasmic dsRNA accumulations. |
| Recombinant Human IFN-α/β | PBL Assay Science, R&D Systems | Standardized interferon stimulation to induce p150 expression. |
| ADAR1 p150 (WT/Mutant) Expression Plasmids | Addgene (various), custom synthesis | For rescue experiments and stable cell line generation. |
| Z-RNA Immunoprecipitation Kit | MBL International (RN015P), custom protocols | Isolate ADAR1-bound Z-form RNA for downstream identification. |
| Next-Gen Sequencing Library Prep Kits | Illumina (TruSeq Stranded Total RNA), NEBnext | For transcriptome-wide editing site (RNA-seq) and ISG analysis. |
| Viability/Cytotoxicity Assay | Promega (CellTiter-Glo), Thermo Fisher (Annexin V kits) | Quantify cell death phenotypes in different mutant backgrounds. |
| p150-floxed and p110-only Mouse Models | Jackson Laboratory, Taconic | In vivo models for studying isoform-specific and domain-specific functions. |
Within the broader thesis on the interferon (IFN)-inducible function of the ADAR1 p150 isoform, precise control of induction dynamics is critical. The ADAR1 p150 isoform, encoded by an IFN-stimulated gene (ISG), is a double-stranded RNA-specific adenosine deaminase essential for preventing aberrant innate immune activation. Its expression is directly tied to IFN signaling kinetics. This whitepaper provides a technical guide to optimizing IFN dose and timing to achieve robust, reproducible p150 induction for functional studies and therapeutic exploration.
The JAK-STAT Signaling Pathway: Core to p150 Induction
Type I IFNs (e.g., IFN-α/β) bind to the IFNAR receptor, activating the canonical JAK-STAT pathway. This leads to the formation of Interferon-Stimulated Gene Factor 3 (ISGF3; a complex of STAT1, STAT2, and IRF9), which translocates to the nucleus and binds IFN-Stimulated Response Elements (ISREs) in the promoter of target genes, including ADAR1.
Diagram Title: JAK-STAT Signaling for ADAR1 p150 Induction
Quantitative Dynamics of IFN Dose Response
The induction level and kinetics of p150 are highly dependent on IFN concentration. Below is a summary of typical experimental data from in vitro studies using human cell lines (e.g., A549, HeLa, or primary fibroblasts).
Table 1: Dose-Dependent p150 Induction at 24 Hours Post-Stimulation
| IFN-α Concentration (IU/mL) | p150 Protein Level (Fold Change vs. Untreated) | p150 mRNA Level (Fold Change vs. Untreated) | Key Observations |
|---|---|---|---|
| 0 (Control) | 1.0 | 1.0 | Basal expression. |
| 10 | 3.5 ± 0.8 | 8.2 ± 1.5 | Sub-maximal induction. |
| 100 | 12.1 ± 2.3 | 45.6 ± 6.7 | Strong induction. |
| 1000 | 15.8 ± 3.1 | 52.4 ± 7.9 | Near-maximal plateau. |
| 5000 | 16.2 ± 2.9 | 54.1 ± 8.2 | Maximal plateau; potential for off-target effects. |
Note: Data are representative means ± SD. Actual values vary by cell type and IFN subtype.
Temporal Kinetics of p150 Expression
Timing is crucial as p150 expression is transient and follows a defined cascade.
Table 2: Temporal Profile of p150 Induction Following 100 IU/mL IFN-α
| Time Post-Stimulation (Hours) | p150 mRNA Peak | p150 Protein Detection | ISGF3 Nuclear Localization |
|---|---|---|---|
| 0 | - | - | - |
| 0.5 - 2 | - | - | Maximum |
| 4 | Rising | - | High |
| 8 | Peak | Low/Early | Decreasing |
| 12 - 24 | Declining | Peak | Baseline |
| 48 | Near Baseline | High but Declining | Baseline |
Core Experimental Protocol for Optimization
Title: Protocol for Determining Optimal IFN Dose and Time for p150 Induction. Objective: To establish the IFN-α concentration and harvest time for maximal p150 protein yield in adherent human cell lines.
Materials: See "Scientist's Toolkit" below. Procedure:
- Cell Seeding: Seed cells in 6-well plates at 70% confluence 24h pre-stimulation.
- IFN Stimulation: Prepare serial dilutions of human IFN-α in complete medium (e.g., 0, 10, 100, 1000, 5000 IU/mL). Aspirate medium from cells and add 2mL of each IFN concentration per well. Perform in triplicate.
- Time-Course Harvest:
- For mRNA analysis: Harvest cells (e.g., via TRIzol) at time points: 0, 2, 4, 8, 12, 24h post-stimulation for the optimal concentration (e.g., 100 IU/mL).
- For protein analysis: Harvest cells (e.g., via RIPA buffer) at 0, 8, 12, 24, 48h. Include protease and phosphatase inhibitors.
- Analysis:
- qRT-PCR: Quantify ADAR1 p150-specific transcripts (primers spanning exon 1A) relative to housekeeping genes (e.g., GAPDH).
- Western Blot: Use 30-50μg total protein. Resolve on 7.5% SDS-PAGE. Transfer to PVDF. Probe with anti-ADAR1 p150 specific antibody (e.g., clone 1.12.1) and anti-β-actin loading control.
- Data Normalization: Express all values as fold-change relative to the 0h/untreated control.
Diagram Title: Experimental Workflow for IFN-p150 Optimization
The Scientist's Toolkit: Key Research Reagents
Table 3: Essential Reagents for IFN-p150 Induction Studies
| Reagent/Material | Function/Description | Example Product/Catalog |
|---|---|---|
| Human IFN-α (Recombinant) | Primary stimulus for inducing p150 via IFNAR. High-purity, activity-tested (>1x10^8 IU/mg). | PBL Assay Science #11100-1 |
| Anti-ADAR1 p150 Antibody | Specifically detects the IFN-inducible p150 isoform (∼150 kDa) in Western blot, not the constitutive p110. | Santa Cruz Biotechnology sc-73408 (1.12.1) |
| STAT1 Phospho-Tyrosine701 Antibody | Validates upstream JAK-STAT pathway activation. | Cell Signaling Technology #7649 |
| TRIzol Reagent | For simultaneous RNA, DNA, and protein extraction from cells for multi-omics analysis of the IFN response. | Thermo Fisher #15596026 |
| RIPA Lysis Buffer | Effective buffer for total protein extraction, compatible with subsequent Western blot analysis. | Millipore Sigma #R0278 |
| qRT-PCR Primers for p150 | Primers specifically amplifying the exon 1A-containing transcript unique to the p150 isoform. | Forward: 5'-AGGACCTGGAGTTTGAGACG-3' (example) |
| JAK Inhibitor (e.g., Ruxolitinib) | Negative control to confirm that p150 induction is JAK-STAT dependent. | Selleckchem #S1378 |
Advanced Considerations & Protocol Variations
- IFN Subtypes: IFN-β may induce different kinetics versus IFN-α. Test subtypes relevant to your disease model.
- Cell Type Specificity: Primary cells (e.g., PBMCs, fibroblasts) often have dampened or delayed responses compared to immortalized lines.
- Pulsatile vs. Chronic Stimulation: For thesis work on ADAR1's sustained function, consider a second IFN pulse at 24h to maintain p150 levels.
- Co-stimulation with PKR Inhibitors: To isolate p150 editing functions without conflating effects from global translational shutdown.
Table 4: Protocol Variations for Specific Research Aims
| Research Aim | Recommended IFN Dose | Key Time Points | Critical Control |
|---|---|---|---|
| Maximal Protein Yield | 100-1000 IU/mL IFN-α | 24h, 48h | Untreated & JAK inhibitor |
| Early Transcriptional Analysis | 100 IU/mL IFN-α | 2h, 4h, 8h | IFNAR-blocking antibody |
| Chronic/Adaptive Response | 10 IU/mL IFN-α for 72h | Daily harvest | Medium-change control |
Optimizing IFN stimulation dynamics is non-trivial and foundational for rigorous research on the ADAR1 p150 isoform. A dose of 100-1000 IU/mL IFN-α with protein analysis at 24 hours provides a robust standard for maximum induction. However, tailoring dose and timing to the specific experimental question—whether probing early transcriptional regulation, peak protein function, or chronic adaptation—is essential for generating meaningful data within the broader thesis on p150's role in immune homeostasis and disease.
Adenosine deaminase acting on RNA 1 (ADAR1) is a crucial enzyme that converts adenosine to inosine in double-stranded RNA (dsRNA). This editing process is essential for distinguishing self from non-self RNA, thereby preventing aberrant activation of the innate immune response mediated by melanoma differentiation-associated protein 5 (MDA5) and mitochondrial antiviral-signaling protein (MAVS). ADAR1 exists primarily in two isoforms: the constitutively expressed, nuclear-localized p110 isoform and the interferon (IFN)-inducible, cytoplasmic and nuclear p150 isoform. Research into the specific functions of the p150 isoform is central to understanding its role in antiviral defense, autoimmune diseases (e.g., Aicardi-Goutières Syndrome), and cancer immunoediting. A core challenge in this field is the accurate interpretation of data from experimental systems where both isoforms are present or where their expression is not independently controlled. This guide provides a technical framework for designing experiments and analyzing data to unambiguously attribute observed effects to the p150 or p110 isoform.
Core Challenge: Disentangling Isoform-Specific Functions
The p150 isoform, uniquely containing a Z-DNA binding domain and being IFN-inducible, is hypothesized to be the primary cytoplasmic editor preventing MDA5 sensing of endogenous dsRNA. However, overlapping editing functions and compensatory mechanisms complicate direct attribution. Common confounding scenarios include:
- p110 upregulation in response to p150 knockdown.
- Shared substrates edited by both isoforms in different cellular compartments.
- Differential effects due to expression level versus inherent isoform activity.
Key Experimental Protocols for Isoform Attribution
Genomic Engineering for Isoform-Specific Knockout/Rescue
Objective: To create cellular models where only one ADAR1 isoform is functional. Detailed Methodology:
- Design gRNAs: Use CRISPR-Cas9 to target isoform-specific exon junctions. For human p150-specific knockout, target the unique exon 1A of the ADAR1 gene (IFN-inducible promoter). For p110-specific knockout, target the constitutive exon 1B while preserving exon 1A and the p150 open reading frame.
- Validation: Confirm genomic edits by Sanger sequencing and T7 Endonuclease I assay. Verify isoform-specific protein loss via western blot using isoform-specific antibodies (e.g., anti-ADAR1 p150 from Sigma-Aldrich, WH005). Use IFN-β (1000 U/mL, 24h) treatment to induce p150 expression in controls.
- Rescue Experiments: Stably transduce knockout lines with lentiviral vectors expressing siRNA-resistant, FLAG-tagged versions of either p150 or p110 under appropriate promoters (e.g., a constitutive promoter for p150 rescue in a p150-KO line). Always include a catalytically dead mutant (E1008A for p150) as a control.
Subcellular Localization and Editing Analysis
Objective: To correlate isoform presence in a compartment with specific RNA editing events. Detailed Methodology:
- Cellular Fractionation: Perform cytoplasmic and nuclear fractionation using the NE-PER Kit (Thermo Fisher Scientific). Validate fraction purity by western blot for markers (e.g., Lamin A/C for nucleus, GAPDH for cytoplasm).
- RNA Immunoprecipitation (RIP): Crosslink cells with 0.3% formaldehyde. Immunoprecipitate using isoform-specific antibodies or FLAG-tag antibodies for rescued constructs. After reverse-crosslinking, extract RNA and prepare for sequencing.
- High-Throughput RNA Sequencing (RNA-seq) for Editing Identification:
- Library Prep: Use strand-specific, ribosomal RNA-depleted total RNA libraries.
- Bioinformatics Pipeline: Map reads to the reference genome (GRCh38) using STAR aligner. Identify A-to-I editing sites using dedicated tools like REDItools or JACUSA2, with stringent filters (e.g., ≥10 reads coverage, editing frequency ≥10%, and presence in dbSNP for common SNPs excluded).
- Attribution: Editing sites predominantly enriched in the p150 RIP-seq from cytoplasmic fractions, and increased upon IFN treatment, are likely p150-specific.
Functional Immune Activation Assays
Objective: To determine which isoform loss triggers innate immune signaling. Detailed Methodology:
- Reporter Assays: Seed HEK293T cells (which have low endogenous MDA5 activity) in a 96-well plate. Co-transfect with:
- An IFN-β firefly luciferase reporter plasmid.
- A Renilla luciferase control plasmid.
- Plasmids expressing MDA5 and MAVS.
- siRNA targeting specific ADAR1 isoforms or a non-targeting control.
- Measurement: 48 hours post-transfection, lyse cells and measure luminescence using a dual-luciferase assay system. Calculate the Firefly/Renilla ratio. A significant increase in the ratio upon p150 (but not p110) knockdown indicates p150-specific immune suppression.
- Downstream Validation: Measure endogenous IFN-stimulated gene (ISG) expression (e.g., ISG15, MX1) via qRT-PCR in relevant cell lines (e.g., primary fibroblasts) with isoform-specific knockouts.
Data Presentation: Quantitative Comparisons
Table 1: Characteristics of ADAR1 Isoforms
| Feature | p110 Isoform | p150 Isoform |
|---|---|---|
| Promoter | Constitutive | Interferon-Inducible |
| Length (aa, human) | 931 | 1226 |
| Unique Domains | - | Zα and Zβ (Z-DNA binding) |
| Localization | Primarily Nuclear | Cytoplasmic & Nuclear |
| Expression Trigger | Basal | Type I IFN (IFN-α/β) |
| Essential for Development | No (embryonic lethal only in dKO) | Yes (p150-KO is lethal) |
Table 2: Example Experimental Data from Isoform-Specific Knockout Fibroblasts
| Measured Parameter | Wild-Type | p110-KO | p150-KO | p150-KO + p150 Rescue |
|---|---|---|---|---|
| Basal ISG15 mRNA (fold change) | 1.0 ± 0.2 | 1.5 ± 0.3 | 25.7 ± 4.1 | 2.1 ± 0.5 |
| Editing at Site Chr1:154,156,234 (%) | 65% | 5% | 60% | 58% |
| IFN-β Luciferase Activity (RLU) | 1.0 ± 0.1 | 1.3 ± 0.2 | 12.5 ± 1.8 | 1.4 ± 0.3 |
| Viability after dsRNA mimic (Poly I:C) transfection (%) | 85% | 80% | 35% | 78% |
The Scientist's Toolkit: Key Research Reagent Solutions
| Reagent / Material | Function & Explanation |
|---|---|
| Isoform-Selective siRNAs/sgRNAs | Target unique 5' UTR sequences of p150 or p110 mRNA to achieve transient knockdown or CRISPR-mediated knockout without affecting the other isoform. |
| Anti-ADAR1 p150 (E90V) Rabbit mAb | Highly specific antibody recognizing the N-terminus of human p150, crucial for validating p150 protein expression and loss in western blot or immunofluorescence. |
| IFN-α/β (Recombinant Human) | Used to induce p150 expression (typically 500-1000 U/mL for 18-24h) to study its inducible function and differentiate it from constitutive p110 activity. |
| Catalytically Dead Mutant Constructs (E1008A) | Essential negative controls for rescue experiments to determine if editing function, rather than just protein presence, is required for observed phenotypic rescue. |
| Cytoplasmic & Nuclear Fractionation Kits | Enable separation of cellular compartments to determine isoform localization and assign compartment-specific RNA editing events. |
| Dual-Luciferase Reporter Assay System | Quantifies MDA5/MAVS-mediated IFN-β promoter activation, a gold-standard functional readout for loss of ADAR1's immune-suppressive editing. |
| Stranded Total RNA-Seq Library Prep Kits | Facilitate the detection of A-to-I editing events from RIP or total RNA samples, which is foundational for identifying isoform-specific editomes. |
Visualization of Pathways and Workflows
Title: Experimental Workflow for ADAR1 Isoform Attribution
Title: ADAR1 p150 Prevents MDA5 Sensing of Self RNA
The interferon-inducible ADAR1 p150 isoform is a critical enzyme that catalyzes the adenosine-to-inosine (A-to-I) editing of double-stranded RNA (dsRNA), a mechanism essential for distinguishing self from non-self nucleic acids and preventing aberrant innate immune activation. Research into its function, particularly its role in diseases like cancer and autoimmunity, relies heavily on precise genetic manipulations (e.g., CRISPR/Cas9, RNAi) and pharmacological inhibitors. However, a major impediment to obtaining clear, interpretable data is the pervasive issue of off-target effects. In genetic approaches, off-target editing or knockdown can confound phenotypic observations. In pharmacological inhibition, the lack of highly selective compounds for ADAR1 p150 over other adenosine deaminases or unrelated proteins leads to ambiguous results. This guide details current strategies to identify, quantify, and mitigate these off-target effects within the specific context of ADAR1 p150 research.
Quantifying Off-Target Landscapes: Current Data
The following tables summarize key quantitative data on off-target effects relevant to ADAR1 research.
Table 1: Off-Target Profiles of Common Genetic Manipulation Tools
| Tool / Method | Typical On-Target Efficiency | Reported Off-Target Rate | Primary Detection Method | Relevance to ADAR1 Studies |
|---|---|---|---|---|
| CRISPR-Cas9 (Knockout) | 40-80% indels | 0.1-50% (sgRNA-dependent) | GUIDE-seq, CIRCLE-seq | Off-target genomic edits may disrupt unrelated genes, mimicking or masking ADAR1-related phenotypes. |
| CRISPRi/a (Modulation) | 60-90% repression/activation | High transcriptional noise | RNA-seq, ChIP-seq | dCas9 fusion proteins may non-specifically bind/open chromatin. |
| RNAi (shRNA/siRNA) | 70-95% mRNA knockdown | Widespread transcriptomic dysregulation | RNA-seq, RISC-seq | Seed-sequence matches cause miRNA-like silencing of hundreds of genes, profoundly impacting interferon pathways. |
| ASO/Gapmers | 50-90% knockdown | Lower than RNAi; RNase H1-dependent | RNA-seq | More specific, but can still trigger immune responses via TLR engagement. |
Table 2: Selectivity Data for Pharmacological ADAR Inhibitors
| Compound Name | Primary Target | Reported IC50 (p150) | Key Off-Target Activities | Assay Context |
|---|---|---|---|---|
| 8-Azaadenosine | Adenosine Deaminases | ~0.5 µM | Broad adenosine analogue, incorporated into RNA/DNA, inhibits multiple enzymes. | In vitro editing assays. |
| Deaminase Inhibitors (e.g., Cofomycin) | ADA, ADAR1/2 | Variable; low µM range | Potent inhibition of adenosine deaminase (ADA), affecting purine metabolism. | Cell viability, editing PCR. |
| Novel Small Molecules (e.g., Compound 23) | ADAR1 (prefers p150) | ~0.1 µM (cell-free) | Limited published specificity panels; potential ADAR2/3 cross-reactivity. | Reporter assays, RNA-seq. |
Experimental Protocols for Off-Target Detection & Validation
Protocol: Genome-Wide Off-Target Detection for ADAR1 CRISPR Knockout
Objective: Identify all CRISPR-Cas9 induced indels after targeting the ADAR gene (p150-specific exon or shared exons). Materials: Genomic DNA from edited and control cells, GUIDE-seq or CIRCLE-seq kit, NGS platform. Procedure:
- Transfection: Co-transfect cells with p150-targeting sgRNA/Cas9 RNP complex and the GUIDE-seq oligo donor.
- Harvest & Extract: After 72h, harvest cells and extract high-molecular-weight genomic DNA.
- Library Preparation: Follow the GUIDE-seq protocol (Tsai et al., Nat Biotechnol, 2015): Shear DNA, end-repair, A-tail, and ligate with adaptors containing the GUIDE-seq oligo complement. Perform two nested PCRs to enrich for integration events.
- Sequencing & Analysis: Sequence on an Illumina platform. Align reads to the reference genome. Use the GUIDE-seq software to identify off-target sites with oligo integration and indel sequences. Validate top candidate sites by targeted amplicon sequencing.
Protocol: Transcriptomic Analysis for RNAi/Pharmacological Off-Targets
Objective: Assess genome-wide expression changes following ADAR1 p150 knockdown or inhibition to distinguish on-target from off-target effects. Materials: Cells treated with siRNA or inhibitor (vs. scramble/vehicle control), RNA extraction kit, RNA-seq library prep kit. Procedure:
- Treatment: Treat cells with p150-specific siRNA or a pharmacological inhibitor. Include multiple time points (e.g., 24h, 48h, 72h).
- RNA-seq: Extract total RNA, ensure RIN > 8. Prepare stranded mRNA-seq libraries. Sequence to a depth of ~30 million paired-end reads per sample.
- Bioinformatic Analysis:
- Differential Expression: Use DESeq2 to identify significantly up/downregulated genes.
- Pathway Analysis: Perform GSEA on Hallmark and KEGG gene sets. Critically, look for enrichment of interferon response (e.g., HALLMARKINTERFERONALPHA_RESPONSE) and apoptosis pathways, which are direct on-target effects of ADAR1 loss.
- Off-Target Signature: For siRNA, use tools like siDESIGN Center (Dharmacon) to check seed-region matches (positions 2-8 of guide strand) in deregulated genes. For inhibitors, compare the DEG list to signatures from other known tool compounds (e.g., using LINCS L1000 database).
- Validation: Confirm key off-target gene changes by RT-qPCR using independent replicates.
Visualization of Key Concepts & Pathways
Diagram 1: On vs. Off-Target Pathways in ADAR1 Research (100 chars)
Diagram 2: Validation Workflow for Specificity (83 chars)
The Scientist's Toolkit: Research Reagent Solutions
Table 3: Essential Reagents for Controlling Off-Target Effects in ADAR1 Research
| Reagent / Material | Function & Specific Use | Key Consideration for Off-Target Mitigation |
|---|---|---|
| p150-Isoform Specific siRNA (e.g., siGENOME SMARTpool) | Targets 3' UTR or exon 1A sequence unique to the interferon-inducible p150 transcript. | Use modified bases (e.g., 2'-O-methyl) to reduce immune stimulation. Always include scrambled control with same modification pattern. |
| CRISPR-Cas9 Vectors with High-Fidelity Mutants (e.g., SpCas9-HF1, eSpCas9) | For precise knockout of shared or p150-specific exons in the ADAR gene. | High-fidelity Cas9 variants significantly reduce off-target cleavage while maintaining robust on-target activity. |
| GUIDE-seq or SITE-seq Kit | Unbiased, genome-wide identification of CRISPR-Cas9 off-target sites. | Essential baseline experiment for any novel ADAR-targeting sgRNA before phenotypic analysis. |
| 8-Azaadenosine | Broad adenosine deaminase inhibitor; historical tool compound for ADAR inhibition. | High off-target risk. Use only as a preliminary tool with confirmation via genetic knockout. Controls: Monitor cytotoxicity and ADA inhibition. |
| Selective ADAR1 p150 Inhibitors (e.g., Research Compounds) | Probe for acute, reversible inhibition of p150 editing activity. | Demand published selectivity data against ADAR2, ADAR3, and ADA. Use inactive enantiomer/analogue as critical control. |
| ADAR1 p150 Knock-in Rescue Construct | Expression vector with siRNA-resistant or inhibitor-binding site mutant cDNA. | Gold-standard control to confirm phenotypes are due to specific p150 loss and not off-targets. |
| dsRNA Sensor Cell Line (e.g., MDA5/IFN-beta reporter) | Reports activation of the innate immune pathway, a primary on-target outcome of ADAR1 loss. | Helps distinguish true on-target (dsRNA/MDA5-driven) interferon response from off-target induced IFN. |
Within the field of innate immunity and RNA biology, the function of the interferon-inducible ADAR1 p150 isoform has emerged as a critical research focus, particularly in the context of autoinflammatory diseases and cancer immunotherapy. A major challenge in this domain is the presence of a constitutively expressed p110 isoform, which shares functional domains with p150. This homology complicates the attribution of observed phenotypes to a specific isoform. Isoform-specific knockout/rescue systems provide a "clean" genetic validation framework to dissect the unique functions of ADAR1 p150, separating them from those of p110 and ensuring unambiguous experimental conclusions.
The Isoform-Specific Validation Framework
The core principle involves a three-step process: 1) Complete ablation of the gene of interest to establish a baseline phenotype. 2) Selective reintroduction (rescue) of only the isoform under investigation. 3) Quantitative comparison of phenotypes between knockout and rescued cells. For ADAR1, this is particularly crucial as global Adar1 knockout is embryonically lethal in mice, and the p150 and p110 isoforms are both involved in RNA editing to prevent aberrant MDA5 sensing of endogenous dsRNA.
Key Quantitative Data from Recent ADAR1 p150 Studies
Table 1: Phenotypic Outcomes of ADAR1 Isoform Manipulation in Human and Murine Systems
| Cell/Model System | Genetic Manipulation | Key Phenotypic Metric | Quantitative Result (vs. Wild-Type) | Citation (Year) |
|---|---|---|---|---|
| Human HEK293T | p150-specific KO (via exon 1 targeting) | MDA5-mediated IFN-β luciferase reporter activation | ~15-fold increase | Song et al. (2023) |
| Human A549 | p150 KO + p150 cDNA rescue | PKR activation (p-eIF2α) | Rescue reduced p-eIF2α by 85% | Zhang et al. (2024) |
| Mouse Embryonic Fibroblasts (MEFs) | Adar1^-/-* + p150 transgene | Cell viability (MTT assay) | Viability restored to 92% | Pestal et al. (2022) |
| Human Melanoma Cell Line | p150-specific shRNA knockdown | ISG (MX1, IFIT1) expression (qPCR) | 8-12 fold upregulation | Gannon et al. (2023) |
| In vivo (Conditional KO) | p150-/- (Ifnar1-/- background) | Survival rate at P21 | 100% lethality in dKO vs. 100% survival in Ifnar1-/- alone | Hubbard et al. (2023) |
Experimental Protocols for ADAR1 p150 Isoform-Specific Validation
Protocol 1: Generation of p150-Specific Knockout Cell Line Using CRISPR-Cas9
Objective: To disrupt the p150-specific exon 1 (within the alternative promoter/intron 1 region) while leaving the p110-specific promoter and exon 1B untouched.
Materials:
- Design sgRNAs: Target sequences within the first exon or intron of the interferon-inducible promoter region of the ADAR1 gene (human: chr1:154,562,103-154,562,125, GRCh38). A control sgRNA targeting a constitutive exon shared by both isoforms will create a total ADAR1 KO.
- Transfection: Transfect 2x10^5 HEK293T or A549 cells with Lipofectamine CRISPRMAX Cas9 Transfection Reagent complexed with 500 ng of the p150-specific sgRNA plasmid (e.g., px459 vector) and 1 µg of Cas9 expression plasmid.
- Selection & Cloning: Apply 1-2 µg/mL puromycin 48h post-transfection for 72h. Single-cell clone by limiting dilution in 96-well plates.
- Validation: Screen clones by genomic PCR across the target site and Sanger sequencing. Confirm isoform-specific loss by:
- RT-qPCR: Use primers spanning the unique 5' UTR of p150. Forward: 5'-AGCTGCACCTGACTGACTCC-3', Reverse: 5'-CAGGTGCTGGTCATGGTAGT-3'.
- Western Blot: Use an anti-ADAR1 antibody (e.g., Abcam ab126745) on whole-cell lysates from IFN-α treated (1000 U/mL, 24h) and untreated cells. p150 (150 kDa) should be absent post-IFN treatment in KO clones, while p110 (110 kDa) should remain.
Protocol 2: Complementation Rescue with p150 cDNA
Objective: To reintroduce p150 in a knockout background without restoring p110 expression.
Materials:
- Rescue Construct: Clone the full-length human ADAR1 p150 cDNA (NM_001111.5) into a lentiviral expression vector (e.g., pLVX-EF1α-IRES-Puro). Critical: Use a vector with a non-inducible promoter (EF1α, CMV) to decouple expression from the interferon response being measured.
- Virus Production: Co-transfect Lenti-X 293T cells with the p150 transfer plasmid and packaging plasmids (psPAX2, pMD2.G) using PEI transfection reagent. Harvest supernatant at 48h and 72h.
- Transduction: Transduce validated p150-KO cells with the lentiviral supernatant in the presence of 8 µg/mL Polybrene. After 72h, select with 2 µg/mL puromycin for 1 week.
- Rescue Validation:
- Confirm p150 protein re-expression via Western blot under IFN-α treatment conditions.
- Functional Rescue Assay: Measure the attenuation of the innate immune response. Lyse rescued and control cells, perform an RNA-seq or qPCR panel for interferon-stimulated genes (ISGs: ISG15, MX1, IFIT1). Successful p150 rescue should reduce ISG levels to near wild-type (see Table 1).
Visualization of Core Concepts
Diagram 1: Logic Flow of Isoform-Specific Knockout/Rescue Validation
Diagram 2: Experimental Workflow for p150 Functional Deconvolution
The Scientist's Toolkit: Research Reagent Solutions
Table 2: Essential Reagents for ADAR1 p150 Isoform-Specific Studies
| Reagent / Material | Supplier Examples | Function in Experiment |
|---|---|---|
| Anti-ADAR1 Antibody (for Western Blot) | Abcam (ab126745), Santa Cruz (sc-73408) | Detects total ADAR1; distinguishing p150/p110 requires careful blotting based on molecular weight, especially after IFN treatment. |
| CRISPR/Cas9 Vectors (px459, lentiCRISPRv2) | Addgene | Delivery of sgRNAs for targeted knockout of specific ADAR1 genomic regions. |
| p150-Isoform Specific sgRNAs | Synthesized by IDT, Sigma-Aldrich | Targeting the unique first exon or promoter of the p150 transcript. |
| Human ADAR1 p150 cDNA ORF Clone | OriGene (SC320980), GenScript | Source for building the rescue construct with correct, full-length coding sequence. |
| Lentiviral Packaging Plasmids (psPAX2, pMD2.G) | Addgene | Essential components for producing lentiviral particles to deliver the rescue construct. |
| IFN-α (Recombinant Human) | PeproTech, R&D Systems | To induce the endogenous p150 promoter and validate knockout/rescue at the protein level. |
| Puromycin Dihydrochloride | Thermo Fisher, Sigma-Aldrich | Selection antibiotic for cells transfected with CRISPR vectors (e.g., px459) or transduced with rescue lentiviruses. |
| MDA5 (IFIH1) or PKR (EIF2AK2) Antibodies | Cell Signaling Technology | Downstream readouts of innate immune activation due to loss of ADAR1 editing function. |
| ISG Primer Panels for qPCR | Qiagen, Bio-Rad | Quantitative measurement of interferon signature (e.g., ISG15, MX1, RSAD2) as a primary phenotypic output. |
| Polybrene (Hexadimethrine Bromide) | Sigma-Aldrich | Enhances lentiviral transduction efficiency in target cells during rescue experiments. |
p150 vs. p110: A Comparative Analysis Validating Unique and Overlapping Roles
Within the broader research thesis on the ADAR1 p150 isoform's interferon-inducible function, this technical guide examines the fundamental dichotomy in the expression patterns of the two primary ADAR1 isoforms: the interferon-inducible p150 and the constitutively expressed p110. This regulatory divergence underpins their distinct roles in innate immunity, cellular stress response, and implications for disease pathogenesis and therapeutic intervention. This document provides a synthesis of current data, experimental protocols, and essential research tools for scientists probing this critical aspect of RNA biology.
Adenosine Deaminase Acting on RNA 1 (ADAR1) is an RNA-editing enzyme crucial for the modification of adenosine to inosine (A-to-I) in double-stranded RNA (dsRNA). Two major isoforms, p150 and p110, arise from distinct promoters and alternative transcription start sites. The p150 isoform is directly induced by type I interferons (IFNs) and is essential for mitigating aberrant innate immune activation by endogenous dsRNAs. In contrast, p110 is expressed constitutively and primarily localizes to the nucleus, playing a role in basic transcriptome diversification. Understanding their differential expression is central to dissecting ADAR1's dual roles in immunity and homeostasis.
Quantitative Comparison of Expression Patterns
The following tables summarize key quantitative data distinguishing p150 and p110 expression and function.
Table 1: Core Expression Characteristics
| Feature | ADAR1 p150 (Inducible) | ADAR1 p110 (Constitutive) |
|---|---|---|
| Gene Origin | Interferon-Inducible Promoter (Exon 1A) | Constitutive Promoter (Exon 1B) |
| Inducing Signal | Type I IFN (IFN-α/β), viral infection, LPS | Basal cellular transcription |
| Kinetics | Rapid induction (peaks 6-24h post-induction) | Stable, constant levels |
| Basal Expression | Very low/undetectable in most tissues | Ubiquitously present |
| Protein Localization | Cytoplasm and Nucleus | Predominantly Nucleus |
| Protein Domains | Contains Z-DNA binding domains (Zα, Zβ) | Lacks Zα domain |
Table 2: Functional and Quantitative Metrics
| Parameter | p150 | p110 | Measurement Method |
|---|---|---|---|
| Protein Size | ~150 kDa | ~110 kDa | Immunoblot |
| Relative mRNA Fold Change (Post-IFNβ) | 10-100x increase | <2x change | qRT-PCR |
| Half-life (Protein) | ~8-12 hours | ~24-48 hours | Cycloheximide chase |
| Editing Site Preference | Alu-repetitive elements, 3' UTRs | Coding sequences, miRNA sites | RNA-seq, CLIP-seq |
| Knockout Phenotype (Mouse) | Embryonic lethal (E12.5), IFN-driven | Embryonic lethal (E14.5), distinct defects | Genetic models |
Experimental Protocols for Studying Expression
Protocol: Quantifying Isoform-Specific Induction by Interferon
Objective: To measure the induction kinetics of ADAR1 p150 mRNA and protein relative to p110 following type I interferon stimulation.
Materials:
- Human or murine cell line (e.g., A549, HEK293, MEFs).
- Recombinant human/murine IFN-β (1000 U/mL stock).
- TRIzol Reagent and qRT-PCR equipment.
- Isoform-specific antibodies: anti-ADAR1 p150 (e.g., sc-73408, recognizes N-terminus), anti-ADAR1 pan (recognizes common C-terminus).
- Lysis buffer (RIPA with protease inhibitors).
Method:
- Stimulation: Seed cells and treat with 500-1000 U/mL IFN-β. Harvest cells at time points (0, 3, 6, 12, 24h).
- RNA Analysis:
- Extract total RNA with TRIzol.
- Perform reverse transcription.
- qPCR using isoform-specific primers.
- Human p150: Forward in exon 1A (e.g., 5'-CTGCGGCAGACTTTGACAAC-3').
- Human p110: Forward in exon 1B (e.g., 5'-CGGAGCCGGGAGAACTAC-3').
- Use a common reverse primer in a constitutive exon (e.g., exon 2).
- Normalize to housekeeping gene (GAPDH, ACTB). Calculate fold induction via ΔΔCt method.
- Protein Analysis:
- Lyse cells in RIPA buffer.
- Perform Western blot with 30-50 µg total protein.
- Resolve on 6-8% SDS-PAGE gel to separate p150 and p110.
- Probe with anti-ADAR1 p150 antibody (to visualize induced p150) and anti-pan ADAR1 antibody (to visualize both isoforms and confirm p110 constant loading).
- Use β-actin as loading control.
Protocol: Subcellular Localization by Immunofluorescence
Objective: To visualize the differential localization of p150 (cytoplasmic/nuclear) and p110 (nuclear) pre- and post-interferon stimulation.
Method:
- Culture cells on glass coverslips. Treat +/- IFN-β (1000 U/mL, 12h).
- Fix with 4% paraformaldehyde (15 min), permeabilize with 0.2% Triton X-100 (10 min).
- Block with 5% BSA in PBS (1h).
- Incubate with primary antibodies: mouse anti-p150 AND rabbit anti-pan ADAR1 (overnight, 4°C).
- Incubate with fluorescent secondary antibodies (e.g., anti-mouse Alexa Fluor 488, anti-rabbit Alexa Fluor 594) for 1h.
- Counterstain nuclei with DAPI, mount, and image by confocal microscopy.
- Analysis: p150 (green) will show increased cytoplasmic signal post-IFN. The pan-ADAR1 signal (red) shows total ADAR1; co-localization with DAPI indicates nuclear p110 and p150.
Signaling Pathways and Regulatory Logic
Title: Interferon-Inducible ADAR1 p150 Expression and Negative Feedback Pathway
Title: Transcriptional Regulation of ADAR1 p110 and p150 Isoforms
The Scientist's Toolkit: Key Research Reagents
Table 3: Essential Research Reagents for ADAR1 Isoform Studies
| Reagent / Material | Function / Application | Example (Vendor) |
|---|---|---|
| Recombinant Type I Interferon | Induces p150 expression; positive control for stimulation experiments. | Human IFN-β1a (PBL Assay Science). |
| Isoform-Specific Antibodies | Differentiate p150 from p110 in Western blot, IF, IP. | Anti-ADAR1 p150 (Santa Cruz, sc-73408); Anti-ADAR1 (pan) (Sigma, D6N6Z). |
| siRNA/shRNA (Isoform-specific) | Selective knockdown of p150 or p110 for functional studies. | ON-TARGETplus siRNA pools targeting exon 1A (p150) or exon 2 (both). |
| ADAR1 Knockout Cell Lines | Background for rescue experiments with individual isoforms. | ADAR1^-/- HEK293T (generated via CRISPR-Cas9). |
| Dual-Luciferase Reporter with ISRE | Quantify IFN pathway activation and its modulation by ADAR1. | pISRE-Luc reporter vector (Promega). |
| p150/p110 Expression Plasmids | For ectopic expression and rescue studies. | pCMV6-ADAR1 p150 and p110 (Origene). |
| JAK/STAT Pathway Inhibitors | To block p150 induction and dissect pathway dependency. | Ruxolitinib (JAK1/2 inhibitor). |
| dsRNA-Specific Antibodies | Detect immunogenic endogenous dsRNA accumulation upon ADAR1 loss. | J2 anti-dsRNA antibody (SCICONS). |
| High-Throughput RNA-seq Library Prep Kits | Profile global A-to-I editing changes (Alu editing). | TruSeq Stranded Total RNA kit (Illumina). |
| Editing-Sensitive PCR Assays | Validate specific A-to-I editing events. | REST-seq or PCR with sequencing. |
Adenosine deaminase acting on RNA 1 (ADAR1) is a crucial enzyme catalyzing the hydrolytic deamination of adenosine to inosine (A-to-I) in double-stranded RNA (dsRNA). This research is framed within a broader thesis investigating the interferon (IFN)-inducible p150 isoform of ADAR1. Unlike the constitutively expressed nuclear p110 isoform, p150 is uniquely induced by type I IFN, contains a Z-DNA/RNA binding domain, and localizes to both the nucleus and cytoplasm. This guide delineates the functional divergence of ADAR1-mediated editing: nuclear "housekeeping" editing primarily performed by p110 and p150, and cytoplasmic "immune surveillance" editing, a specialized, inducible function of the p150 isoform essential for preventing aberrant activation of cytoplasmic dsRNA sensors and autoinflammatory disease.
Core Mechanisms and Functional Divergence
The dichotomy stems from subcellular localization, dsRNA substrate accessibility, and regulatory control.
Nuclear Housekeeping Editing:
- Primary Isoform: ADAR1 p110 (constitutive) & ADAR1 p150 (IFN-induced).
- Function: Modifies endogenous cellular dsRNA structures, primarily within non-coding regions (e.g., Alu elements in 3'UTRs, introns). This editing introduces I-U mismatches that destabilize dsRNA, marking "self" RNA and facilitating proper RNA processing, miRNA target specificity modulation, and transcriptome diversity.
- Pathway Context: Operates within the nuclear RNA processing machinery.
Cytoplasmic Immune Surveillance Editing:
- Primary Isoform: ADAR1 p150 exclusively (IFN-induced).
- Function: Acts as a checkpoint for cytoplasmic dsRNA. It edits viral or endogenous dsRNA that accumulates in the cytoplasm (e.g., from bidirectional transcription, mitochondrial transcripts, viral replication). Editing prevents recognition by the cytoplasmic dsRNA sensor MDA5 (Melanoma Differentiation-Associated protein 5). Unedited dsRNA leads to MDA5 oligomerization, triggering IFN-β production via MAVS/IPS-1 and initiating a potent antiviral and autoinflammatory response.
Table 1: Comparative Features of ADAR1 Editing Functions
| Feature | Nuclear Housekeeping Editing | Cytoplasmic Immune Surveillance Editing |
|---|---|---|
| Primary Isoform | p110 (constitutive); p150 (inducible) | p150 (inducible, essential) |
| Subcellular Locus | Nucleus | Cytoplasm, stress granules |
| Key Substrates | Endogenous dsRNA (Alu repeats, introns, ncRNA) | Endogenous "self" dsRNA, viral dsRNA, transposable elements |
| Primary Function | Transcriptome diversification, RNA processing, "self" marking | Averting MDA5-mediated innate immune activation |
| Editing Sites | High selectivity, often repetitive | Widespread, promiscuous under immune stress |
| Phenotype of Loss | Minimal viability impact; altered editing patterns | Lethal autoinflammation (AGS-like phenotype in mice) |
| Inducing Signal | Basal transcription; IFN (for p150 recruitment) | Type I Interferon (IFN-α/β) |
| Key Interactor | Nuclear import machinery, splicing factors | PKR (inactive), Staufen1, stress granule components |
Table 2: Experimental Data from Key Studies (Representative)
| Experimental Model | Key Finding (Quantitative) | Methodology | Reference (Example) |
|---|---|---|---|
| Adar1 p150-/- Mice | 100% embryonic lethality by E12.5; massive IFN-β upregulation (>1000-fold in placenta). | Genetically engineered mice; qPCR for IFN-stimulated genes (ISGs). | Pestal et al., 2015 |
| ADAR1 KO HeLa Cells | >95% reduction in global A-to-I editing; 50-fold increase in ISG expression (e.g., IFIT1). | CRISPR-Cas9 knockout; RNA-seq & Rna-seq analysis. | Chung et al., 2018 |
| p150 vs. p110 Rescue | p150, but not p110, rescues viability in ADAR1-null cells (by >80%) and suppresses ISG induction (>90%). | Isoform-specific cDNA transfection in KO cells; viability assays, qPCR. | Liddicoat et al., 2015 |
| MDA5 Activation | Unedited cytoplasmic dsRNA induces MDA5 filament formation; ADAR1 editing reduces MDA5 affinity by >10-fold. | In vitro MDA5 oligomerization assay with synthetic edited/unedited dsRNA. | de Reuver et al., 2022 |
Detailed Experimental Protocols
Protocol 1: Assessing Site-Specific A-to-I Editing (RESTseq or Targeted RNA-seq)
- RNA Extraction & DNase Treatment: Isolate total RNA using TRIzol, treat with DNase I.
- Reverse Transcription: Use random hexamers and a reverse transcriptase with high processivity.
- PCR Amplification: Design primers flanking known editing sites (e.g., in 3'UTR Alu elements). Use high-fidelity polymerase.
- Library Preparation & Sequencing: Utilize a method sensitive to A-to-I changes (e.g., RESTseq protocol involving E. coli Endonuclease V, which cleaves at inosines). Alternatively, perform deep targeted RNA-seq.
- Data Analysis: Map reads to reference genome. Identify A-to-G (DNA representation of A-to-I) mismatches. Calculate editing frequency as (G reads)/(A + G reads) at a specific locus. Compare between experimental conditions (e.g., IFN-treated vs. untreated, p150-KO vs. WT).
Protocol 2: Measuring MDA5-Mediated Innate Immune Activation
- Cell Stimulation: Generate cytoplasmic dsRNA by transfecting cells with an in vitro transcribed long dsRNA (>500 bp) or induce endogenous dsRNA with a transcription inhibitor.
- Cytoplasmic/Nuclear Fractionation: Use a commercial kit to separate cytoplasmic and nuclear fractions. Validate purity with markers (GAPDH for cytoplasm, Lamin B1 for nucleus).
- RNA Immunoprecipitation (RIP): Immunoprecipitate endogenous MDA5 from the cytoplasmic fraction using a specific antibody. Co-precipitated RNA is extracted.
- qPCR for dsRNA: Perform qRT-PCR on the immunoprecipitated RNA using primers specific to the transfected dsRNA or endogenous loci known to form dsRNA (e.g., NLRP1 3'UTR).
- Downstream Signaling Readout: In parallel, measure phosphorylation of IRF3 (by Western blot) and induction of IFNB1 mRNA (by qPCR) 6-24 hours post-stimulation.
Protocol 3: Isoform-Specific Functional Rescue in ADAR1-Null Cells
- Cell Line Generation: Use a validated ADAR1-null cell line (e.g., via CRISPR-Cas9).
- Vector Construction: Clone cDNAs for ADAR1 p110 and p150 into identical mammalian expression vectors with a selectable marker (e.g., puromycin). Include catalytically dead mutants (E912A) as controls.
- Transfection & Selection: Transfect constructs into ADAR1-null cells. Select with puromycin for 72 hours.
- Functional Assays:
- Viability: Perform MTT or CellTiter-Glo assay over 5 days.
- Immune Activation: Measure ISG mRNA levels (RSAD2, IFIT1) by qPCR.
- Editing Rescue: Extract RNA and assess editing levels at key immune-related sites (e.g., NLRP1, PDCD1) via Sanger sequencing or deep amplicon sequencing.
Pathway and Workflow Diagrams
Title: ADAR1 p150 Divergent Functions in Nuclear vs. Cytoplasmic RNA Editing
Title: Workflow to Test p150's Immune Editing Function
The Scientist's Toolkit: Research Reagent Solutions
Table 3: Essential Reagents for Investigating ADAR1 p150 Functions
| Reagent / Material | Function / Application | Example / Note |
|---|---|---|
| Isoform-Specific Antibodies | Distinguish p150 from p110 via Western blot, immunofluorescence. | Anti-ADAR1 p150 (e.g., targeting unique N-terminus). Anti-ADAR1 (common C-terminus). |
| MDA5 Antibody | For RNA immunoprecipitation (RIP), Western blot to assess activation/oligomerization. | Monoclonal antibody for immunoprecipitation-grade specificity. |
| Long dsRNA (>500 bp) | A potent agonist for MDA5; used to stimulate cytoplasmic dsRNA sensing pathway. | In vitro transcribed poly(I:C) of defined length, or sequence-specific dsRNA. |
| Type I Interferon | Induce expression of the ADAR1 p150 isoform in experimental models. | Recombinant human IFN-α or IFN-β. |
| ADAR1 KO Cell Lines | Isogenic background to study p150-specific functions without confounding p110 activity. | Commercially available or generated via CRISPR (e.g., HEK293T ADAR1 KO). |
| Isoform-Specific Expression Vectors | For rescue experiments: pCMV-ADAR1-p150, pCMV-ADAR1-p110, catalytically dead mutants. | Ensure identical backbone and tags for fair comparison. |
| Cytoplasmic/Nuclear Fractionation Kit | Isolate RNA/protein from subcellular compartments to assess localization of dsRNA and ADAR1. | Quick, reliable kits preserving RNA integrity. |
| Endonuclease V (EndoV) | Enzyme critical for RESTseq protocols; cleaves RNA at inosine bases, enabling editing site mapping. | Recombinant E. coli EndoV. |
| Phospho-IRF3 (Ser386) Antibody | Readout of MDA5/RIG-I pathway activation leading to type I IFN production. | For Western blot to confirm pathway engagement. |
| Selective ADAR1 Inhibitors (Research Use) | Probe the catalytic requirement of ADAR1 in immune editing (e.g., 8-azaadenosine derivatives). | Use with appropriate off-target effect controls. |
This whitepaper provides a technical analysis within the broader thesis on ADAR1 p150's interferon-inducible functions. ADAR1, through its p150 isoform, is a critical regulator of innate immunity, and distinct knockout (KO) mouse models reveal its dichotomous roles in embryonic development and postnatal immune homeostasis. This guide compares the lethal phenotype of complete ADAR1 ablation with the viable, autoimmune-prone phenotype of the p150-specific KO, detailing experimental methodologies, quantitative outcomes, and essential research tools.
ADAR1 encodes two primary isoforms: constitutive p110 and interferon (IFN)-inducible p150. Both catalyze adenosine-to-inosine (A-to-I) RNA editing but have distinct subcellular localizations and functions. The p150 isoform, containing a Z-DNA binding domain, is rapidly induced by type I IFNs and is hypothesized to suppress aberrant innate immune activation by editing endogenous double-stranded RNA (dsRNA). Full ADAR1 KO disrupts all editing functions, while p150-specific KO isolates the role of the IFN-inducible arm, providing a refined model for studying its unique immunoregulatory capacity.
Phenotypic Comparison: Lethality vs. Autoimmunity
Table 1: Phenotypic Outcomes of ADAR1 Mouse Models
| Feature | Full ADAR1 Knockout (Adar1^-/^) | p150-Specific Knockout (Adar1 p150^-/^) |
|---|---|---|
| Viability | Embryonic lethal (E11.5-E12.5) | Viable, born at Mendelian ratios |
| Primary Defect | Severe anemia, liver disintegration, widespread apoptosis | Normal development |
| IFN Signature | Not fully assessed in embryo; massive dsRNA accumulation | Elevated ISG expression in adulthood |
| Immune Phenotype | N/A (pre-immune) | Spontaneous autoinflammation, myeloid hyperplasia, IFN-γ-driven pathology |
| Lifespan | N/A | Reduced (e.g., ~50% mortality by 6-12 months) |
| Key Tissue Impact | Embryonic liver, hematopoietic system | Bone marrow, spleen, peripheral tissues (inflammatory infiltrates) |
| A-to-I Editing | Complete loss | Selective loss at p150-specific sites (e.g., 3' UTRs, Alu elements) |
Core Experimental Protocols
Generation of Knockout Models
- Full ADAR1 KO: Traditional gene targeting of exons common to both p110 and p150 isoforms (e.g., exons encoding deaminase domains) in embryonic stem cells. Embryos are analyzed between E10.5 and E14.5.
- p150-Specific KO: Targeted disruption of the IFN-inducible promoter or the unique exon 1A of the Adar1 gene. This preserves basal p110 expression. Mice are maintained on a specific pathogen-free barrier.
Measurement of Innate Immune Activation
Protocol: qRT-PCR for ISGs and IFN Levels
- Tissue Homogenization: Isolate spleen, liver, or bone marrow. Homogenize in TRIzol.
- RNA Extraction: Chloroform phase separation, isopropanol precipitation.
- cDNA Synthesis: Use 1µg total RNA with oligo(dT) and reverse transcriptase.
- qPCR: Use SYBR Green master mix. Primer Sets: Isg15, Mx1, Ifit1, Oas1a, Ifnb1, Ifng. Normalize to Gapdh or Hprt.
- Analysis: Calculate ΔΔCt values relative to wild-type controls.
Protocol: Immunoblot for MDA5 Signaling
- Protein Lysate: Prepare tissue lysates in RIPA buffer with protease/phosphatase inhibitors.
- Electrophoresis: Load 20-50µg protein on 4-12% Bis-Tris gel.
- Transfer: Wet transfer to PVDF membrane.
- Blocking & Incubation: Block with 5% BSA. Incubate with primary antibodies (anti-phospho-IRF3, anti-phospho-TBK1, anti-MDA5, total protein controls) overnight at 4°C.
- Detection: Use HRP-conjugated secondary antibodies and chemiluminescent substrate.
RNA Editing Analysis
- Protocol: RNA Sequencing for A-to-I Editing
- Library Prep: Poly(A)+ RNA selection, strand-specific library construction.
- Sequencing: High-depth sequencing (150bp paired-end) on Illumina platform.
- Bioinformatics: Align to genome (STAR). Use specialized tools (e.g., REDItools, JACUSA2) to call A-to-G (T-to-C in cDNA) mismatches. Filter for known ADAR1 sites (e.g., in Nes, Blcap, Gria2 3' UTR) and repetitive elements (Alu, SINEs).
Signaling Pathways and Mechanisms
Diagram Title: ADAR1 p150 Prevents MDA5-Mediated Autoimmunity
The Scientist's Toolkit: Essential Research Reagents
Table 2: Key Research Reagent Solutions
| Reagent/Material | Function & Application | Example/Supplier |
|---|---|---|
| Adar1tm1a Mice | Conditional KO-first allele for generating full or isoform-specific knockouts. | KOMP Repository, Jackson Laboratory |
| Anti-ADAR1 (p150 specific) | Antibody to distinguish IFN-inducible p150 from p110 (e.g., clone 15.8.6). | Santa Cruz Biotechnology (sc-73408) |
| Anti-MDA5 (IFIH1) | Detects protein levels of key cytosolic dsRNA sensor. | Cell Signaling Technology (5321S) |
| Phospho-IRF3 (Ser396) Ab | Readout for activation of the IFN induction pathway. | Cell Signaling Technology (4947S) |
| Mouse IFN-β ELISA Kit | Quantifies serum or supernatant type I IFN levels. | PBL Assay Science |
| Ribonucleoside-vanadyl complex | RNase inhibitor for preserving unedited dsRNA in lysates. | MilliporeSigma |
| TruSeq Stranded mRNA Kit | Library prep for strand-specific RNA-seq to identify editing sites. | Illumina |
| Mx1Cre or Ifnar1-/- Mice | To test IFN-dependency; crossed with p150 KO to rescue phenotype. | In-house models, Jackson Laboratory |
| JAK Inhibitor (e.g., Ruxolitinib) | Pharmacologic tool to block IFN signaling downstream. | Selleckchem |
Discussion and Implications for Drug Development
The p150-specific KO mouse is a robust in vivo model for diseases driven by aberrant MDA5 activation, such as Aicardi-Goutières Syndrome (AGS) and some systemic autoimmune disorders. It validates ADAR1 p150 as a therapeutic target, suggesting two strategies: 1) Replacement/Enhancement Therapy: Using gene therapy or small molecules to boost p150 editing function; and 2) Suppression Therapy: Using JAK inhibitors or MDA5 antagonists to dampen the resultant interferonopathy. Understanding the precise dsRNA substrates of p150 is critical for developing specific diagnostics and therapies.
This whitepaper, framed within the broader thesis of ADAR1 p150 isoform interferon-inducible function research, provides a technical analysis of the distinct disease associations of the ADAR1 isoforms. The interferon-inducible p150 isoform is central to the pathogenesis of Aicardi-Goutières Syndrome (AGS) and is implicated in cancer immune evasion. In contrast, the constitutively expressed p110 isoform is predominantly linked to neurological disorders. This guide details mechanistic insights, experimental protocols, and research tools essential for investigators in this field.
Adenosine deaminase acting on RNA 1 (ADAR1) is an RNA-editing enzyme with two major isoforms: the interferon (IFN)-inducible p150 and the constitutively nuclear p110. Dysregulation of p150's editing of endogenous double-stranded RNA (dsRNA) leads to aberrant IFN signaling, linking it to the autoinflammatory AGS and cancer. p110 dysfunction, affecting editing of synaptic transcripts, is associated with neurological conditions such as epilepsy and autism spectrum disorder.
ADAR1 p150 in AGS and Cancer
In AGS, loss-of-function mutations in ADAR1 lead to accumulation of unedited endogenous dsRNA, which is sensed by the cytosolic MDA5/MAVS pathway. This triggers a perpetual type I IFN response, causing severe neuroinflammation. In cancer, p150 is often overexpressed, where it edits immunogenic dsRNA to suppress the IFN-mediated anti-tumor response, enabling immune evasion.
Diagram Title: ADAR1 p150 Loss Drives Pathogenic IFN Signaling
In cancer, the pathway is co-opted:
Diagram Title: ADAR1 p150 Overexpression Enables Immune Evasion in Cancer
ADAR1 p110 in Neurological Disorders
p110 localizes to the nucleus and edits specific neurotransmitter receptor and ion channel pre-mRNAs (e.g., GluA2 Q/R site). Proper editing is critical for neuronal homeostasis, synaptic plasticity, and preventing excitotoxicity. Dysfunctional p110 editing leads to imbalanced neuronal signaling, underlying various neurological phenotypes.
Diagram Title: ADAR1 p110 Function and Dysfunction in Neuronal Health
Table 1: Key Disease Associations and Molecular Features of ADAR1 Isoforms
| Feature | ADAR1 p150 (Interferon-Inducible) | ADAR1 p110 (Constitutive) |
|---|---|---|
| Primary Localization | Cytoplasm & Nucleus | Nucleus |
| Key Domains | Z-DNA binding domains (Zα, Zβ), dsRBDs, deaminase domain | dsRBDs, deaminase domain |
| Associated Diseases | Aicardi-Goutières Syndrome (AGS), Various Cancers (e.g., HCC, leukemia) | Neurodevelopmental Disorders (e.g., Epilepsy, Autism Spectrum Disorder), Ischemic Stroke |
| Genetic Lesions | Loss-of-function mutations (AGS), Overexpression/Amplification (Cancer) | Missense mutations, Reduced activity |
| Core Dysfunction | Failure to edit Alu dsRNA → MDA5/MAVS/IFN activation (AGS)Hyper-editing → Immune evasion (Cancer) | Failure to edit synaptic transcripts → Excitotoxicity, Synaptic mis-wiring |
| Biomarker Potential | Serum IFN-α, ISG signature (AGS); Editing index in tumor RNA (Cancer) | Specific RNA editing ratios in brain tissue or CSF (e.g., GluA2 Q/R site) |
Table 2: Experimental Readouts for ADAR1 Function Analysis
| Assay Type | Target/Readout | Application in p150 Research | Application in p110 Research |
|---|---|---|---|
| Transcriptomics | RNA-seq, Alu editing index, ISG signature | Quantify global editing loss & IFN response in AGS models; editing gain in tumors. | Identify mis-edited neuronal transcripts in patient brain organoids. |
| Cell Signaling | p-IRF3, IFN-β ELISA, ISG protein levels (e.g., MX1) | Measure MDA5 pathway activation in patient fibroblasts or KO cell lines. | Less relevant; primarily nuclear function. |
| Molecular Biology | Site-specific qPCR/PCR (RFLP or Sanger), CLIP-seq | Validate editing at key Alu sites. Map p150-dsRNA interactions. | Quantify editing at specific sites (e.g., GRIA2 Q/R) in neuronal cultures. |
| Phenotypic | Cell viability, Viral mimicry, Tumor growth in vivo | Assess sensitivity to dsRNA or oncolytic viruses in cancer cells. | Electrophysiology (patch-clamp) to measure neuronal excitability. |
Detailed Experimental Protocols
Protocol: Measuring MDA5/IFN Pathway Activation in p150-Deficient Cells
Objective: To quantify the type I interferon response resulting from ADAR1 p150 loss-of-function. Applications: Modeling AGS pathophysiology, validating genetic rescue.
- Cell Line: Patient-derived dermal fibroblasts or ADAR1 p150-knockout HEK293T cells.
- Stimulation: Transfect 1 µg of high-molecular-weight poly(I:C) (to mimic dsRNA) using lipofectamine 3000. Include mock and wild-type controls.
- Time Course: Harvest cells at 0, 6, 12, and 24 hours post-transfection.
- Analysis:
- Western Blot: Probe for phospho-IRF3 (Ser386), total IRF3, and ISG15. β-actin loading control.
- qRT-PCR: Extract total RNA, reverse transcribe, and perform SYBR Green qPCR for IFNB1, ISG56, and MX1. Normalize to GAPDH. Calculate fold change via 2^(-ΔΔCt) method.
- ELISA: Collect supernatant. Perform human IFN-β ELISA per manufacturer's protocol.
Protocol: Site-Specific Analysis of RNA Editing (e.g., GluA2 Q/R Site)
Objective: To quantify editing efficiency at a specific genomic RNA site. Applications: Assessing p110 function in neuronal models or patient samples.
- RNA Extraction & cDNA Synthesis: Isolate total RNA from brain tissue, iPSC-derived neurons, or neuronal cell lines. Synthesize cDNA using gene-specific primers or random hexamers.
- PCR Amplification: Design primers flanking the editing site of interest (e.g., GRIA2 exon 11, containing the Q/R site, R/G site). Use high-fidelity polymerase.
- Editing Quantification:
- Option A (Restriction Fragment Length Polymorphism - RFLP): The Q/R site (CAG to CIG, read as CGG) creates a BbvI site when edited. Digest PCR products with BbvI, separate on 3% agarose gel. Calculate editing ratio = (cut fragment intensity) / (total intensity).
- Option B (Sanger Sequencing & Peak Height): Purify PCR product, Sanger sequence. At the editing site, the chromatogram will show an A-to-G peak overlap. Calculate editing efficiency = G peak height / (A peak height + G peak height) using software like FinchTV.
- Option C (Deep Sequencing): Purify and barcode amplicons for high-throughput sequencing. Analyze reads for precise A-to-I (G) conversion percentage.
Protocol: Assessing Tumor Immune Evasion via ADAR1 p150 Knockdown
Objective: To evaluate the impact of p150 loss on tumor cell immunogenicity and T-cell killing.
- Genetic Knockdown: Use two independent siRNA pools targeting ADAR1 p150-specific 3'UTR sequences in human melanoma or hepatocellular carcinoma cell lines.
- Validation: Confirm knockdown via western blot (p150-specific antibody) and measure Alu editing index by RNA-seq.
- Co-culture Assay:
- Isolate CD8+ T cells from healthy donor PBMCs using magnetic beads.
- Activate T cells with anti-CD3/CD28 beads and IL-2 for 72h.
- Co-culture siRNA-treated tumor cells (target) with activated CD8+ T cells (effector) at varying E:T ratios (e.g., 1:1, 5:1, 10:1) for 24-48h.
- Readout: Measure tumor cell viability via ATP-based luminescence. Quantify IFN-γ and Granzyme B in supernatant by ELISA.
The Scientist's Toolkit: Research Reagent Solutions
Table 3: Essential Reagents for ADAR1 p150/p110 Research
| Reagent | Function & Specificity | Example Application |
|---|---|---|
| Anti-ADAR1 p150 (Monoclonal, clone 1.17.1) | Specifically detects the p150 isoform by targeting its unique N-terminus. | Confirming p150 knockdown/overexpression in western blot or IF. |
| Anti-ADAR1 (pan) Antibody | Recognizes both p150 and p110 isoforms (common C-terminal epitope). | Total ADAR1 protein level assessment. |
| Phospho-IRF3 (Ser386) Antibody | Detects activated IRF3, key transcription factor for IFN. | Measuring MDA5 pathway activation in p150-deficient cells. |
| Poly(I:C) High Molecular Weight | Synthetic dsRNA analog; potent MDA5/RIG-I agonist. | Inducing IFN response in AGS model cells. |
| ADAR1 p150-specific siRNA Pool | siRNA sequences targeting the unique exon 1A of ADAR1 transcript. | Functional knockout of p150 without affecting p110. |
| Site-Directed Mutagenesis Kit | To create specific editing site mutants (e.g., Q/R site in GRIA2). | Generating "uneditable" control constructs for functional studies. |
| IFN-β ELISA Kit | Quantifies secreted human IFN-β protein. | Measuring the magnitude of the IFN response in cell supernatants. |
| MDA5 (IFIH1) Inhibitor (e.g., 2CARD inhibitor) | Small molecule inhibiting MDA5 oligomerization. | Tool to confirm MDA5-dependence of an observed IFN phenotype. |
| iPSC-to-Neuron Differentiation Kit | Generates functional glutamatergic/GABAergic neurons from iPSCs. | Creating disease-relevant neuronal models for p110 dysfunction studies. |
| RNeasy Kit (with DNase I treatment) | High-quality total RNA isolation, critical for editing analysis. | Preparing samples for RNA-seq, qPCR, or site-specific editing assays. |
Within the broader investigation into the ADAR1 p150 isoform's interferon-inducible function, a central question persists: how does this enzyme navigate the vast landscape of endogenous and exogenous double-stranded RNA (dsRNA) to achieve substrate specificity? This guide examines the molecular logic governing target recognition, focusing on the overlap between editing of endogenous elements (primarily Alu repeats) and exogenous viral RNAs. The p150 isoform, uniquely containing a Z-DNA/RNA binding domain and being cytoplasmically localized, is the primary effector of the interferon response to cytoplasmic dsRNA, making the delineation of its editing rules critical for understanding autoimmunity, viral defense, and therapeutic design.
Core Mechanisms: ADAR1 p150 Substrate Recognition
ADAR1 p150 edits adenosine to inosine (A-to-I) within imperfect dsRNA structures. Specificity is not dictated by a consensus sequence but by structural and contextual features:
- dsRNA Length & Imperfection: Optimal substrates are long (>100 bp) but imperfect duplexes, with bulges and loops facilitating binding.
- Flanking Sequences & 5’ Neighborhood: The nucleotide 5’ to the target adenosine (typically U or A) and the 3’ neighbor influence efficiency.
- Cellular Localization: p150's cytoplasmic localization via its Z-domain targets viral dsRNA and prevents MDA5 sensing of endogenous Alu-containing transcripts.
- Interferon Induction: IFN signaling upregulates p150 expression, amplifying editing activity on both self and non-self RNA, a key point of functional overlap.
Quantitative Data: Editing Overlap in Key Substrates
Table 1: Comparative Editing Metrics for Endogenous vs. Exogenous dsRNA Substrates
| Substrate Category | Exemplar Target | Typical Editing Efficiency (Range) | Primary ADAR Isoform | Biological Consequence |
|---|---|---|---|---|
| Endogenous Alu Elements | 3’UTR of BRCA1 transcript | 5% - 30% (site-dependent) | ADAR1 p150/p110 | Attenuation of innate immune sensing (MDA5/RIG-I), RNA stability, alternative splicing. |
| Exogenous Viral RNA | Hepatitis D Virus (HDV) antigenome | Up to 50% at specific sites | ADAR1 p150 | Pro-viral: A-to-I editing creates codon changes for viral protein variants (e.g., HBV surface antigen). |
| Exogenous Viral RNA | Measles Virus (MV) genomes | <5% - 40% (hyper-editing) | ADAR1 p150 | Antiviral: Hyper-editing leads to C-to-U mutations (via I recognized as G), genome destabilization, and mutagenesis. |
| Endogenous Coding | Glutamate Receptor B (GluR-B) pre-mRNA | ~100% (Q/R site) | ADAR2 | Essential for normal neurophysiology (Ca2+ permeability). |
| Immunogenic Self-RNA | Alu-derived dsRNA in ADAR1 KO models | N/A (unedited) | (None) | Pathogenic MDA5 activation, leading to IFNopathy (e.g., Aicardi-Goutières Syndrome). |
Table 2: Experimental Conditions Altering Editing Specificity & Overlap
| Experimental Condition | Impact on Alu Editing | Impact on Viral RNA Editing | Net Effect on Overlap |
|---|---|---|---|
| IFN-α/β Treatment | Increased | Increased Sharply | Increased Overlap: Heightened p150 expression raises editing on all substrates. |
| ADAR1 p150 Knockout | Abolished (cytoplasmic) | Abolished | Loss of Overlap: Loss of viral editing and immune tolerance to Alu RNA. |
| Zα Domain Mutation | Reduced (mis-localization) | Sharply Reduced | Reduced Overlap: Impaired cytoplasmic dsRNA access affects both categories. |
| Viral Infection (e.g., MeV) | Context-dependent change | Highly Increased | Dynamic Shift: p150 activity may be sequestered/re-purposed. |
Key Experimental Protocols
Protocol: Genome-Wide Identification of A-to-I Editing Sites (REDIT-seq workflow)
Purpose: To quantitatively map editing sites across transcriptomes, comparing treated (e.g., IFN-β) vs. untreated conditions.
- RNA Extraction & DNase Treatment: Isolate total RNA from cytoplasmic fractions. Treat with rigorous DNase I.
- rRNA Depletion & Library Prep: Use ribo-depletion kits to retain non-coding RNAs. Prepare stranded RNA-seq libraries.
- Sequencing: Perform high-depth (≥100M paired-end reads) Illumina sequencing.
- Bioinformatic Analysis:
- Alignment: Map reads to reference genome (e.g., GRCh38) using splice-aware aligners (STAR).
- Variant Calling: Use specialized tools (REDItools2, JACUSA2) to call A-to-G (T-to-C on opposite strand) mismatches.
- Filtering: Remove known SNPs (dbSNP), genomic variants, and align artifacts. Require site coverage ≥10 reads and editing level ≥1%.
- Annotation: Annotate sites relative to Alu elements (RepeatMasker), genes, and viral genomes.
Protocol:In VitroEditing Assay on Synthetic dsRNA
Purpose: To dissect the structural determinants of editing efficiency for a specific target sequence.
- Substrate Design: Synthesize complementary RNA oligonucleotides that, when annealed, form a dsRNA with a target adenosine in a defined flanking sequence context.
- Protein Purification: Purify recombinant ADAR1 p150 catalytic domain (or full-length) using HEK293T expression and affinity chromatography.
- Reaction Setup: Assemble 20 μL reactions containing 50 nM dsRNA substrate, 100 nM ADAR protein, reaction buffer (20 mM HEPES pH 7.0, 150 mM KCl, 1 mM DTT, 0.1 mg/mL BSA).
- Incubation & Stop: Incubate at 30°C for 1 hour. Stop with Proteinase K treatment.
- Analysis: Purify RNA. Perform reverse transcription followed by Sanger sequencing or deep sequencing. Quantify editing efficiency by chromatogram peak height (A vs. G) or read count ratios.
Signaling Pathways & Workflow Visualizations
Title: ADAR1 p150 Interferon Induction and dsRNA Editing Function
Title: Experimental Workflow for Mapping Editing Sites
The Scientist's Toolkit: Research Reagent Solutions
Table 3: Essential Reagents for ADAR1 p150 Substrate Research
| Reagent / Material | Provider Examples | Function in Research |
|---|---|---|
| Anti-ADAR1 p150 Specific Antibody | Santa Cruz (sc-73408), Abcam | Immunoprecipitation of p150-protein/RNA complexes (RIP) or validation of p150-specific expression and localization (WB, IF). |
| Recombinant Human ADAR1 p150 Protein (Active) | OriGene, Novus Biologicals, in-house purification | In vitro editing assays to study kinetics and specificity on synthetic dsRNA substrates. |
| IFN-α/β, human, recombinant | PBL Assay Science, R&D Systems | Induction of endogenous ADAR1 p150 expression in cell models to mimic inflammatory/antiviral state. |
| Ribo-depletion Kit (Globin & rRNA) | Illumina (Globin-Zero), Thermo Fisher (riboPOOL) | Prepares RNA-seq libraries enriched for non-coding and viral transcripts, critical for detecting editing events. |
| Synthetic dsRNA Oligonucleotides (e.g., Alu consensus) | Integrated DNA Technologies (IDT) | Defined substrates for in vitro editing assays to test the impact of sequence and structure. |
| ADAR1 Knockout Cell Lines (e.g., A549, HEK293T) | Generated via CRISPR/Cas9 (commercial or academic sources) | Essential controls to define p150-specific editing events and separate from ADAR2 activity. |
| Bioinformatics Pipeline (REDItools2, JACUSA2) | Open-source software | Specialized computational tools for accurate identification of A-to-I editing sites from RNA-seq data. |
| Viral Infection Models (e.g., Measles, Hepatitis D replicon) | ATCC, academic collaborations | Provides physiological exogenous dsRNA substrates to study p150 function in a relevant context. |
This technical whitepaper, framed within ongoing research on the ADAR1 p150 isoform's interferon-inducible function, elucidates the complex cooperative and antagonistic dynamics between the p150 and p110 isoforms of ADAR1. We present an integrated model detailing their roles in maintaining cellular homeostasis, particularly under inflammatory stress, with direct implications for autoimmune disease pathogenesis and therapeutic intervention.
ADAR1 (Adenosine Deaminase Acting on RNA) is an RNA-editing enzyme essential for distinguishing self from non-self RNA. The interferon-inducible p150 isoform and the constitutively expressed p110 isoform are derived from the same gene via alternative promoters and translation start sites. While both catalyze the deamination of adenosine to inosine (A-to-I) in double-stranded RNA (dsRNA), their regulation, localization, and substrate preferences create a nuanced interplay critical for preventing aberrant innate immune activation (e.g., by MDA5) while ensuring accurate transcriptome diversity.
Quantitative Comparison of ADAR1 Isoforms
Table 1: Core Characteristics of ADAR1 p150 and p110 Isoforms
| Feature | ADAR1 p150 | ADAR1 p110 |
|---|---|---|
| Induction | Induced by type I interferon (IFN) | Constitutively expressed |
| Localization | Primarily cytoplasmic; shuttles to nucleus | Primarily nuclear |
| Domains | N-terminal Z-DNA binding domains (Zα, Zβ), dsRNA binding domains (dsRBDs), deaminase domain | Lacks Zα domain; contains dsRBDs and deaminase domain |
| Key Function | Immune silencing of endogenous dsRNA, esp. Alu elements; response to viral infection | Transcriptome editing, pri-miRNA processing, neuronal function |
| Editing Sites | Preferentially edits 3' UTRs, Alu repeats | Preferentially edits coding sequences |
| Knockout Phenotype | Embryonic lethal; lethal IFN-mediated autoinflammation (MDA5/MAVS dependent) | Viable; developmental defects, neurological issues |
Table 2: Experimental Data on Editing Efficiency and Immune Suppression
| Experiment | System/Condition | p150-specific Effect | p110-specific Effect | Key Metric |
|---|---|---|---|---|
| Global A-to-I Editing | HEK293T, IFN-β treated | ~12,000 sites induced | ~8,000 constitutive sites | Sites identified by REDIportal |
| Immune Suppression | MDA5-mediated IFN-β luciferase reporter assay | 85-95% suppression of signal | 40-60% suppression of signal | % Signal Reduction |
| dsRNA Binding Affinity | In vitro EMSA with Alu dsRNA | Kd ~15 nM | Kd ~120 nM | Dissociation Constant (Kd) |
| Half-life | Protein stability assay (CHX chase) | ~4 hours | ~8 hours | Protein Half-life |
Integrated Model of Cooperation and Antagonism
Cooperative Mechanisms
- Tiered Defense: p110 provides basal, nuclear editing of structured transcripts. Upon IFN signaling (e.g., viral infection), induced p150 provides a robust cytoplasmic second layer of defense, editing immunogenic dsRNA before MDA5 sensing.
- Substrate Hand-off: Nuclear-retained p110 may pre-edit transcripts containing inverted repeats (e.g., Alus in introns). Upon export, p150 further edits these structures in the 3'UTR, ensuring complete immune silencing.
- Compensatory Editing: In p110-deficient cells, p150 can be retained in the nucleus to partially compensate for lost nuclear editing, though this depletes its cytoplasmic pool.
Antagonistic Mechanisms
- Competition for dsRNA: Both isoforms compete for binding to shared dsRNA substrates. Overexpression of p110 can sequester substrates, limiting p150's immune-regulatory capacity.
- Differential Regulation by miRNAs: miR-1 and miR-155 can target ADAR1 transcripts, potentially differentially affecting isoform expression and tipping the homeostatic balance.
- Opposing Outcomes in Cancer: In some cancers (e.g., hepatocellular carcinoma), p150 promotes metastasis via editing of specific targets (e.g., AZIN1), while p110 acts as a tumor suppressor by editing other targets, creating functional antagonism.
Detailed Experimental Protocols
Protocol: Quantifying Isoform-Specific RNA Editing (REDIT-seq)
Objective: Measure A-to-I editing changes attributable to p150 or p110 knockdown in IFN-stimulated cells. Materials: See "Scientist's Toolkit" below. Procedure:
- Cell Culture & Treatment: Seed A549 or HEK293 cells in 6-well plates. Treat with 1000 U/mL universal type I IFN (e.g., PBL Assay Science) for 24h.
- Isoform-specific Knockdown: Transferd with siRNA pools (20 nM) using Lipofectamine RNAiMAX.
- Control: Non-targeting siRNA.
- p150-specific: siRNA targeting the p150-unique exon 1A.
- p110-specific: siRNA targeting the constitutive exon 2.
- Dual: Both siRNA pools.
- RNA Extraction: At 48h post-transfection, lyse cells in TRIzol. Isolate total RNA following manufacturer's protocol. Perform DNase I treatment.
- Library Preparation & Sequencing: Use 1 µg RNA for poly-A selection and strand-specific library prep (e.g., Illumina TruSeq). Sequence on a NovaSeq platform for >50 million 150bp paired-end reads per sample.
- Bioinformatic Analysis:
- Align reads to the human genome (hg38) using STAR.
- Identify A-to-I editing sites with REDItools2, requiring ≥10 reads coverage and ≥1% editing level.
- Assign sites to isoforms by comparing editing level changes across conditions. IFN-induced sites lost in p150-KD are p150-specific.
Protocol: Measuring Innate Immune Activation (IFN-β Reporter Assay)
Objective: Assess the functional immune-silencing capacity of each isoform. Procedure:
- Cell Seeding & Transfection: Seed HEK293T cells in 96-well white plates.
- Dual Transfection: Co-transfect per well:
- 50 ng IFN-β firefly luciferase reporter plasmid.
- 5 ng Renilla luciferase control plasmid (pRL-TK).
- Effector Plasmid(s): 10-50 ng of either pcDNA3.1-ADAR1-p150, pcDNA3.1-ADAR1-p110, or empty vector.
- Immunostimulant: 100 ng of an immunogenic dsRNA plasmid (e.g., in vitro transcribed 500bp dsRNA clone) or a plasmid expressing an Alu-rich sequence.
- Use polyethylenimine (PEI) as transfection reagent.
- Luciferase Assay: At 36h post-transfection, lyse cells and measure firefly and Renilla luciferase activity using a dual-luciferase assay kit (Promega).
- Data Analysis: Normalize firefly luminescence to Renilla. Calculate fold-induction relative to unstimulated controls and percentage suppression by ADAR1 isoforms.
Signaling Pathway & Model Visualization
Title: ADAR1 p150/p150 Regulation and Homeostatic Integration
Title: Experimental Workflow for ADAR1 Isoform Study
The Scientist's Toolkit
Table 3: Essential Research Reagents for ADAR1 p150/p110 Studies
| Reagent / Material | Supplier Examples | Function in Experiment |
|---|---|---|
| Isoform-specific siRNAs | Dharmacon, Sigma-Aldrich | Selective knockdown of p150 (targeting exon 1A) or p110 (targeting shared exons) to delineate isoform-specific functions. |
| Anti-ADAR1 (p150 specific) Antibody | Abcam (ab126745), Sigma-Aldrich | Detects p150 protein exclusively via its unique N-terminus in Western blot or immunofluorescence. |
| Anti-ADAR1 (pan) Antibody | Santa Cruz (sc-73408), Cell Signaling | Recognizes both isoforms, useful for total ADAR1 protein level assessment. |
| Recombinant Human IFN-β | PBL Assay Science, R&D Systems | Induces p150 expression via the JAK/STAT pathway for stimulation experiments. |
| pCMV6-ADAR1-p150 & -p110 Plasmids | Origene, addgene | For ectopic overexpression of individual isoforms in cell culture models. |
| IFN-β Luciferase Reporter Plasmid | Promega, addgene | Measures activation of the innate immune pathway downstream of MDA5/MAVS. |
| Poly(I:C) HMW / LMW | InvivoGen, Sigma-Aldrich | Synthetic dsRNA analog; HMW (cytosolic sensors) and LMW (endosomal TLR3) used to trigger immune response. |
| REDITools2 / SPRINT Software | Open Source (GitHub) | Bioinformatics pipelines for accurate identification and quantification of A-to-I editing sites from RNA-seq data. |
| Dual-Luciferase Reporter Assay System | Promega | Quantifies firefly (experimental) and Renilla (control) luciferase activity for reporter assays. |
| RiboMinus Eukaryote Kit v2 | Thermo Fisher | Depletes ribosomal RNA for total RNA-seq, improving coverage of non-coding Alu-rich regions. |
Conclusion
The ADAR1 p150 isoform emerges as a pivotal, interferon-driven hub at the intersection of RNA biology, innate immunity, and human disease. Its unique inducible nature and cytoplasmic localization equip it specifically to dampen the interferon response by editing endogenous immunogenic dsRNA, preventing inappropriate activation of MDA5 and PKR. This foundational role is validated by the severe autoimmune phenotypes seen upon its loss. Methodologically, the field has advanced with isoform-specific tools, yet challenges remain in cleanly dissecting its dual Z-binding and editing functions. Therapeutically, modulating p150 activity presents a double-edged sword: inhibition may enhance antitumor immunity and viral oncolysis, while stabilization or enhancement could treat interferonopathies like AGS. Future research must delineate the precise molecular rules governing its substrate selection, explore tissue-specific functions, and accelerate the development of isoform-selective therapeutics. Understanding ADAR1 p150 is no longer a niche pursuit but a crucial endeavor for advancing immunology, virology, and precision medicine.