Benchmarking RNA Structure Prediction: A Comprehensive Review of Algorithms, Challenges, and Clinical Applications
The accurate prediction of RNA structure is a cornerstone for understanding gene regulation and developing RNA-based therapeutics.
Benchmarking RNA Structure Prediction: A Comprehensive Review of Algorithms, Challenges, and Clinical Applications
Abstract
The accurate prediction of RNA structure is a cornerstone for understanding gene regulation and developing RNA-based therapeutics. This article provides a comprehensive benchmark and analysis of the rapidly evolving landscape of computational methods for RNA structure prediction, from classical thermodynamics-based approaches to modern deep learning and large language models. We explore the foundational principles, methodological advances, and significant challenges such as the 'generalization crisis' and data scarcity. A special focus is placed on rigorous, homology-aware validation frameworks and curated benchmark datasets. By synthesizing performance comparisons and future directions, this review serves as an essential guide for researchers and drug development professionals navigating the tools that bridge RNA sequence to function.
The RNA Folding Problem: From Biological Roots to Computational Challenges
The Critical Link Between RNA Structure and Biological Function
Ribonucleic acids (RNAs) are versatile macromolecules involved in a vast array of cellular processes, including protein synthesis, RNA splicing, and transcription regulation [1]. The biological function of an RNA molecule is fundamentally determined by its three-dimensional (3D) structure [2]. This folding dictates the RNA's biological activity and its interactions with other molecules, such as proteins, small molecules, and other RNAs [2]. Understanding RNA structure is therefore paramount for deciphering RNA biology and has profound implications for therapeutic development, including RNA-targeting drugs and mRNA-based vaccines [3] [4]. However, the conformational flexibility of RNA molecules has made the experimental determination of their 3D structures challenging. As of December 2023, RNA-only structures constitute less than 1.0% of the ~214,000 entries in the Protein Data Bank (PDB) [3]. This vast gap between known RNA sequences and solved 3D structures has driven the development of computational methods for predicting RNA 3D structures from sequence data, creating a critical need for systematic benchmarking to guide researchers and clinicians in selecting the most appropriate tools [1] [2].
Computational methods for RNA 3D structure prediction generally fall into three categories: ab initio methods, which simulate the physics of the system; template-based methods, which leverage known structural motifs; and deep learning (DL) methods, which use neural networks to predict structures from sequence or evolutionary data [1] [2]. A systematic benchmark of state-of-the-art methods reveals distinct performance trends, crucial for informed tool selection.
Table 1: Key Performance Metrics of RNA 3D Structure Prediction Methods on RNA-Puzzles Datase
| Method | Type | Average RMSD (Å) | Average TM-Score | Key Input Features |
|---|---|---|---|---|
| RhoFold+ [3] | Deep Learning | 4.02 | 0.57 | RNA sequence, MSA, RNA-FM embeddings |
| FARFAR2 (top 1%) [3] | Fragment Assembly | 6.32 | ~0.44 | RNA sequence, knowledge-based potential |
| DeepFoldRNA [2] | Deep Learning | Best overall | - | MSA, Secondary Structure |
| DRFold [2] | Deep Learning | Second best | - | Predicted secondary structure |
| RoseTTAFoldNA [3] | Deep Learning | Variable | - | MSA, Secondary Structure constraints |
Performance data compiled from independent benchmarking studies [3] [2]. RMSD (Root Mean Square Deviation) measures the average distance between atoms in predicted and experimental structures; lower is better. TM-Score measures global structural similarity; a score >0.5 indicates generally correct topology.
The benchmarking data indicates that deep learning methods generally outperform traditional fragment-assembly-based approaches [2]. Among DL methods, DeepFoldRNA achieves the best prediction results overall, closely followed by DRFold as the second-best method [2]. The performance of RhoFold+ is particularly noteworthy; a retrospective evaluation on RNA-Puzzles targets demonstrated its superiority over existing methods, including human expert groups, achieving an average RMSD of 4.02 Å, which was 2.30 Å better than the second-best model (FARFAR2) [3].
However, the benchmark also highlights a significant challenge: on "orphan RNAs" with no close evolutionary relatives in databases, the performance of DL-based methods is only marginally better than that of traditional non-ML methods, and generally, all methods perform poorly on such targets [2]. This underscores a critical limitation related to the quality and depth of Multiple Sequence Alignments (MSA), which are crucial for many DL methods [2].
Table 2: Comparative Analysis of RNA 3D Structure Prediction Methods
| Method | Strengths | Limitations | Best Use Cases |
|---|---|---|---|
| Deep Learning (e.g., DeepFoldRNA, RhoFold+) | High accuracy on targets with good MSA coverage; End-to-end prediction [2] [3] | Performance drops on orphan RNAs; Computationally intensive MSA search [2] | Predicting structures for RNAs with evolutionary relatives |
| Fragment Assembly (e.g., FARFAR2) | Does not rely on evolutionary data; Physical realism | Lower average accuracy; Computationally intensive sampling [3] [2] | Orphan RNAs, preliminary screening |
| Ab Initio & Coarse-Grained (e.g., SimRNA, OxRNA) | Provides folding thermodynamics; Explores conformational landscape [1] | Often low resolution; Challenging to achieve atomic accuracy [1] | Studying folding pathways, large complexes |
Experimental Protocols in Algorithm Benchmarking
To ensure fair and informative comparisons, benchmarking studies follow rigorous experimental protocols. Understanding these methodologies is essential for interpreting results and applying them to real-world research problems.
Dataset Curation and Preparation
Benchmarks rely on high-quality, non-redundant datasets of experimentally determined RNA structures. A common approach involves curating all available RNA 3D structures from the PDB and processing them to create representative sets. For example, one benchmark used the BGSU representative sets of RNA structures, focusing on single-chain RNAs and reducing redundancy by clustering sequences with Cd-hit at an 80% sequence similarity threshold, resulting in 782 unique sequence clusters from 5,583 RNA chains [3]. This careful curation minimizes bias and prevents overfitting during evaluation.
Feature Extraction and Input Generation
The performance of prediction methods is heavily influenced by the quality of their inputs. Standard protocols involve:
- Multiple Sequence Alignment (MSA) Generation: Searching input sequences against large sequence databases (e.g., Rfam) to find homologous sequences and build MSAs, which provide evolutionarily informed constraints [3] [2].
- Secondary Structure Prediction: Using tools like Superfold or RNAstructure to predict base-pairing interactions, which serve as important constraints for 3D structure modeling [5] [2].
- Language Model Embeddings: Methods like RhoFold+ utilize large RNA language models (e.g., RNA-FM) pretrained on millions of RNA sequences to extract evolutionarily and structurally informed embeddings directly from the sequence [3].
Evaluation Metrics and Validation
To quantitatively assess prediction accuracy, benchmarks employ several standardized metrics:
- Root Mean Square Deviation (RMSD): Measures the average distance between corresponding atoms in predicted and experimental structures after optimal superposition. Lower values indicate better accuracy [3].
- Template Modeling (TM) Score: A superposition-free metric that assesses global structural similarity. A score >0.5 indicates generally correct topology, with higher scores being better [3].
- Local Distance Difference Test (lDDT): A superposition-free score that evaluates local distance differences for all atoms in a model, providing a more robust measure of local accuracy [3].
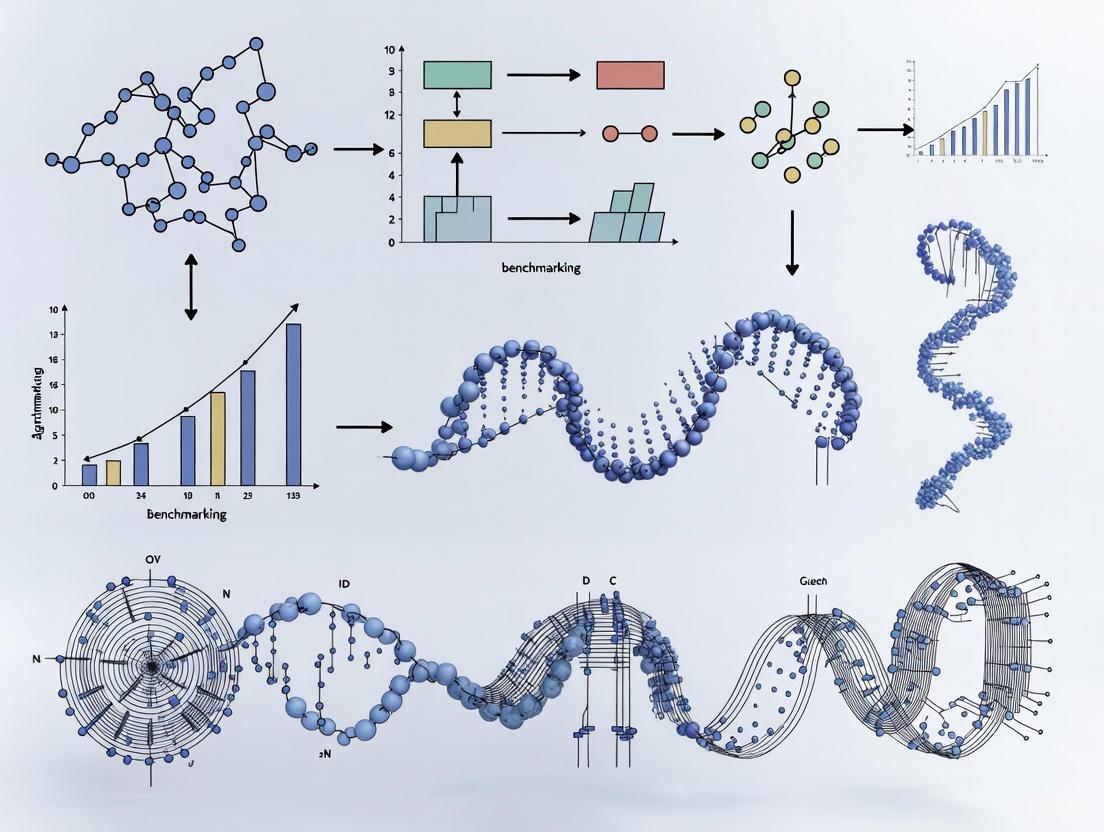
The following diagram illustrates the typical end-to-end workflow for benchmarking RNA structure prediction methods, from data preparation to performance evaluation:
Successful RNA structure prediction and validation requires a suite of computational tools and resources. The table below details key solutions used in the featured benchmarking experiments.
Table 3: Essential Research Reagent Solutions for RNA Structure Analysis
| Resource / Tool | Type | Primary Function | Application in Benchmarking |
|---|---|---|---|
| RhoFold+ [3] | Deep Learning Model | End-to-end RNA 3D structure prediction | State-of-the-art method for single-chain RNA prediction |
| DeepFoldRNA [2] | Deep Learning Model | Predicts 3D structures using MSA and secondary structure | Top-performing method in independent benchmarks |
| RNA-FM [3] | Language Model | Generates evolutionarily informed RNA sequence embeddings | Provides feature representations for RhoFold+ |
| ViennaRNA [4] | Software Package | Predicts RNA secondary structure and folding dynamics | Provides secondary structure constraints |
| RSCanner [5] | R Package | Scans RNA transcripts for structured regions | Identifies stable regions for downstream structural analysis |
| Rfam [5] | Database | Collection of RNA families and alignments | Source for MSA construction and evolutionary data |
| BGSU Representative Sets [3] | Curated Dataset | Non-redundant collection of RNA structures | Training and testing data for method development |
The systematic benchmarking of RNA structure prediction algorithms reveals a rapidly evolving field where deep learning methods have established a clear performance advantage for RNAs with evolutionary relatives. Tools like DeepFoldRNA and RhoFold+ represent the current state-of-the-art, demonstrating remarkable accuracy on standardized tests like RNA-Puzzles [3] [2]. However, significant challenges remain, particularly for orphan RNAs and conformationally dynamic molecules.
The critical link between RNA structure and biological function continues to drive methodological innovations. Future progress will likely depend on several key factors: expanding the database of experimentally solved RNA structures to improve training data for DL methods, developing better approaches for predicting non-Watson-Crick base pairs, and creating algorithms that can more effectively handle RNA's inherent structural dynamics [2]. For researchers and drug development professionals, the current benchmarking data provides valuable guidance for tool selection while highlighting the importance of choosing methods aligned with specific research goals, whether studying well-conserved RNA families or exploring the vast landscape of RNAs with unknown structures.
The Widening Sequence-Structure Gap and the Need for Computational Tools
The field of RNA biology is experiencing a data deluge. Advances in high-throughput sequencing have generated an immense volume of RNA sequence data, with over 85% of the human genome transcribed but only 3% encoding proteins [3]. This has created a rapidly widening gap between the number of known RNA sequences and those with experimentally determined structures. RNA-only structures comprise less than 1.0% of the ~214,000 structures in the Protein Data Bank (PDB), and RNA-containing complexes account for only 2.1% [3]. This disparity, known as the sequence-structure gap, represents a critical bottleneck in understanding RNA function and developing RNA-targeted therapeutics.
The conformational flexibility of RNA molecules has made experimental determination of their three-dimensional structures particularly challenging. Traditional methods like X-ray crystallography, NMR spectroscopy, and cryogenic electron microscopy, while valuable, remain low-throughput techniques with specialized requirements [3]. This limitation has propelled computational methods from complementary approaches to essential tools for bridging the sequence-structure divide. The development of accurate computational predictors is particularly crucial for RNA-based therapeutic design, where structure determines function, interaction capabilities, and ultimately, drug efficacy [6] [3].
Computational methods for RNA structure prediction have evolved into several distinct categories, each with unique strengths, limitations, and underlying methodologies. The table below summarizes the primary approaches currently employed by researchers.
Table 1: Computational Approaches for RNA Structure Prediction
| Method Category | Representative Tools | Key Principles | Strengths | Limitations |
|---|---|---|---|---|
| Thermodynamics-Based | RNAfold, RNAstructure [7] | Minimizes free energy using empirical parameters [7] | Physically intuitive principles | Limited by inaccurate energy parameters [7] |
| Fragment Assembly | Rosetta FARFAR2 [6] | Assembles 3D structures from RNA fragments [6] | Atomic-detail modeling | Computationally intensive; performance depends on secondary structure input [6] |
| Motif Assembly | RNAComposer [6] | Builds 3D structures using known structural motifs [6] | Fast prediction speed | Dependent on secondary structure input [6] |
| Deep Learning (MSA-based) | AlphaFold 3, RhoFold+ [3] | Uses multiple sequence alignments (MSAs) and deep learning | High accuracy demonstrated in benchmarks [3] | MSA construction is time-consuming [3] |
| Deep Learning (Language Models) | ERNIE-RNA, RNA-FM, RiNALMo [7] [8] | Learns representations from sequences using transformer architectures | No MSA required; faster inference [8] | Struggles with low-homology scenarios [8] |
The Emergence of RNA Language Models
A recent paradigm shift in the field has been the development of RNA Language Models (RNA-LMs). Inspired by success in protein and DNA modeling, these models are based on the Transformer architecture, particularly Bidirectional Encoder Representations from Transformers (BERT) [8]. They learn semantically rich numerical representations (embeddings) for each RNA base by training on massive datasets of RNA sequences in a self-supervised manner, typically using a Masked Language Modeling (MLM) objective where random bases in the input sequence are masked and predicted [8]. The hypothesis is that these embeddings capture evolutionary, structural, and functional information that can enhance performance on downstream tasks like structure prediction, even with limited labeled data [8].
Table 2: Overview of Representative RNA Large Language Models
| RNA-LLM | Year | Embedding Dimension | Pretraining Sequences | Model Parameters | Key Innovation |
|---|---|---|---|---|---|
| RNA-FM [8] | 2022 | 640 | 23.7 million | ~100 million | Pioneer general-purpose model trained on massive dataset |
| RNABERT [8] | 2022 | 120 | 76,237 | ~0.5 million | Incorporates Structural Alignment Learning (SAL) |
| ERNIE-RNA [7] [8] | 2024 | 768 | 20.4 million | ~86 million | Base-pairing informed attention bias |
| RiNALMo [8] | 2024 | 1280 | 36.0 million | ~650 million | Largest model; uses rotary positional embeddings |
| RNA-MSM [8] | 2024 | 768 | 3.1 million | ~96 million | Incorporates Multiple Sequence Alignment information |
Benchmarking Methodologies and Experimental Protocols
To objectively evaluate the performance of various computational tools, rigorous benchmarking against experimentally determined structures is essential. Standardized protocols and metrics allow for meaningful comparisons between methods.
Standard Evaluation Metrics and Datasets
The following metrics are commonly used to assess prediction accuracy:
- Root Mean Square Deviation (RMSD): Measures the average distance between corresponding atoms in predicted and experimental structures after optimal superposition. Lower values indicate better accuracy [6].
- Template Modeling (TM) Score: A metric for assessing the global similarity of two structures, with values ranging from 0 to 1 (higher is better) [3].
- Local Distance Difference Test (LDDT): A superposition-free score that evaluates local distance differences for all atoms in a model [3].
Commonly used benchmark datasets include:
- RNA-Puzzles: A community-wide blind trial for RNA structure prediction featuring various RNA targets [3].
- CASP15: The Critical Assessment of Structure Prediction competition, which includes RNA targets [3].
- BGSU Representative Sets: Curated sets of RNA structures from the PDB with reduced redundancy [3].
Experimental Workflow for Comparative Evaluation
The diagram below illustrates a standardized workflow for benchmarking RNA structure prediction tools, from data preparation to performance assessment.
Figure 1: Standard workflow for benchmarking RNA structure prediction algorithms.
Table 3: Key Research Reagents and Computational Resources for RNA Structure Analysis
| Resource Category | Specific Tools/Databases | Primary Function | Application in Research |
|---|---|---|---|
| Structure Databases | Protein Data Bank (PDB) [6] | Repository of experimentally determined 3D structures | Source of ground truth data for training and benchmarking |
| Sequence Databases | RNAcentral [7] [8] | Comprehensive database of non-coding RNA sequences | Source of sequences for pre-training language models |
| Secondary Structure Predictors | RNAfold, CONTRAfold [6] | Predict RNA secondary structure from sequence | Provide input for methods like RNAComposer and FARFAR2 |
| Analysis & Visualization | PyMOL [6] | Molecular visualization system | Structural comparison and RMSD calculation |
| Specialized Benchmarks | RNA-Puzzles [3] | Community-wide blind prediction challenges | Standardized assessment of method performance |
Comparative Performance Analysis of Computational Tools
Performance on Established Benchmarks
Independent benchmarking studies provide crucial insights into the relative strengths of various approaches. A comprehensive 2025 evaluation of RNA Language Models revealed that while these models show promise, their performance varies significantly, particularly in challenging low-homology scenarios [8]. The study, which used a unified experimental setup across four benchmarks of increasing complexity, found that two LLMs (not named in the abstract) clearly outperformed others, though all models faced significant challenges in cross-family predictions [8].
Retrospective evaluations on the RNA-Puzzles dataset demonstrate the superiority of newer deep learning methods. RhoFold+ achieved an average RMSD of 4.02 Å, significantly outperforming the second-best method (FARFAR2 at 6.32 Å) [3]. Similarly, on 17 of 24 RNA-Puzzles targets, RhoFold+ achieved RMSD values of <5 Å, with an average TM-score of 0.57, higher than other top performers (0.41-0.44) [3].
For tertiary structure prediction, studies comparing RNAComposer, Rosetta FARFAR2, and AlphaFold 3 on RNAs with known structures found that AlphaFold 3 generally produced more accurate structures directly from primary sequences, though with varying confidence levels [6]. In one case, RNAComposer achieved an RMSD of 2.558 Å for a Malachite Green Aptamer crystal structure, while AlphaFold 3 and FARFAR2 achieved 5.745 Å and 6.895 Å, respectively [6].
Performance Across RNA Types and Sizes
Tool performance varies considerably depending on RNA type and size. The table below summarizes quantitative results from comparative studies.
Table 4: Comparative Performance of RNA 3D Structure Prediction Tools
| RNA Target | Length (nt) | RNAComposer (RMSD) | FARFAR2 (RMSD) | AlphaFold 3 (RMSD) | RhoFold+ (RMSD) |
|---|---|---|---|---|---|
| Malachite Green Aptamer [6] | 38 | 2.558 Å | 6.895 Å | 5.745 Å | - |
| Human Glycyl-tRNA-CCC [6] | 76 | 5.899 Å* | 12.734 Å* | - | - |
| RNA-Puzzles Average [3] | Various | - | 6.32 Å | - | 4.02 Å |
| Varkud Satellite Ribozyme (PZ7) [3] | 186 | - | - | - | <5.0 Å |
Note: *With CONTRAfold secondary structure input; *Top 1% model*
Contextual Factors Influencing Tool Performance
Several contextual factors significantly impact tool performance:
Dependence on Secondary Structure Input: Traditional methods like RNAComposer and FARFAR2 show high sensitivity to the quality of secondary structure input. For human glycyl-tRNA, RNAComposer's RMSD improved from 16.077 Å to 5.899 Å when using CONTRAfold instead of RNAfold for secondary structure prediction [6].
Generalization Capabilities: Benchmarking studies indicate that methods like RhoFold+ show no significant correlation (R²=0.23 for TM-score) between performance and sequence similarity to training data, suggesting better generalization capabilities compared to template-based methods [3].
Impact of Training Data Composition: Studies with ERNIE-RNA demonstrated that model performance consistently improved with increasing training data size, while exclusion of specific RNA types (rRNA/tRNA or lncRNA) had minimal influence on perplexity, suggesting robust learning across RNA families [7].
Integrated Workflow and Future Directions
Recommended Integrated Approach for RNA Structure Analysis
Based on current benchmarking results, an integrated workflow leveraging the complementary strengths of different tools provides the most robust approach for RNA structure analysis. The following diagram illustrates a recommended pipeline.
Figure 2: Integrated workflow combining multiple computational approaches.
Emerging Trends and Research Directions
The field of RNA structure prediction is rapidly evolving with several promising directions:
Hybrid Methods: Combining the strengths of different approaches, such as using language model embeddings as input to physics-based or deep learning methods, shows promise for improving accuracy [9] [8].
Structure-Aware Language Models: Newer models like ERNIE-RNA, which incorporate base-pairing restrictions into the attention mechanism, demonstrate enhanced capability to capture structural features, achieving F1-scores up to 0.55 in zero-shot secondary structure prediction [7].
Addressing Generalization Gaps: Current research focuses on improving performance in low-homology scenarios, where even advanced LLMs face significant challenges [8].
Integration with Experimental Data: Methods that incorporate experimental constraints, such as chemical probing data, are emerging as powerful approaches for resolving structural ambiguities.
As the sequence-structure gap continues to widen, the development and rigorous benchmarking of computational tools remains essential for unlocking the functional secrets of RNA molecules. The integration of language model representations with physical constraints and experimental data represents the most promising path forward for accurate, generalizable RNA structure prediction.
{# The Historical Shift in Computational Methods}
::: {.callout-color} Summary of the Historical Shift in RNA Structure Prediction
| Era | Core Paradigm | Representative Methods | Key Strengths | Inherent Limitations |
|---|---|---|---|---|
| Classical | Thermodynamics & Alignment | RNAup, IntaRNA, RNAplex [10] | High positive predictive value (PPV), strong physical interpretability [10] | Limited by accuracy of energy parameters, struggles with remote homology [10] [7] |
| Modern | Deep Learning & Language Models | ERNIE-RNA, RhoFold+, DeepFoldRNA [7] [3] [2] | State-of-the-art accuracy, captures long-range dependencies, generalizes across families [7] [3] [2] | Dependent on quality and size of training data; performance can drop on "orphan" RNAs [2] |
:::
The field of RNA structure prediction has undergone a profound transformation, shifting from classical thermodynamics-based models to modern data-driven paradigms powered by deep learning. This evolution is centrally framed by rigorous benchmarking research that objectively quantifies the capabilities and limitations of each approach, providing critical insights for researchers and drug development professionals [10] [2].
Classical Foundations: Thermodynamics and Alignment
The classical paradigm for predicting RNA structure and interactions is rooted in biophysical principles and sequence alignment.
Core Principles and Methodologies
Classical algorithms primarily rely on calculating the Minimum Free Energy (MFE) of a given RNA sequence, operating on the principle that the native structure is the one with the lowest thermodynamic energy [10]. Alternatively, alignment-based methods use dynamic programming to identify stable interactions through local sequence complementarity [10]. Benchmarking studies often create a realistic testing environment by using entire target regions, such as full UTRs or coding sequences, rather than just short binding snippets [10].
A standard benchmarking protocol involves several key steps. First, researchers compile a dataset of manually curated and verified RNA-RNA interactions from diverse organisms, including eukaryotes, bacteria, and archaea [10]. To assess binding site prediction accuracy, performance is measured using:
- True Positive Rate (TPR/Sensitivity): The proportion of true binding nucleotides correctly identified.
- Positive Predictive Value (PPV/Precision): The proportion of predicted binding nucleotides that are correct [10].
The statistical significance of interaction scores is evaluated by comparing predictions for true targets against those for hundreds of dinucleotide-shuffled negative control sequences [10].
Performance and Limitations
Comprehensive benchmarks show that MFE tools which incorporate accessibility (e.g., RNAup, IntaRNA, RNAplex) achieve superior performance. They demonstrate high PPV across diverse datasets and can differentiate nearly half of all native interactions from non-functional backgrounds [10].
However, these methods face inherent constraints. Their accuracy is limited by the completeness and precision of their thermodynamic parameters [7]. Furthermore, purely alignment-based methods exhibit low PPV despite high TPR, and comparative techniques are ineffective for RNAs with few homologous sequences [10].
The Modern Paradigm: Deep Learning and Language Models
The advent of deep learning, particularly RNA language models (RLMs), represents a fundamental shift toward data-driven reasoning, moving away from reliance on pre-defined energy rules.
Architectural Innovations and Training
Modern RLMs are pre-trained on millions of non-annotated RNA sequences from databases like RNAcentral in a self-supervised manner, learning semantically rich representations of RNA bases [7] [11]. A key innovation is the move beyond single sequences to leverage evolutionary information through Multiple Sequence Alignments (MSAs), though this can be computationally expensive [3] [2].
These models integrate structural priors directly into their architecture. For instance, ERNIE-RNA modifies the transformer's self-attention mechanism with a base-pairing bias matrix, encouraging the model to attend to potentially pairing nucleotides based on canonical (AU, CG, GU) pairing rules [7]. For 3D structure prediction, models like RhoFold+ employ a complex, integrated workflow where RNA-FM embeddings and MSA features are processed by a transformer network (Rhoformer), and then a structure module with Invariant Point Attention (IPA) refines atomic coordinates [3].
Performance Benchmarks for Tertiary Structure
Independent, systematic benchmarking reveals that deep learning methods generally outperform traditional fragment-assembly approaches, with DeepFoldRNA consistently ranking as a top performer [2].
::: {.callout-color} Benchmarking Performance of Modern RNA 3D Structure Prediction Methods [2]
| Method | Core Input Features | Key Performance Insight |
|---|---|---|
| DeepFoldRNA | MSA, Secondary Structure | Best predicted models overall in independent benchmarks |
| RhoFold+ | RNA-FM embeddings, MSA | Superior performance on RNA-Puzzles, generalizes well to sequence-dissimilar targets [3] |
| DRfold | Predicted Secondary Structure | Second best in some benchmarks; faster as it is MSA-free but generally lower accuracy [2] |
| RoseTTAFold2NA | MSA, Secondary Structure | Deep learning-based method for RNA 3D structure prediction [2] |
| Fragment-Assembly (Non-ML) | Physics-based Principles | Outperformed by ML methods, especially on targets with available homologs [2] |
:::
These methods demonstrate a remarkable ability to generalize. For example, RhoFold+'s performance on RNA-Puzzles showed no significant correlation with sequence similarity between test and training data, indicating it learns fundamental structural principles rather than merely memorizing templates [3].
Critical Analysis: Performance Across Real-World Challenges
Benchmarking across diverse scenarios reveals the nuanced strengths and weaknesses of modern data-driven models.
The "Orphan RNA" and Low-Homology Challenge
A significant challenge for ML methods is predicting structures for "orphan RNAs" — those with no or few sequence homologs in databases [2]. In low-homology scenarios, the performance advantage of DL methods over traditional techniques narrows considerably, and all methods perform poorly [2] [11]. This underscores that the evolutionary information captured in MSAs remains a critical factor for accuracy, and its absence is a major limitation [2].
Secondary Structure and Non-Canonical Pairs
Most deep learning methods rely on or co-predict secondary structure as an intermediate step, and the quality of this prediction is a major determinant of final 3D model accuracy [2]. However, a common weakness is that most current methods are unable to accurately predict non-Watson-Crick base pairs, which are crucial for forming complex tertiary folds [2].
The Scientist's Toolkit: Essential Research Reagents
::: {.callout-color} Key Research Reagents and Computational Tools for Benchmarking
| Item | Function in Research | Example Use Case |
|---|---|---|
| Verified Interaction Datasets | Curated gold-standard data for training and benchmarking algorithms [10] | Eukaryotic miRNAs, bacterial sRNA-mRNA pairs [10] |
| BGSU Representative RNA Sets | Non-redundant, clustered RNA structures for unbiased evaluation [3] [2] | Training and testing sets for 3D structure prediction methods [3] |
| Dinucleotide-Shuffled Sequences | Generate negative control sequences for statistical validation [10] | Significance testing of predicted interaction scores [10] |
| Multiple Sequence Alignment (MSA) Tools | Provide evolutionary information crucial for many DL models [3] [2] | Input for methods like DeepFoldRNA and RhoFold+ |
| RNA-Puzzles and CASP Targets | Blind community-wide challenges for impartial assessment [3] [2] | Retrospective benchmarking against other methods and expert groups [3] |
:::
Experimental Workflow and Logical Relationships
The following diagram illustrates the standard workflow and logical progression for a comprehensive benchmarking study of RNA structure prediction methods, from dataset preparation to final performance evaluation.
The historical shift from thermodynamic models to data-driven paradigms, rigorously documented through benchmarking, has unequivocally advanced the field of RNA structure prediction. Modern deep learning and language model-based methods have set new standards for accuracy, particularly for RNAs with evolutionary relatives. However, benchmarking research also clearly delineates the frontier of current capabilities: the accurate prediction of orphan RNAs and complex features like non-Watson-Crick pairs remains a significant challenge. Future progress will likely hinge on developing models that are less dependent on deep MSAs and can more effectively learn the biophysical rules of RNA folding from sequence alone. For researchers and drug developers, this evidence-based comparison underscores the importance of selecting prediction tools that are best suited for their specific RNA target of interest, considering factors such as RNA type, available homology, and the criticality of predicting non-canonical interactions.
Accurate prediction of RNA structure is fundamental to understanding its diverse biological functions and for applications in drug design and synthetic biology. While computational methods have made significant strides, three persistent obstacles critically define the frontier of current research: the profound scarcity of high-quality experimental data, the intricate challenge of predicting pseudoknots, and the need to represent RNA dynamic conformational ensembles. Benchmarking studies are essential for objectively evaluating how well new computational approaches address these hurdles. This guide provides a comparative analysis of contemporary algorithms, detailing their performance on standardized tasks, the experimental protocols used for validation, and the key reagents that empower this research. By framing the discussion within the context of these three core challenges, we offer a structured framework for researchers to assess the capabilities and limitations of current prediction tools.
Obstacle 1: Data Scarcity and Its Impact on Model Training
The development of robust deep learning models for RNA structure prediction is severely constrained by the limited availability of experimentally determined structures. RNA structures comprise less than 1% of the Protein Data Bank (PDB), creating a fundamental bottleneck for training data-intensive models [3] [12]. This scarcity is particularly acute for long non-coding RNAs (lncRNAs) and for 3D structure prediction, where the number of known structures is orders of magnitude smaller than for proteins [12] [13]. Consequently, models risk overfitting, and their generalizability to novel RNA classes or long sequences remains questionable.
To combat this, researchers leverage large-scale public data repositories and develop innovative training strategies. Key resources include the Sequence Read Archive (SRA) and Gene Expression Omnibus (GEO), which house vast amounts of raw sequencing data, and the ENCODE project, which provides quality-controlled functional genomics data [13]. For constructing specialized benchmarks, datasets like the one comprising over 320,000 instances from the RNAsolo and Rfam databases are becoming community standards, enabling more rigorous training and evaluation of algorithms for RNA design and structure prediction [14].
Table 1: Key Public Data Sources for RNA Structure Research
| Database/Resource | Primary Content | Utility in Overcoming Data Scarcity |
|---|---|---|
| Protein Data Bank (PDB) | Experimentally determined 3D structures of biomolecules. | Primary source of RNA 3D structures for training and testing; though RNA content is sparse [3]. |
| Rfam | Database of RNA families, with alignments and consensus secondary structures. | Provides a large collection of RNA sequences and their inferred secondary structures for model training [14]. |
| RNAsolo | A curated database derived from PDB, focusing on isolated RNA structures. | Offers a cleaned and annotated set of RNA 3D structures, reducing redundancy and improving data quality [14]. |
| Eterna100 | A manually curated set of 100 distinct secondary structure design challenges. | Serves as a benchmark for testing RNA inverse folding algorithms [14]. |
Obstacle 2: Predicting Pseudoknots and Long-Range Interactions
Pseudoknots are a key structural motif where a loop pairs with a complementary sequence outside its own stem, forming a bipartite helical structure. They are critically important for the function of many RNAs, including ribozymes and viral RNAs, but their prediction has been notoriously difficult [15] [12]. Thermodynamic-based prediction of pseudoknotted structures is an NP-hard problem, leading many traditional algorithms to avoid them entirely or use heuristic strategies that cannot guarantee optimal structure quality [15].
Recent deep learning approaches have made significant progress. KnotFold exemplifies a modern solution by integrating an attention-based neural network with a minimum-cost flow algorithm. The self-attention mechanism captures long-distance interactions and non-nested base pairs essential for pseudoknot identification, while the network flow algorithm efficiently finds the optimal combination of base pairs without restricting pseudoknot types [15]. Benchmarking on a set of 1,009 pseudoknotted RNAs (PKTest) demonstrated that KnotFold achieves higher accuracy than previous state-of-the-art methods [15].
Table 2: Comparative Performance on Pseudoknot Prediction
| Method | Core Approach | Reported Performance on PKTest (F1-score) | Key Advantage |
|---|---|---|---|
| KnotFold | Attention-based NN + Minimum-cost flow algorithm | > State-of-the-art (Exact value not specified in context) | Considers all possible base pair combinations; avoids hand-crafted energy functions [15]. |
| SPOT-RNA | Deep learning for base pairing probabilities. | (Baseline for comparison) | An earlier deep learning approach that demonstrated the potential of ML for base pair prediction [15] [14]. |
| E2Efold | Differentiable end-to-end deep learning model. | (Baseline for comparison) | Designed to learn constraints directly from data rather than relying on traditional rules [15]. |
| UFold | Deep learning on 2D representation of RNA sequence. | (Baseline for comparison) | Uses a fully convolutional network on images of RNA sequences to predict structures [15]. |
Experimental Protocol: Benchmarking Pseudoknot Prediction
The standard protocol for evaluating pseudoknot prediction involves several key steps to ensure a fair and meaningful comparison:
- Benchmark Dataset Curation: A standardized dataset of RNA sequences with known pseudoknotted structures is essential. The PKTest set, comprising 1,009 pseudoknotted RNAs, is a representative example used for this purpose [15]. It is crucial that the test sequences are non-homologous with any data used in the training of the models to prevent overfitting.
- Metrics for Evaluation: The standard metrics used are:
- Comparative Execution: All algorithms are run on the same benchmark dataset using their default parameters or recommended settings. The resulting predicted structures are then compared against the experimentally determined reference structures.
- Statistical Analysis: The performance metrics are calculated for each method, and statistical tests should be conducted to determine if the differences in performance are significant [16].
Diagram 1: Pseudoknot Benchmarking Workflow
Obstacle 3: Capturing Dynamic Structural Ensembles
RNA is not a static molecule; it exists as a dynamic ensemble of conformations that are critical for its function [17] [18]. Traditional experimental methods and computational predictions often provide only a single "snapshot" of the structure, averaging signals from multiple conformations and failing to capture the inherent flexibility and heterogeneity of RNA [12]. Molecular dynamics (MD) simulations can model these dynamics but are computationally prohibitive for exploring large conformational spaces [17].
Generative AI models are now emerging to address this challenge directly. DynaRNA is a diffusion-based model that generates diverse RNA conformational ensembles. It employs a Denoising Diffusion Probabilistic Model (DDPM) with an Equivariant Graph Neural Network (EGNN) to directly model RNA 3D coordinates, enabling rapid exploration of the conformational landscape orders of magnitude faster than MD simulations [17]. In benchmarks, it has demonstrated the ability to capture rare excited states, such as in the HIV-1 TAR RNA, and accurately reproduce de novo folding of tetraloops [17]. While AlphaFold3 can also predict nucleic acid structures, it is predominantly confined to predicting single, stable conformations rather than generating a full ensemble [17].
Table 3: Comparative Performance on Dynamic Ensemble Prediction
| Method | Core Approach | Reported Performance | Key Advantage |
|---|---|---|---|
| DynaRNA | Diffusion model with E(3)-equivariant GNN. | Captures rare excited state of HIV-1 TAR; Recapitulates tetraloop folding. | Generates a diverse conformational ensemble; Fast sampling compared to MD [17]. |
| AlphaFold3 | Diffusion-based architecture for biomolecules. | High accuracy on single-state predictions (e.g., RNA-Puzzles). | Extends accurate structure prediction to nucleic acids and complexes [17] [3]. |
| Molecular Dynamics | Physics-based simulation of atomic movements. | Reference for "ground truth" dynamics. | Models time-resolved dynamics with high theoretical fidelity, but is computationally expensive [17]. |
Experimental Protocol: Validating Structural Ensembles
Validating predicted conformational ensembles requires comparing their statistical properties against experimental or simulation-derived references.
- Generation: DynaRNA uses a partial noising scheme (e.g., 800 steps out of a full 1024) on an input RNA structure, followed by a reverse denoising process to generate a diverse set of conformations [17].
- Validation against Reference Data: The generated ensemble is compared to a reference, such as an ensemble from long-timescale MD simulations using the D. E. SHAW force field [17].
- Key Comparison Metrics:
- Jensen-Shannon (JS) Divergence: Measures the similarity between the probability distributions of structural features (e.g., distances, angles) in the generated and reference ensembles. A lower value indicates better agreement [17].
- Radius of Gyration (Rg): A measure of the overall compactness of the molecule. The distribution of Rg in the ensemble should match the reference.
- Local Geometry Fidelity: Bond lengths and angles (e.g., C5'–C4' bond length) in the generated ensemble are compared against high-resolution RNA structures in the PDB, with Mean Absolute Error (MAE) as a key metric [17].
Advancing the field of RNA structure prediction relies on a suite of computational and data resources. Below is a table of key "research reagents" essential for benchmarking and development.
Table 4: Essential Research Reagents for RNA Structure Benchmarking
| Resource / Tool | Type | Function in Research |
|---|---|---|
| BGSU Representative Sets | Curated Dataset | Provides non-redundant, high-quality RNA 3D structures from the PDB, essential for training and testing without data leakage [3]. |
| RhoFold+ | Prediction Algorithm | An RNA language model-based method that sets a high benchmark for accurate 3D structure prediction of single-chain RNAs on tests like RNA-Puzzles [3]. |
| KnotFold | Prediction Algorithm | A tool specifically designed to benchmark against, due to its advanced handling of pseudoknots using a minimum-cost flow algorithm [15]. |
| DynaRNA | Prediction Algorithm | A generative model used to benchmark the ability to predict dynamic conformational ensembles, not just single structures [17]. |
| FARFAR2 | Prediction Algorithm | A widely used de novo RNA 3D structure prediction method (from the Rosetta suite) that serves as a traditional baseline in performance comparisons [3]. |
| RnaBench | Benchmark Library | A library providing standardized benchmarks, datasets, and evaluation protocols for RNA structure prediction and design tasks [14]. |
Diagram 2: From Obstacles to AI Solutions
A Taxonomy of Modern RNA Structure Prediction Algorithms
RNA structure prediction is a fundamental problem in computational biology, where function is largely determined by molecular structure. Classical computational approaches, developed over decades, provide the foundation for understanding RNA biology without sole reliance on expensive experimental methods. These methods primarily fall into three categories: energy-based methods that predict structures by minimizing free energy; co-evolutionary methods that leverage comparative sequence analysis; and grammar-based methods that use formal syntactic rules to model structural motifs. This guide objectively compares the performance and methodologies of these classical approaches, framing them within contemporary benchmarking studies to highlight their enduring relevance and specific applications in modern RNA research pipelines.
The three classical approaches employ distinct principles and algorithms to solve the RNA secondary structure prediction problem. The table below summarizes their core characteristics, advantages, and limitations.
Table 1: Core Characteristics of Classical RNA Secondary Structure Prediction Methods
| Method Category | Fundamental Principle | Typical Algorithms | Key Advantages | Inherent Limitations |
|---|---|---|---|---|
| Energy-Based | Finds the structure with the Minimum Free Energy (MFE) using thermodynamic parameters [19] | RNAfold (ViennaRNA), RNAstructure [20] | • Strong physicochemical basis• Does not require multiple sequences• Fast prediction for single sequences | • Accuracy limited by energy parameter quality [19]• Struggles with pseudoknots and non-canonical pairs [20] |
| Co-evolutionary | Identifies covarying mutations in evolutionarily related sequences to infer base pairs [20] | Comparative sequence analysis, Pfold [21] | • Highly accurate for conserved RNA families [20]• Can predict complex structures | • Requires a set of homologous sequences• Performance drops for novel or isolated sequences [20] |
| Grammar-Based | Uses formal syntactic rules (e.g., SCFGs) to generate probable secondary structures [22] [21] | Stochastic Context-Free Grammars (SCFGs) [21] | • Strong statistical foundation• Unifies structure and evolution modeling (e.g., Pfold) [21] | • Grammar design can be arbitrary [21]• Model training requires curated data |
Performance Benchmarking and Experimental Data
Benchmarking on large, diverse datasets is crucial for obtaining reliable performance measures of RNA structure prediction algorithms. Studies have shown that average accuracy on small, specific RNA classes can be misleading, with confidence intervals for F-measure having an 8% range on a set of 89 Group I introns, compared to a more reliable 2% range on datasets with over 2000 RNAs [19].
The following table summarizes the quantitative performance of these classical methods based on historical benchmarking efforts.
Table 2: Benchmarking Performance of Classical RNA Structure Prediction Methods
| Method Category | Representative Algorithm & Parameters | Reported F-Measure (Sensitivity, PPV) | Benchmark Dataset & Notes |
|---|---|---|---|
| Energy-Based | MFE with BL* parameters [19] | 0.686 | Large dataset (S-Full, 3245 sequences). BL* parameters slightly outperformed CG* and Turner99 [19]. |
| Energy-Based | MFE with Turner99 parameters [19] | ~0.66 (inferred) | Performance is significantly lower than with optimized BL* parameters [19]. |
| Grammar-Based | Pseudo-MEA (Hamada et al.) with BL* parameters [19] | 0.711 | Outperformed both standard MEA-based and MFE methods on large datasets [19]. |
| Grammar-Based | SCFG (Manually Designed) [21] | ~0.64 (varies by grammar) | Performance highly dependent on specific grammar design [21]. |
Key Experimental Protocols in Benchmarking
The performance data presented in the previous section is derived from standardized experimental protocols designed to ensure fair and statistically robust comparisons.
- Dataset Curation: Benchmarking relies on large, non-redundant datasets of RNA sequences with known, experimentally validated reference structures. The S-Full dataset, comprising 3,245 sequences, is an example of a comprehensive benchmark set [19]. Sequences are often clustered to remove redundancy (e.g., at 80% sequence identity) to prevent bias [3].
- Accuracy Metrics: The primary metrics for evaluation are:
- Sensitivity (SN): The proportion of correctly predicted base pairs relative to all base pairs in the reference structure.
- Positive Predictive Value (PPV): The proportion of correctly predicted base pairs relative to all predicted base pairs.
- F-Measure: The harmonic mean of Sensitivity and PPV, providing a single balanced metric (F = 2 * SN * PPV / (SN + PPV)) [19].
- Statistical Validation: To ensure reliability, statistical methods like the bootstrap percentile method are used to establish confidence intervals for reported accuracies, confirming that performance differences on a given dataset are representative of broader trends [19].
- Cross-Family Validation: To test generalizability, family-wise cross-validation is employed, where models are trained on sequences from certain RNA families and tested on entirely different families. This is crucial for assessing performance on "out-of-distribution" RNAs [20].
Figure 1: A generalized workflow for benchmarking RNA secondary structure prediction algorithms, highlighting key steps from data curation to final statistical validation.
The Scientist's Toolkit: Essential Research Reagents
The development and benchmarking of classical RNA structure prediction methods rely on a set of key computational "reagents" – datasets, software, and parameters.
Table 3: Essential Research Reagents for Classical RNA Structure Prediction Research
| Reagent / Resource | Type | Primary Function | Example / Source | ||
|---|---|---|---|---|---|
| Reference Datasets | Data | Provide known structures for training and benchmarking algorithms. | ArchiveII (3966 RNAs) [20], bpRNA-TSO (1305 RNAs) [20], S-Full (3245 RNAs) [19] | ||
| Thermodynamic Parameters | Parameters | Provide free energy values for motifs (helices, loops) for energy-based methods. | Turner99 parameters [19], BL/CG parameters [19] | ||
| Non-Redundant PDB Sets | Data | Provide high-quality, experimentally solved 3D structures for validation and method development. | BGSU representative RNA sets [3] | ||
| Homologous Sequence Databases | Data | Provide multiple sequence alignments for co-evolutionary and some grammar-based methods. | Rfam database [20] [1] | ||
| Grammar Production Rules | Model | Define the syntactic rules for generating secondary structures in grammar-based approaches. | Rules in Double Emission Normal Form (e.g., T → . | (U) | UV) [21] |
| Parsing Algorithms | Software | Execute the grammars to find the most likely structure for a given sequence. | CYK (Cocke-Younger-Kasami) algorithm, Earley parser [22] [21] |
Energy-based, co-evolutionary, and grammar-based methods form the classical foundation of RNA secondary structure prediction. Benchmarking reveals that no single approach is universally superior; each has distinct strengths and operational domains. Energy-based methods offer speed and physical interpretability, co-evolutionary methods provide high accuracy for conserved families, and grammar-based methods offer a powerful statistical framework. The integration of their core principles—thermodynamic stability, evolutionary information, and syntactic modeling of structure—continues to inspire and underpin modern deep-learning approaches, cementing their role as essential components in the computational biologist's toolkit.
The field of RNA structure prediction is undergoing a profound transformation, driven by the adoption of advanced deep learning architectures. For decades, computational methods relied primarily on thermodynamic models and evolutionary analysis, which eventually plateaued in accuracy due to fundamental limitations in handling complex structural motifs and non-nested base pairs [23]. The emergence of deep learning has catalyzed a shift from these traditional paradigms to data-driven approaches that learn the complex sequence-to-structure mapping directly from experimental and synthetic data [23]. This revolution centers on two dominant architectural philosophies: fully end-to-end models that directly predict atomic coordinates or contact maps, and hybrid architectures that strategically integrate deep learning with biophysical principles or evolutionary information.
This comparison guide examines the current landscape of deep learning methods for RNA structure prediction within the critical context of benchmarking and generalization. Despite significant performance gains, the field faces a "generalization crisis" where powerful models often fail on unseen RNA families, prompting a community-wide shift to stricter, homology-aware benchmarking protocols [23]. Furthermore, unlike protein structure prediction which benefits from abundant structural data, RNA prediction methods must overcome the challenge of data scarcity, with RNA-only structures comprising less than 1.0% of the Protein Data Bank [3]. We objectively compare the performance, architectural trade-offs, and experimental validation of leading end-to-end and hybrid approaches to provide researchers, scientists, and drug development professionals with a clear framework for method selection and evaluation.
Architectural Paradigms: End-to-End vs. Hybrid Approaches
Deep learning methods for RNA structure prediction can be broadly categorized by their architectural philosophy and integration of prior knowledge. The distinction between these paradigms has significant implications for performance, data requirements, and generalizability.
Fully End-to-End Deep Learning Architectures
End-to-end models represent the purest form of data-driven approaches, employing single, unified neural networks that directly map input sequences to structural outputs. These architectures typically leverage very deep neural networks, often based on transformer or convolutional architectures, and minimize the incorporation of explicit biological knowledge in favor of learning patterns directly from data [23].
RhoFold+ exemplifies this approach for RNA 3D structure prediction. It functions as a fully automated, differentiable pipeline that begins with RNA sequence inputs and directly produces all-atom 3D models [3]. Its architecture integrates a large RNA language model (RNA-FM) pretrained on approximately 23.7 million RNA sequences to extract evolutionarily informed embeddings [3]. These embeddings are processed through a specialized transformer network (Rhoformer) and refined through multiple cycles before a geometry-aware structure module generates final atomic coordinates using an invariant point attention mechanism [3]. This comprehensive end-to-end approach demonstrates the capability of deep learning systems to manage the entire structure prediction pipeline without relying on external sampling or scoring modules.
Hybrid Deep Learning Architectures
Hybrid architectures strategically combine deep learning with established principles from biophysics, evolutionary biology, or thermodynamics. These approaches recognize that pure data-driven methods face challenges due to RNA's structural data scarcity, and seek to compensate by incorporating valuable inductive biases and physical constraints [20] [23].
BPfold represents this paradigm for RNA secondary structure prediction. It integrates thermodynamic energy calculations directly into its deep learning framework [20]. Specifically, BPfold employs a base pair motif library that enumerates the complete space of locally adjacent three-neighbor base pairs and records their thermodynamic energy through de novo modeling of tertiary structures [20]. The model's neural network incorporates a custom-designed "base pair attention block" that combines transformer and convolution layers to integrate information between the RNA sequence and the base pair motif energy [20]. This hybrid design allows BPfold to leverage the pattern recognition capabilities of deep learning while being grounded in the physical reality of RNA thermodynamics.
Another hybrid strategy incorporates evolutionary information through multiple sequence alignments (MSAs). Methods like DeepFoldRNA and trRosettaRNA utilize transformer networks to convert constructed MSAs and predicted secondary structures into various geometrical constraints, which are then used to predict RNA 3D structures through energy minimization [3]. Even some end-to-end models like RhoFold+ incorporate hybrid elements by optionally using MSAs alongside their primary sequence-based approach [3].
Table 1: Comparative Analysis of Architectural Paradigms
| Architectural Feature | End-to-End Models | Hybrid Models |
|---|---|---|
| Core Philosophy | Learn sequence-structure mapping directly from data | Integrate deep learning with biophysical/evolutionary principles |
| Data Requirements | Large datasets of sequences and structures | Can work with smaller datasets due to incorporated priors |
| Typical Architecture | Unified deep neural networks (transformers, CNNs) | Combination of neural networks with energy minimization, MSAs, or physical constraints |
| Interpretability | Lower; "black box" characteristics | Higher; incorporates understandable biological principles |
| Generalization | Can struggle with unseen RNA families without sufficient data | Often better generalization through physical constraints |
| Representative Examples | RhoFold+ (3D structure) [3] | BPfold (secondary structure) [20], DeepFoldRNA (3D structure) [3] |
Performance Benchmarking and Experimental Comparison
Rigorous benchmarking is essential for evaluating the performance of RNA structure prediction algorithms. Standardized assessments on established datasets like RNA-Puzzles and CASP15 provide objective comparisons between methods, while cross-family validation tests generalization capabilities to unseen RNA families [3] [23].
Experimental Protocols and Evaluation Metrics
Comprehensive benchmarking requires carefully designed experimental protocols that assess both accuracy and generalizability. Standard practice involves retrospective comparisons on community-wide challenges like RNA-Puzzles, where predictions are compared against experimentally determined structures [3]. For these evaluations, models must be trained using non-overlapping data with respect to the test targets to prevent overfitting and ensure fair comparison [3].
Key metrics for evaluation include:
- Root Mean Square Deviation (RMSD): Measures the average distance between corresponding atoms in predicted and experimental structures after optimal superposition, with lower values indicating better accuracy [3].
- Template Modeling (TM) Score: A superposition-free metric that assesses global structural similarity, with scores ranging from 0-1 (higher values indicate better agreement) [3].
- Local Distance Difference Test (LDDT): A superposition-free score that evaluates local distance differences for all atoms in a model [3].
- F1 Score for Secondary Structure: For secondary structure prediction, the harmonic mean of precision and recall for base pair identification [20] [23].
To address the "generalization crisis" in the field, contemporary benchmarking increasingly employs cross-family and cross-type assessments, where models are tested on RNA families not represented in the training data [23]. This provides a more realistic measure of performance on truly novel RNAs. Additionally, time-censored benchmarks that exclude recently solved structures from training data help evaluate real-world applicability [3].
Comparative Performance Analysis
Quantitative comparisons reveal the relative strengths of different architectural approaches. On the challenging RNA-Puzzles benchmark for 3D structure prediction, the end-to-end model RhoFold+ achieved an average RMSD of 4.02 Å, significantly outperforming the second-best method (FARFAR2: 6.32 Å) [3]. RhoFold+ also attained an average TM score of 0.57, higher than other top performers (0.41-0.44) [3]. These results demonstrate the substantial accuracy improvements possible with modern deep learning architectures.
For secondary structure prediction, the hybrid approach BPfold has demonstrated superior generalizability in cross-family validation. In experiments on sequence-wise and family-wise datasets including ArchiveII (3966 RNAs) and Rfam12.3-14.10 (10,791 RNAs), BPfold maintained high accuracy across diverse RNA families compared to other learning-based and non-learning methods [20]. This suggests that incorporating thermodynamic priors helps maintain performance on out-of-distribution RNAs.
Table 2: Performance Comparison of RNA Structure Prediction Methods
| Method | Architecture Type | Prediction Target | Key Performance Metrics | Generalization Assessment |
|---|---|---|---|---|
| RhoFold+ [3] | End-to-end | 3D structure | Avg. RMSD: 4.02 Å on RNA-Puzzles; Avg. TM-score: 0.57 | No significant correlation between performance and training-test similarity (R²=0.23 for TM-score) |
| BPfold [20] | Hybrid | Secondary structure | Superior accuracy on cross-family benchmarks; maintains performance on out-of-distribution RNAs | Excellent generalizability to unseen RNA families due to thermodynamic integration |
| RNA-LLMs [11] | Hybrid (with evolutionary info) | Secondary structure | Performance varies significantly; two LLMs clearly outperform others in benchmark | Significant challenges in low-homology scenarios |
| FARFAR2 [3] | Non-deep learning | 3D structure | Avg. RMSD: 6.32 Å on RNA-Puzzles (second best) | Traditional sampling approach, less data-dependent |
Critical Analysis of Benchmarking Results
While quantitative metrics provide essential performance measures, several nuanced factors influence their interpretation:
Training Data Dependencies: The relationship between training data and performance differs significantly between architectures. For RhoFold+, analysis revealed no significant correlation between model performance (measured by TM-score and LDDT) and sequence similarity between test and training data (R² values of 0.23 and 0.11 respectively) [3]. This suggests better generalization capabilities compared to methods more dependent on homology.
Complexity-Performance Trade-offs: Hybrid models like BPfold demonstrate that incorporating physical priors can enhance generalization, particularly valuable given the scarcity of RNA structural data [20]. This approach mitigates the data insufficiency problem that plagues purely data-driven methods.
Computation Time Considerations: While comprehensive runtime comparisons are not always available, MSA-based methods typically require extensive database searches that significantly increase computation time [3]. Single-sequence methods offer faster prediction but often at the cost of reduced accuracy, though next-generation methods aim to improve both speed and accuracy [3].
Research Reagents and Computational Tools
Implementing and evaluating deep learning methods for RNA structure prediction requires specific computational resources and benchmark datasets. The following tools and resources represent essential components of the modern RNA bioinformatics toolkit.
Table 3: Essential Research Reagents and Computational Tools
| Resource/Tool | Type | Function/Application | Access Information |
|---|---|---|---|
| RhoFold+ [3] | End-to-end prediction tool | Predicts 3D structures of single-chain RNAs from sequences | Method described in literature; availability of code varies |
| BPfold [20] | Hybrid prediction tool | Predicts RNA secondary structures using base pair motif energy | Method described in literature |
| RNA-FM [3] | Pre-trained language model | Provides evolutionarily informed embeddings for RNA sequences | Used within RhoFold+ pipeline |
| BGSU Representative Sets [3] | Curated dataset | Non-redundant RNA structure datasets for training and benchmarking | Publicly available from BGSU |
| RNA-Puzzles [3] | Benchmark dataset | Standardized targets for evaluating 3D structure prediction methods | Publicly available at rnapuzzles.org |
| ArchiveII [20] | Benchmark dataset | Contains 3966 RNAs for secondary structure evaluation | Publicly available |
| Rfam [23] | Database | RNA family annotations and alignments for evolutionary analysis | Publicly available |
Architectural Workflows and Methodologies
Understanding the operational flow of different architectural approaches provides insight into their relative strengths and implementation complexities. The following diagrams illustrate the core workflows for representative end-to-end and hybrid methods.
End-to-End Architecture: RhoFold+ Workflow
RhoFold+ End-to-End Prediction Pipeline
This workflow illustrates the fully automated, differentiable nature of RhoFold+. The process begins with RNA sequence input, which undergoes parallel processing through a pretrained language model (RNA-FM) and optional multiple sequence alignment analysis [3]. These features are integrated and refined through the specialized Rhoformer transformer network across multiple cycles [3]. Finally, a geometry-aware structure module with invariant point attention generates the complete all-atom 3D structure without requiring external sampling or scoring [3].
Hybrid Architecture: BPfold Workflow
BPfold Hybrid Prediction Workflow
BPfold's hybrid approach combines deep learning with thermodynamic principles. The system begins by processing the input RNA sequence through two parallel paths: generating base pair motif energy maps from a precomputed library of three-neighbor base pair motifs, and extracting sequence features [20]. These information streams are integrated through a custom-designed base pair attention block that applies an attention mechanism to both the RNA sequence features and the thermodynamic energy prior [20]. The combined features are processed through an architecture combining transformer and convolution layers before producing the final secondary structure prediction [20].
The deep learning revolution has fundamentally transformed RNA structure prediction, with both end-to-end and hybrid architectures demonstrating significant advantages over previous methodologies. Fully end-to-end models like RhoFold+ have achieved remarkable accuracy in 3D structure prediction, outperforming traditional methods and even human expert groups in standardized benchmarks [3]. Meanwhile, hybrid approaches like BPfold have shown superior generalizability to unseen RNA families by integrating physical priors with data-driven learning [20].
For researchers and drug development professionals, method selection involves important trade-offs. End-to-end architectures offer maximum convenience and often state-of-the-art performance on within-distribution predictions, while hybrid approaches provide better interpretability and generalization, which is particularly valuable for novel RNA targets with limited homologs [20] [23]. As the field addresses ongoing challenges including accurate prediction of pseudoknots, modeling of dynamic structural ensembles, and incorporation of chemical modifications, both architectural paradigms will continue to evolve [23].
The establishment of stricter benchmarking protocols and homology-aware evaluation represents crucial progress in the field [23]. Future advancements will likely incorporate increasingly sophisticated physical constraints while leveraging larger and more diverse training datasets. As these methods mature, they will enhance our fundamental understanding of RNA biology and accelerate the development of RNA-targeted therapeutics for human disease.
The Rise of RNA-Specific Large Language Models (LLMs)
The rapid expansion of unannotated RNA sequence data has created an unprecedented opportunity to apply artificial intelligence to decipher the language of RNA biology. Inspired by the revolutionary success of large language models (LLMs) in natural language processing and protein research, computational biologists have recently developed a new class of RNA-specific large language models (RNA-LLMs) [24]. These models leverage self-supervised learning on millions of RNA sequences to learn semantically rich numerical representations that capture intricate patterns linking sequence to structure and function [25]. Unlike traditional computational methods that rely on thermodynamic parameters or multiple sequence alignments, RNA-LLMs can potentially uncover complex, long-range dependencies within RNA sequences through the transformer architecture's self-attention mechanism [7]. This technological advancement represents a paradigm shift in computational RNA biology, offering new avenues for understanding RNA structure-function relationships and accelerating therapeutic development.
The significance of RNA-LLMs extends beyond academic curiosity into practical applications in drug discovery and development. With RNA becoming an increasingly attractive therapeutic target, accurately predicting RNA secondary and tertiary structures is crucial for understanding function and designing targeted interventions [26]. However, existing RNA language models vary considerably in their architectural designs, training datasets, and performance characteristics, creating a need for systematic benchmarking to guide researchers and drug development professionals in selecting appropriate models for specific applications. This review provides a comprehensive comparison of leading RNA-LLMs, focusing on their performance in structure prediction tasks within the broader context of benchmarking methodologies for RNA structure prediction algorithms.
Comparative Analysis of Leading RNA Language Models
Recent RNA-LLMs share a common foundation in the transformer architecture but employ distinct strategies to capture RNA-specific properties. Most models utilize a BERT-style framework pre-trained using masked language modeling (MLM), where the model learns to predict randomly masked nucleotides in sequences [25]. However, key architectural differences and training variations distinguish these models in their approach to capturing structural information.
ERNIE-RNA introduces a fundamental innovation through base-pairing-informed attention bias, incorporating canonical base-pairing rules (AU, CG, and GU pairs) directly into the self-attention mechanism [7]. This structural enhancement allows the model to learn RNA structural patterns through self-supervised learning without relying on potentially inaccurate predicted structures. The model comprises 12 transformer blocks with 12 attention heads each, resulting in approximately 86 million parameters trained on 20.4 million filtered RNA sequences from RNAcentral [7].
In contrast, RiNALMo prioritizes scale and modern architectural techniques, establishing itself as the largest RNA language model to date with 650 million parameters [26]. It incorporates rotary positional embedding (RoPE), SwiGLU activation functions, and FlashAttention-2 for computational efficiency. Pre-trained on 36 million non-coding RNA sequences from multiple databases, RiNALMo demonstrates exceptional capability in clustering RNA families in its embedding space, suggesting strong capture of structural and functional similarities [26].
Other notable models include RNA-FM, a pioneering model with 100 million parameters trained on 23.7 million non-coding RNAs, and RNA-MSM, which uniquely incorporates evolutionary information through multiple sequence alignment, though this requires computationally expensive homology searches [25]. RNABERT incorporates Structure Alignment Learning during pre-training based on Rfam seed alignments, while RNAErnie employs motif-aware pre-training with motif-level random masking [25].
Performance Comparison on Structure Prediction Tasks
Comprehensive benchmarking reveals significant performance variations among RNA-LLMs for secondary structure prediction. A unified evaluation framework assessing multiple models with the same downstream prediction architecture and datasets shows that models excelling in structure prediction often underperform in functional classification, and vice versa [27].
In rigorous testing across benchmarks of increasing generalization difficulty, two models—ERNIE-RNA and RiNALMo—consistently outperform others [25] [11]. Both models demonstrate remarkable capability in zero-shot secondary structure prediction, with ERNIE-RNA's attention maps achieving an F1-score of up to 0.55 without fine-tuning [7]. When fine-tuned, these models achieve state-of-the-art performance on various downstream tasks, including RNA structure and function predictions [7] [26].
Notably, RiNALMo shows exceptional generalization capability on secondary structure prediction for RNA families not encountered during training, overcoming a critical limitation of many deep learning methods that struggle with unseen families [26]. This generalization ability is visually evident in UMAP projections of model embeddings, where RiNALMo and ERNIE-RNA show clear separation of different RNA families compared to the overlapping clusters of other models like RNABERT [25].
Table 1: Architectural Specifications of Major RNA Language Models
| Model | Parameters | Training Sequences | Embedding Dimension | Key Architectural Features |
|---|---|---|---|---|
| ERNIE-RNA | 86 million | 20.4 million | 768 | Base-pairing informed attention bias |
| RiNALMo | 650 million | 36 million | 1280 | Rotary embedding, SwiGLU, FlashAttention-2 |
| RNA-FM | ~100 million | 23.7 million | 640 | Standard BERT architecture |
| RNA-MSM | ~96 million | 3.1 million | 768 | MSA-inspired transformer |
| RNABERT | 509,896 | 76,237 | 120 | Structure alignment learning |
| RNAErnie | ~105 million | ~23 million | 768 | Motif-aware masking |
Table 2: Performance Comparison on Secondary Structure Prediction
| Model | Intra-Family Accuracy | Inter-Family Generalization | Zero-Shot Capability |
|---|---|---|---|
| ERNIE-RNA | State-of-the-art | Strong | F1-score up to 0.55 |
| RiNALMo | State-of-the-art | Exceptional | Demonstrated |
| RNA-FM | High | Moderate | Limited |
| RNA-MSM | High with MSA | Limited without MSA | Not reported |
| RNABERT | Moderate | Limited | Limited |
Benchmarking Frameworks and Experimental Protocols
Standardized Evaluation Methodologies
The emergence of RNA-LLMs has necessitated robust benchmarking frameworks to enable fair model comparisons. Traditional evaluations often suffered from inconsistent experimental setups, making direct model comparisons challenging. Recent initiatives have established standardized benchmarking frameworks that address these limitations through consistent architectural modules and carefully curated datasets [28].
The RNAscope benchmark represents a comprehensive evaluation framework comprising 1,253 experiments spanning diverse subtasks of varying complexity, including structure prediction, interaction classification, and function characterization [28]. This systematic approach enables researchers to assess model generalization across RNA families, target contexts, and environmental features. Similarly, other benchmarking efforts have established curated datasets with increasing generalization difficulty, from intra-family to cross-family predictions, allowing for nuanced assessment of model capabilities [25] [11].
These benchmarks adhere to rigorous practices for bias-free evaluations, including homology-aware dataset partitioning to prevent data leakage and ensure proper assessment of generalization capabilities [25]. The datasets typically include multiple RNA families such as 5S RNA, tRNA, tmRNA, RNaseP, and SRP, enabling assessment of performance across diverse structural classes.
Experimental Workflow for Model Assessment
A standardized experimental workflow has emerged for benchmarking RNA-LLMs, particularly for secondary structure prediction tasks. The process typically begins with embedding generation, where each nucleotide in RNA sequences is converted to a numerical vector using the pre-trained RNA-LLMs [25]. These embeddings then feed into a consistent downstream prediction architecture—typically a deep neural network with convolutional or recurrent layers—that is identical across all compared models [25] [11]. This approach ensures that performance differences are attributable to the quality of the embeddings rather than variations in the prediction architecture.
The evaluation employs multiple datasets with varying difficulty levels, from benchmark datasets like ArchiveII to more challenging low-homology scenarios [11]. Performance is measured using standard metrics including F1-score, precision, recall, and Matthews correlation coefficient (MCC) for structure prediction, while function-related tasks may use accuracy and area under the curve (AUC) metrics [28].
Diagram 1: RNA-LLM Benchmarking Workflow - This diagram illustrates the standardized experimental workflow for evaluating RNA language models on structure prediction tasks.
Essential Research Reagents and Computational Tools
Implementing and working with RNA-LLMs requires specific computational resources and datasets. The following table details essential "research reagent solutions" for researchers interested in exploring RNA language models for structure prediction applications.
Table 3: Essential Research Reagents for RNA LLM Experiments
| Resource Category | Specific Examples | Function/Purpose | Availability |
|---|---|---|---|
| Pre-trained Models | ERNIE-RNA, RiNALMo, RNA-FM, RNABERT | Provide foundational RNA sequence representations for downstream tasks | GitHub repositories, Hugging Face |
| Benchmark Datasets | ArchiveII, RNAStralign, RNAscope benchmarks | Standardized datasets for model training and evaluation | Public repositories (e.g., GitHub, Kaggle) |
| Evaluation Frameworks | RNAscope, sinc(i) Lab Benchmark | Provide consistent evaluation protocols and metrics | GitHub repositories |
| Primary Data Sources | RNAcentral, Rfam, Ensembl non-coding RNAs | Source data for pre-training and fine-tuning models | Public databases |
| Structure Prediction Tools | RNAfold, RNAstructure | Traditional methods for comparison and baseline performance | Standalone software packages |
Implementation Considerations
Successful implementation of RNA-LLMs requires careful consideration of several technical factors. Model selection should align with specific research goals—models like ERNIE-RNA and RiNALMo excel in structural tasks, while specialized models like UTR-LM and CodonBERT perform better on mRNA-specific applications [7] [26]. Computational resources represent another critical consideration; while smaller models like RNABERT are more accessible, larger models like RiNALMo (650M parameters) require significant GPU memory and computational power for inference and fine-tuning [25].
Data composition and quality significantly impact model performance. Models trained on diverse RNA families generally demonstrate better generalization, though benchmarking results indicate persistent challenges in low-homology scenarios [11]. Researchers should also consider the embedding dimensionality, as higher-dimensional embeddings (e.g., RiNALMo's 1280 dimensions) may capture more nuanced information but require more computational resources [26].
Future Directions and Research Opportunities
The development of RNA-LLMs, while impressive, reveals several promising research directions. Current models still face generalization challenges in low-homology scenarios, indicating the need for improved training strategies or architectural innovations [25] [11]. The integration of RNA-LLMs with three-dimensional structure prediction represents another frontier, with initiatives like the RNA 3D Structure-Function Modeling benchmark providing foundations for this work [29].
Multimodal large language models (MLLMs) that can process diverse biological data types—including sequences, structures, and functional annotations—hold particular promise for advancing RNA research [24]. Additionally, the development of more efficient models that maintain performance while reducing computational requirements would significantly enhance accessibility for researchers with limited resources.
As noted in recent comparative reviews, current RNA-LLMs exhibit a performance trade-off between excelling in either structure prediction or functional classification, suggesting that more balanced unsupervised training approaches are needed [27]. Future work may also explore the integration of physical constraints and thermodynamic principles into language model architectures to enhance biological plausibility and prediction accuracy.
The rapid evolution of RNA-LLMs signals a transformative period in computational biology, where pre-trained models will increasingly serve as foundational tools for understanding RNA biology and accelerating therapeutic development. As benchmarking methodologies mature and model architectures advance, RNA language models are poised to become indispensable components of the RNA researcher's toolkit.
Specialized Tools for RNA-RNA Interaction and 3D Structure Prediction
Understanding the three-dimensional (3D) structure of RNA is crucial for elucidating its diverse biological functions, ranging from gene regulation to protein synthesis. However, the conformational flexibility of RNA molecules has made experimental determination of their 3D structures challenging and low-throughput. As of December 2023, RNA-only structures constitute less than 1.0% of the ~214,000 entries in the Protein Data Bank (PDB) [3]. This substantial gap between known RNA sequences and solved structures has accelerated the development of computational prediction methods. These methods fall into three primary categories: ab initio methods that simulate physical forces and energy landscapes, template-based approaches that leverage known structural motifs, and more recently, deep learning techniques that learn structure-prediction patterns from data [1]. This guide objectively compares the performance of specialized tools across these categories, framing the evaluation within the broader context of benchmarking methodologies for RNA structure prediction algorithms.
Methodological Approaches to Prediction
Categories of Predictive Tools
Computational methods for RNA structure prediction aim to determine the atomistic positions and interactions within an RNA molecule. They generally follow a process of sampling the conformational space to generate candidate structures, then discriminating among them to select the final model, often based on the lowest energy or the center of a cluster of low-energy structures [1].
Ab Initio Methods: These methods simulate the physics of the system, using molecular dynamics or Monte Carlo sampling to explore possible conformations. A key differentiator is their "granularity," or the number of representative atoms ("beads") per nucleotide. Examples include:
- SimRNA: Uses a 5-bead model and Monte Carlo sampling guided by an energy function that considers local and non-local interactions [1].
- OxRNA: A 5-bead coarse-grained model that uses virtual move Monte Carlo (VCMC) and umbrella sampling to characterize RNA thermodynamics [1].
- iFoldRNA: A three-bead per nucleotide method employing discrete molecular dynamics to simulate RNA folding [1].
- NAST: A one-bead (C3' atom) per residue method that uses knowledge-based statistical potential and is constrained by geometrical data from ribosome structures [1].
Template-Based Methods: These approaches rely on constructing a mapping between the target sequence and known structural motifs or fragments from a database of solved RNA structures. They are often constrained by the limited size and diversity of available template libraries [3] [1].
Deep Learning Methods: Leveraging artificial intelligence, these methods use neural network architectures to predict RNA 3D structures directly from sequence or evolutionary information. They can be further divided based on their input strategies:
- MSA-Based Methods: These build Multiple Sequence Alignments (MSAs) to extract co-evolutionary signals, which are then used to inform 3D structure prediction. While often more accurate, the MSA search can be computationally intensive [3].
- Language Model-Based Methods: Newer approaches, such as RhoFold+, use large language models pre-trained on millions of RNA sequences to generate evolutionarily informed embeddings, reducing or eliminating the dependency on explicit MSA construction [3].
- End-to-End Differentiable Methods: Frameworks like RoseTTAFoldNA and AlphaFold3 employ fully differentiable pipelines that directly predict all-atom 3D models from input sequences and features [3].
Specialized Tools for RNA-RNA Interaction Prediction
Predicting intermolecular RNA-RNA interactions presents a distinct challenge, as base pairing is a major contributor to the stability of these complexes. Computational methods for this task often adapt algorithms used for RNA secondary structure prediction. A comprehensive comparison of 14 methods found that the top-performing tools for predicting general intermolecular base pairs are typically non-comparative, energy-based tools that utilize accessibility information to predict short interactions [30]. A significant challenge for these tools is maintaining high prediction accuracy across biologically different data sets and increasing input sequence lengths, which has implications for de novo transcriptome-wide searches [30].
Benchmarking Experimental Protocols
To ensure fair and meaningful comparisons, tool evaluations must be conducted on standardized datasets using consistent metrics. Below is a detailed protocol representative of comprehensive benchmarking efforts in the field.
Workflow for Benchmarking RNA 3D Structure Prediction Tools
The following diagram illustrates the key stages in a standardized benchmarking workflow, from data preparation to performance evaluation.
Detailed Experimental Methodology
Data Curation and Quality Filtering:
- Source: RNA 3D structures are fetched from the RCSB Protein Data Bank (PDB). For rigorous benchmarking, a representative set like the BGSU RNA representative sets is often used [3] [31].
- Partitioning: RNA molecules from the same PDB file are split into independent, connected components based on RNA residues and their interactions [31].
- Filtering: Structures are filtered based on:
- Resolution: A typical cutoff is < 4.0 Å to ensure high-quality structures [31].
- Size: Systems may be limited to a length of 15 to 500 residues to manage computational expense [31].
- Protein Content: A critical but often overlooked filter removes RNA structures that are heavily structured through interactions with proteins, ensuring the benchmark assesses prediction of intrinsic RNA folding [31].
Redundancy Removal and Dataset Splitting:
- To prevent data leakage and overestimation of performance, the dataset must be split carefully. A common strategy is to cluster RNA molecules based on sequence or structure similarity.
- Clustering Algorithm: A graph is built where nodes are RNA molecules and edges connect molecules with a similarity score above a specific threshold (e.g., 80% sequence identity using CD-HIT, or a structural similarity threshold using US-align). The resulting connected components form the clusters [31].
- Splitting: Training and test sets are constructed such that no cluster is split across them. For a blind test, the highest-resolution system from each cluster is selected for the test set [3] [31].
Tool Execution and Performance Metric Calculation:
- Each tool is executed on the held-out test set of RNA sequences with known experimental structures.
- Predictions are compared against experimental ground truth using standard metrics:
- RMSD (Root Mean Square Deviation): Measures the average distance between corresponding atoms in superimposed structures. Lower values indicate better accuracy [3] [1].
- TM-score (Template Modeling Score): A superposition-free metric that assesses global fold similarity. Scores range from 0-1, with higher scores indicating better topology conservation [3].
- lDDT (local Distance Difference Test): A superposition-free score that evaluates local distance differences for all atoms in a model, providing a robust measure of local geometry [3].
Performance Comparison of RNA 3D Structure Prediction Tools
The following tables summarize quantitative performance data from recent large-scale benchmarks, providing a direct comparison of leading tools.
Table 1: Performance on RNA-Puzzles Benchmark (Single-Chain RNAs)
This table summarizes the performance of various methods on the community-wide RNA-Puzzles challenge, a standard for evaluating 3D structure prediction. The data demonstrates the performance gap between different methodological approaches [3].
| Prediction Method | Category | Average RMSD (Å) | Average TM-score | Key Features / Inputs |
|---|---|---|---|---|
| RhoFold+ | Deep Learning (Language Model) | 4.02 | 0.57 | RNA-FM embeddings, MSA integration, end-to-end pipeline [3] |
| FARFAR2 | Ab Initio (Fragment Assembly) | 6.32 | 0.44 | Rosetta energy function, Monte Carlo sampling [3] |
| RoseTTAFoldNA | Deep Learning (End-to-End) | Data Not Provided | Data Not Provided | MSA, 2D structure constraints, end-to-end pipeline [3] |
| AlphaFold3 | Deep Learning (Diffusion) | Data Not Provided | Data Not Provided | MSA, diffusion-based coordinate prediction [3] |
| SimRNA | Ab Initio (Coarse-Grained) | Data Not Provided | Data Not Provided | 5-bead model, statistical potential, Monte Carlo [1] |
Table 2: Characteristics of Representative RNA 3D Structure Prediction Methods
This table provides a qualitative comparison of various tools, highlighting their methodologies, requirements, and practical considerations for researchers [1].
| Tool Name | Category | Granularity (Beads/Nt) | Sampling Method | Required Input | Availability |
|---|---|---|---|---|---|
| RhoFold+ | Deep Learning | All-Atom | Differentiable Refinement | Sequence (MSA optional) | Not Specified |
| SimRNA | Ab Initio | 5 | Monte Carlo | Sequence | Web Server, Standalone |
| OxRNA | Ab Initio | 5 | Virtual Move Monte Carlo | Sequence, Topology File | Web Server, Source Code |
| NAST | Ab Initio / Knowledge-Based | 1 | Knowledge-Based Sampling | Sequence | Source Code (Python 2) |
| iFoldRNA | Ab Initio | 3 | Discrete Molecular Dynamics | Sequence (2D Structure optional) | Web Server (Account Required) |
| Ernwin | Template-Based / Ab Initio | Helix-based | Markov Chain Monte Carlo | 2D Structure | Web Server, Source Code |
Successful RNA structure prediction and benchmarking rely on a foundation of key datasets, software libraries, and computational resources. The following table details essential "research reagents" for practitioners in the field.
| Resource Name | Type | Primary Function | Relevance in Research |
|---|---|---|---|
| Protein Data Bank (PDB) | Data Repository | Archive of experimentally determined 3D structures of proteins and nucleic acids. | Source of ground-truth structures for training, benchmarking, and template-based modeling [3] [31]. |
| BGSU Representative Set | Curated Dataset | A non-redundant set of RNA structures clustered by sequence and structure similarity. | Provides a standardized, high-quality dataset for method development and evaluation, reducing redundancy bias [3]. |
| RNA-Puzzles | Benchmarking Initiative | A community-wide blind assessment of RNA 3D structure prediction. | Serves as a gold-standard, unbiased benchmark for comparing the performance of new tools against state-of-the-art methods [3]. |
| rnaglib | Python Package | A library for graph-based representation and machine learning on RNA 3D structures. | Facilitates the development and benchmarking of structure-based RNA models by providing data handling and encoding tools [31]. |
| CD-HIT / US-align | Software Tool | Algorithms for rapid clustering of protein/nucleotide sequences and aligning 3D structures. | Critical for redundancy removal and creating sequence- or structure-based splits to prevent data leakage in benchmarks [31]. |
| ESM-2 / RNA-FM | Pre-trained Language Model | Generates evolutionary-scale, context-aware representations of protein or RNA sequences. | Used by cutting-edge tools like PaRPI and RhoFold+ to extract features from sequences, capturing evolutionary constraints without explicit MSA [3] [32]. |
Benchmarking studies consistently show that deep learning methods, particularly language model-based approaches like RhoFold+, are setting a new standard for accuracy in RNA 3D structure prediction, outperforming traditional ab initio and template-based methods on standardized tests like RNA-Puzzles [3]. However, significant challenges remain. The performance of all methods can be variable, and maintaining high accuracy across diverse RNA families and increasing sequence lengths is difficult [30] [1]. Furthermore, the field currently lacks the extensive, standardized benchmarking infrastructure that has been instrumental in the progress of protein structure prediction [31].
Future progress will depend on several key factors: the continued growth of high-quality experimental RNA structures for training and testing, the development of more robust and standardized benchmarks that include RNA-RNA and RNA-protein complexes, and the creation of generalized models that perform well across different RNA types and functional classes. As these computational tools become more accurate and accessible, they will profoundly impact our understanding of RNA biology and accelerate RNA-targeted drug development and synthetic biology design.
Navigating the Pitfalls: Generalization, Data, and Technical Limitations
Confronting the Generalization Crisis in Data-Hungry Models
The field of RNA structure prediction is undergoing a rapid transformation, driven by the adoption of deep learning (DL) methodologies. While these data-hungry models have demonstrated remarkable success in predicting protein structures, their application to RNA tertiary structure prediction presents unique challenges, primarily centered on a generalization crisis. This crisis manifests as a significant performance drop when models encounter RNA classes or families underrepresented in training datasets, such as orphan RNAs or synthetic constructs. The dynamic nature of RNA molecules, the scarcity of high-resolution experimental structures, and the complexity of RNA folding landscapes exacerbate this issue. Consequently, systematic benchmarking becomes indispensable not merely for ranking algorithmic performance but for diagnosing the specific failure modes of generalization and guiding the development of more robust, physically-informed models.
Independent benchmarking studies reveal that while ML-based methods generally outperform traditional fragment-assembly approaches on most targets, the performance advantage narrows considerably on "unseen" RNAs, with some methods struggling to recapitulate fundamental structural motifs like the characteristic inverted "L" shape of tRNA [6] [2]. This comparison guide provides an objective evaluation of contemporary RNA structure prediction tools, synthesizing quantitative performance data and experimental protocols to offer researchers in drug development and synthetic biology a clear framework for selecting and applying these critical computational resources.
Quantitative Performance Benchmarking of Prediction Methods
Performance Metrics and Comparative Analysis
Independent benchmarking studies utilize standardized metrics to evaluate prediction accuracy. The most common include Root Mean Square Deviation (RMSD), which measures the average distance between corresponding atoms in predicted and experimental structures; Template Modeling Score (TM-score), which assesses global structural similarity; and Local Distance Difference Test (lDDT), a superposition-free metric evaluating local consistency. Clash scores, which quantify steric overlaps, are also used to assess structural plausibility [2] [3] [33].
The table below summarizes the performance of leading RNA tertiary structure prediction methods based on systematic evaluations:
Table 1: Benchmarking Performance of RNA 3D Structure Prediction Methods
| Method | Approach/Category | Key Inputs | Reported Performance (Average) | Strengths | Key Limitations |
|---|---|---|---|---|---|
| DeepFoldRNA [34] [2] | Deep Learning (ML-based) | MSA, Secondary Structure | Best overall performance in benchmarking [34] [2] | High accuracy on targets with good MSA depth | Performance dependent on MSA quality |
| RhoFold+ [3] | Deep Learning (Language Model) | Sequence, MSA | Avg RMSD: 4.02 Å (RNA-Puzzles) [3] | High generalization, automated end-to-end pipeline | Requires MSA construction |
| DRFold [34] [2] | Deep Learning (ML-based) | Secondary Structure | Second best in some benchmarks [34] [2] | Does not require MSA, faster | Lower accuracy vs. top MSA-based methods |
| AlphaFold 3 [6] [3] | Deep Learning (General) | Sequence | Varies; e.g., ~5.7Å RMSD on MGA [6] | Direct from sequence, handles complexes | "Black box", lower confidence for some RNAs [6] |
| Rosetta FARFAR2 [6] [2] | Fragment Assembly (Non-ML) | Sequence, Secondary Structure | Performance highly input-dependent [6] | Strong physics-based sampling | Computationally intensive, sensitive to 2D input [6] |
| RNAComposer [6] [2] | Motif-Based (Non-ML) | Secondary Structure | Performance highly input-dependent [6] | Fast for known motifs | Highly sensitive to 2D input accuracy [6] [33] |
Performance nuances are critical for interpretation. For example, an RMSD below 4.0 Å is often considered a threshold for high-quality predictions for small RNAs, while larger RNAs may have higher thresholds [6]. The dependence on accurate secondary structure inputs is a significant bottleneck for many methods, including RNAComposer and FARFAR2, where different 2D predictions for the same tRNA led to RMSD variations exceeding 10 Å [6]. Furthermore, most leading methods show a marked inability to accurately predict non-canonical (non-Watson-Crick) base pairs, a key element of RNA tertiary architecture [34] [2].
The Generalization Gap: Performance on Orphan and Synthetic RNAs
The core of the generalization crisis is highlighted by performance disparities between RNA families well-represented in structural databases and those that are not. Benchmarking reveals that the superiority of ML methods over traditional fragment-assembly (FA) methods is not universal.
Table 2: The Generalization Gap: Performance on Different RNA Categories
| RNA Category | Data Context | Typical ML Method Performance | Typical Non-ML Method Performance | Notes and Challenges |
|---|---|---|---|---|
| Common Families (tRNA, rRNA) | Ample training data | High | Moderate | ML models excel with deep MSAs [2] |
| Orphan RNAs | Limited homology, few solved structures | Only slightly better than non-ML [2] | Moderate, but consistent | All methods show poor performance [2] |
| Synthetic/Designed RNAs | Unseen in natural training data | Limited generalization [34] | Moderate | Highlights data dependency of ML models [34] |
| RNAs with Pseudoknots | Structurally complex | Varies | Varies | Both ML and sampling methods can struggle [33] |
The performance of DL methods is heavily influenced by the depth and quality of Multiple Sequence Alignments (MSA), which provide evolutionary constraints. On orphan RNAs with poor MSA coverage, the information advantage of DL models diminishes, and their performance converges with—and sometimes is only marginally better than—that of physics-based or fragment-assembly methods [2]. This underscores that current DL models are often learning from evolutionary statistics rather than fundamental physics, limiting their extrapolation capability.
Experimental Protocols for Benchmarking Studies
Standardized Workflows for Method Evaluation
To ensure fair and reproducible comparisons, independent benchmarking studies follow rigorous experimental protocols. The typical workflow involves dataset curation, method execution, and quantitative analysis, providing a template for researchers to evaluate new tools.
Key Reagents and Computational Tools
The following "Scientist's Toolkit" details essential resources used in rigorous benchmarking studies, enabling replication and extension of these evaluations.
Table 3: Research Reagent Solutions for RNA Structure Benchmarking
| Category | Item/Software | Function in Benchmarking | Key Notes |
|---|---|---|---|
| Datasets | BGSU Representative Sets [3] | Provides non-redundant, high-quality RNA structures for training and testing. | Curated to minimize homology bias. |
| Datasets | RNA-Puzzles Targets [3] [33] | Community-wide blind tests for objective evaluation of prediction accuracy. | Serves as a standardized examination. |
| Metrics | RMSD, TM-score, lDDT [2] [3] | Quantifies global and local structural accuracy against experimental structures. | TM-score and lDDT are less sensitive to local deviations. |
| Metrics | Molprobity/Clash Score [33] | Assesses stereochemical quality and atomic clashes in predicted models. | Measures physical plausibility. |
| Analysis | RNA-Puzzles Toolkit [33] | Integrated suite for comprehensive analysis of RNA 3D models. | Includes interaction network fidelity checks. |
| Infrastructure | High-Performance Computing (HPC) | Essential for running resource-intensive DL and sampling methods at scale. | FARFAR2 and DL models are computationally demanding. |
Discussion: Pathways Toward Generalizable Models
The benchmarking data presented reveals a clear taxonomy of the generalization crisis. The performance of leading methods can be visualized as a function of data availability and architectural approach, highlighting the distinct challenges faced by different methodologies.
Interpretation of Benchmarking Results and Mitigation Strategies
The visualization above encapsulates the central finding: the performance of data-hungry DL models is tightly coupled to the availability of evolutionary data (MSAs) or structural templates, whereas non-ML methods maintain a consistent, albeit often lower, baseline performance across data contexts. This divergence creates the generalization crisis, where the best-performing tools in data-rich scenarios become unreliable for novel RNA targets. Several specific failure modes are evident from benchmarking:
Secondary Structure Dependency: Many 3D prediction methods, both ML and non-ML, are highly sensitive to the accuracy of input secondary structures. As one study notes, the 3D structure of human glycyl-tRNA predicted by RNAComposer was significantly distorted when using one predicted 2D structure versus another, resulting in large RMSD differences [6]. This creates a critical bottleneck, as secondary structure prediction itself remains an unsolved problem, especially for RNAs with complex motifs like pseudoknots.
Non-Canonical Interaction Failure: A consistent weakness across most methods is the inability to accurately predict non-Watson-Crick base pairs and complex tertiary interactions [34] [2]. These interactions are fundamental to RNA 3D architecture, and their misprediction limits the resolution and functional relevance of models.
Template Over-reliance: Some template-based methods struggle when no close structural homolog exists, forcing them to rely on incorrect or incomplete fragments that lead to inaccurate global folds [3].
To mitigate these issues, the field is moving toward hybrid approaches and architectural innovations. Integrating stronger physics-based constraints and geometric deep learning principles during model training could reduce dependency on purely data-driven patterns. Furthermore, employing language models pre-trained on millions of RNA sequences (even without structural data) can provide a richer prior understanding of RNA sequence syntax, potentially improving generalization to orphans, as demonstrated by RhoFold+ [3]. Finally, the development of standardized, diverse benchmarks that specifically test generalization across RNA families is crucial for driving progress.
Systematic benchmarking is not an academic exercise but a necessity for confronting the generalization crisis in RNA structure prediction. The data reveals a clear landscape: while deep learning methods like DeepFoldRNA and RhoFold+ have set new standards for accuracy on targets with good evolutionary coverage, their performance advantage erodes significantly on orphan and synthetic RNAs. This indicates that current models are often excelling at interpolation within their training data manifold rather than learning the underlying physics of RNA folding.
For researchers and drug development professionals, this implies a need for strategic tool selection. For well-studied RNA families, the latest DL methods are unequivocally superior. However, for exploratory work on novel RNAs, leveraging a combination of top DL methods alongside robust, physics-based methods like FARFAR2 provides a more reliable strategy. The future of the field lies in developing models that are not merely data-hungry but data-wise, integrating physical principles, learned evolutionary priors, and scalable architectures to finally overcome the generalization crisis and deliver accurate predictions for any RNA sequence.
{The Impact of Incomplete RNA Structural Fragment Libraries}
Ribonucleic acids (RNAs) are versatile macromolecules crucial to countless biological processes, from gene regulation to cellular differentiation [7] [23]. Their functions are dictated by complex three-dimensional structures that emerge from their primary sequences. Accurately predicting these structures is a cornerstone of computational biology, with profound implications for drug discovery and synthetic biology [3] [14]. The development of prediction algorithms relies heavily on benchmark libraries—curated sets of RNA structural fragments used to train and evaluate computational models.
This guide examines a critical bottleneck in the field: the impact of incomplete RNA structural fragment libraries. The scarcity of high-resolution experimental structures and biases in existing datasets directly limit the accuracy and generalizability of state-of-the-art prediction tools. We objectively compare how current algorithms perform under these constraints and detail the experimental protocols used to benchmark them.
## The Data Scarcity Crisis: A Fundamental Limitation
The root of the incompleteness problem lies in the limited availability of high-quality RNA 3D structures. As of late 2023, RNA-only structures constitute less than 1.0% of the Protein Data Bank (PDB), with RNA-containing complexes accounting for only 2.1% [3]. This scarcity is attributed to the conformational flexibility of RNA and the technical challenges of high-throughput experimental determination via X-ray crystallography, NMR, or cryo-EM [3] [23].
This data scarcity has a direct, measurable impact on the training of deep learning models. Unlike proteins, for which structural data is abundant, RNA models must learn from a significantly smaller pool of examples, which can hamper their performance and generalizability [14]. Furthermore, the structures that are available often exhibit a bimodal distribution in length; many systems have fewer than 300 residues, while a few (mostly rRNAs) have several thousand, leaving a gap in mid-size structures [31]. This imbalance can bias models toward certain structural classes.
## Comparative Performance on Standardized Benchmarks
The introduction of standardized benchmarks, such as the one provided by rnaglib, has enabled a more rigorous comparison of how algorithms cope with limited and biased data [31]. This benchmark comprises seven tasks designed to evaluate RNA structure-function modeling, providing tools for dataset splitting and evaluation to ensure reproducible and comparable results.
The table below summarizes the performance of selected RNA modeling approaches, highlighting their strategies to mitigate data limitations.
| Algorithm | Approach | Key Features to Address Data Scarcity | Reported Performance (RNA-Puzzles) |
|---|---|---|---|
| RhoFold+ [3] | Language Model / Deep Learning | Integrates an RNA language model (RNA-FM) pre-trained on ~23.7 million sequences; uses multi-sequence alignments (MSAs). | Average RMSD: 4.02 Å |
| FARFAR2 [3] | Energy-Based Sampling | A de novo physics-based method; does not require extensive training data. | Average RMSD: 6.32 Å |
| ERNIE-RNA [7] | Language Model / Deep Learning | Incorporates base-pairing priors into attention mechanisms; pre-trained on 20.4 million sequences. | State-of-the-art (SOTA) on various downstream tasks. |
| ARES [31] | Deep Learning (Atomic Graph) | Models RNA as an atomic graph using a tensor field network; less reliant on large fragment libraries. | Baseline results reported on rnaglib benchmark tasks. |
dot Code: Algorithm Performance Comparison
This diagram illustrates the logical relationship where the challenge of incomplete structural libraries directly influences the design strategy of prediction algorithms, which in turn determines their benchmark performance.
A key finding from benchmarking is the "generalization crisis," where models trained on one set of RNA families show significantly lower performance when confronted with sequences from unseen families [23]. This underscores that incompleteness is not just about the quantity of data, but also its diversity and representativeness.
## Experimental Protocols for Benchmarking
To ensure fair and reproducible comparisons, benchmarking studies follow rigorous experimental protocols. The following workflow, synthesized from the cited literature, outlines the standard procedure for evaluating an RNA structure prediction algorithm.
dot Code: Benchmarking Workflow
The standard benchmarking workflow involves stringent data curation and splitting to accurately assess an algorithm's ability to generalize beyond its training data.
### Key Experimental Stages
- Data Curation and Quality Filtering: Initial RNA-containing structures are fetched from the RCSB-PDB [31]. They are then subjected to quality filters, typically excluding structures with a resolution worse than 4.0 Å and chains with fewer than 15 or more than 500 residues to manage computational expense [31]. A critical but often overlooked filter removes RNA structures that are heavily stabilized by protein interactions, ensuring the model learns RNA-intrinsic folding principles [31].
- Redundancy Reduction and Dataset Splitting: To prevent data leaks and over-optimistic performance, datasets are carefully split. A common method is to cluster RNA chains by sequence or structural similarity (using tools like CD-HIT or US-align) at a specific identity threshold (e.g., 80%) [31] [3]. The entire cluster is then assigned to either the training or test set, ensuring that highly similar sequences do not appear in both. This clustered splitting strategy is essential for a rigorous assessment of model generalizability [31] [23].
- Structure Evaluation Metrics: The accuracy of predicted 3D structures is quantified using several standard metrics:
- Root Mean Square Deviation (RMSD): Measures the average distance between corresponding atoms in predicted and experimental structures after optimal superposition. Lower values indicate better accuracy.
- Template Modeling (TM-score): A superposition-free metric that is more sensitive to global topology than local errors. Scores range from 0-1, with higher scores indicating better structural similarity [3].
- Local Distance Difference Test (lDDT): A superposition-free metric that evaluates local distance differences for all atoms in a model, providing a robust measure of local accuracy [3].
The following table details key computational tools and data resources that are foundational for research in RNA structure prediction and benchmarking.
| Resource Name | Type | Primary Function |
|---|---|---|
| RCSB Protein Data Bank (PDB) [31] [3] | Database | The primary repository for experimentally determined 3D structures of proteins and nucleic acids, serving as the fundamental source of structural data. |
| BGSU Representative Set [3] | Curated Dataset | A widely used, non-redundant subset of RNA structures from the PDB, often used as a starting point for building training datasets. |
| RNAcentral [7] [23] | Database | A comprehensive database of non-coding RNA sequences that provides a vast resource for pre-training language models. |
| rnaglib [31] | Software/Benchmark | A Python library and benchmarking suite for RNA structure-function modeling, providing standardized datasets and evaluation tools. |
| CD-HIT/EST [3] [7] | Software Tool | Used for rapid clustering of nucleotide sequences to remove redundancy and create non-redundant datasets for training and testing. |
| US-align [31] | Software Tool | An algorithm for measuring 3D structural similarity between RNA molecules, used for clustering and evaluation. |
The incompleteness of RNA structural fragment libraries remains a significant impediment to the development of robust, generalizable prediction algorithms. Benchmarking studies consistently reveal that even the most advanced deep learning methods, while showing impressive results, are constrained by the quantity and diversity of available experimental data [31] [3].
The performance gap between methods like RhoFold+ and earlier tools underscores a strategic shift: to overcome data scarcity, the field is increasingly leveraging large-scale sequence data through language models [3] [7] and implementing stricter, homology-aware benchmarking protocols [31] [23]. Future progress hinges not only on algorithmic innovations but also on the continued expansion and careful curation of the foundational structural libraries themselves. For researchers and drug developers, selecting a prediction tool requires careful consideration of these benchmarks and an understanding of how the underlying algorithm mitigates the inherent limitations of today's structural data.
Strategies for Low-Homology and 'Orphan' RNA Prediction
The prediction of RNA structure is fundamental to understanding its diverse biological functions and for designing RNA-targeted therapeutics. However, a significant challenge arises with "orphan" RNAs—those with no or very few sequence homologs in existing databases. The accuracy of most computational prediction methods relies heavily on evolutionary information derived from multiple sequence alignments (MSAs). For orphan RNAs, generating deep MSAs is impossible, creating a "homology bottleneck" that severely limits prediction accuracy [23]. This challenge is exacerbated by the inherent scarcity of experimentally determined RNA structures; RNA-only structures constitute less than 1% of the Protein Data Bank, and structures from the vast majority of RNA families remain unsolved [3] [2]. This article provides a comparative guide to the performance of various computational strategies when tasked with predicting the structures of these elusive low-homology and orphan RNAs, benchmarking their capabilities within the rigorous framework of algorithmic research.
Benchmarking Performance of Prediction Methods on Orphan RNAs
Systematic benchmarking reveals that while deep learning methods have revolutionized RNA structure prediction, their performance advantage diminishes significantly on orphan RNAs compared to their performance on targets with abundant homologs.
Comparative Performance of Method Types
Independent evaluations provide critical insights into how different computational paradigms handle the orphan RNA challenge. The following table summarizes the core characteristics and performance of major method types on low-homology targets:
Table 1: Method Comparison for Orphan and Low-Homology RNA Prediction
| Method Category | Key Input Features | Representative Tools | Performance on Orphan RNAs | Key Limitations |
|---|---|---|---|---|
| Deep Learning (ML-based) | MSA, Predicted Secondary Structure, Language Model Embeddings | DeepFoldRNA, RhoFold+, RoseTTAFold2NA, DRFold | Moderately better than non-ML methods; performance highly dependent on MSA depth and secondary structure prediction quality [2]. | Struggle with novel/synthetic RNAs; poor prediction of non-Watson-Crick pairs [2]. |
| Fragment-Assembly (Non-ML) | Physics-based principles, Fragment Libraries | FARFAR2, 3dRNA | Performance closer to ML methods on orphans, though generally less accurate on targets with homologs [2]. | Computationally intensive; limited by the completeness of fragment libraries [3] [2]. |
| Physics-Based (Binding Site) | 3D Distance, Surface Exposure, Network Metrics | Rsite, RBind, RNetsite | Effective for identifying functional sites from structure but requires an existing 3D model as input [35]. | Cannot predict structure de novo; limited to binding site identification [35]. |
| Integrated AI Strategies | LLM Embeddings, Geometry, Network Features | MultiModRLBP, RNABind, RLsite | Leverage language models trained on millions of sequences to mitigate homology scarcity; a promising direction [35]. | Emerging technology; requires further validation on diverse orphan RNAs [35] [23]. |
Quantitative benchmarks from a systematic 2024 study illustrate this performance gap clearly. On a diverse set of RNA targets, ML-based methods like DeepFoldRNA achieved the best overall prediction accuracy, followed by DRFold [2] [34]. However, when the benchmark was restricted to orphan RNAs, the performance difference between ML-based and traditional fragment-assembly-based methods was not substantial, with all methods exhibiting generally poor performance [2]. This indicates that the evolutionary information captured by MSAs is a primary driver of the superior performance of modern DL tools, and without it, their advantage is minimized.
Key Factors Influencing Prediction Accuracy
Benchmarking studies have identified several critical factors that account for the variation in prediction accuracy on low-homology RNAs:
- MSA Depth: The quality and depth of the Multiple Sequence Alignment are the most significant factors affecting the performance of MSA-dependent DL methods like DeepFoldRNA and RoseTTAFold2NA. Shallow MSAs lead to a steep decline in accuracy [2].
- Secondary Structure Prediction: The accuracy of the predicted secondary structure used as an input constraint is a major contributor to the final 3D model's quality. Incorrect secondary structure predictions propagate into erroneous tertiary models [2].
- RNA Type and Length: Performance is not uniform across all RNA types and lengths. Some methods may perform better on certain structural families or within specific length ranges [2].
Experimental Protocols for Benchmarking Studies
To ensure fair and objective comparisons, rigorous benchmarking studies follow standardized protocols. The following workflow visualizes the key stages of a robust benchmarking pipeline for RNA structure prediction methods.
Figure 1: Workflow for systematic benchmarking of RNA structure prediction methods. The process involves curated dataset creation, standardized method execution, and multi-faceted accuracy assessment.
Dataset Curation and Preparation
The foundation of a reliable benchmark is a non-redundant, high-quality dataset. The standard protocol involves:
- Source Data Collection: Experimentally determined RNA structures are sourced from the Protein Data Bank (PDB). Representative sets, such as the BGSU representative RNA database, are often used as a starting point to minimize structural redundancy [3].
- Filtering and Clustering: The dataset is filtered for single-chain RNAs to simplify the prediction problem. Sequences are then clustered at an 80% sequence identity threshold using tools like CD-HIT to ensure diversity [3].
- Defining Orphan RNAs: Orphan or low-homology RNAs are identified based on the inability to generate a deep Multiple Sequence Alignment. This is typically done by running homology searches (e.g., with BLAST) against large sequence databases and selecting targets with few or no homologs [2] [23].
Method Execution and Accuracy Assessment
To ensure a fair comparison, benchmarks must be run under consistent conditions.
- Standardized Execution: Prediction methods are run locally on the same computational infrastructure. The evaluation uses a fully automated pipeline without human intervention or expert knowledge to avoid bias [2].
- Accuracy Metrics: Model quality is assessed using multiple, superposition-free metrics that provide complementary information [3] [2]:
- lDDT (local Distance Difference Test): Evaluates local distance differences of all atoms, providing a reliable score without the need for global superposition.
- TM-score (Template Modeling Score): Measures the global topological similarity between the predicted and native structures. A score above 0.5 indicates generally correct topology.
- RMSD (Root Mean Square Deviation): Measures the average distance between equivalent atoms after superposition. While common, it can be sensitive to local errors in long, flexible regions.
Emerging Strategies and the Scientist's Toolkit
To address the orphan RNA challenge, researchers are developing new strategies that move beyond traditional MSA-dependent approaches.
Integrated Multimodal and Language Model Approaches
The most promising strategies involve integrating diverse data types and leveraging large language models.
- Multimodal Feature Integration: Methods like MultiModRLBP combine features from multiple modalities, including sequence-based large language model (LLM) embeddings, geometric features from 3D structures, and network metrics. This creates a richer feature set that is less reliant on deep homology [35].
- RNA Language Models: Tools like RhoFold+ and RNABind utilize language models (e.g., RNA-FM) that are pre-trained on millions of RNA sequences (e.g., ~23.7 million sequences for RNA-FM) [3]. These models learn evolutionary and structural constraints directly from the sequence universe, creating informative embeddings even for sequences without close homologs. This approach effectively bypasses the "homology bottleneck" [35] [3] [23].
The following diagram illustrates how these next-generation methods integrate different data sources to improve predictions for low-homology RNAs.
Figure 2: Multimodal integration strategy for orphan RNA prediction. This approach combines limited MSA data with features from a pre-trained language model and predicted secondary structure to enhance prediction accuracy.
Research Reagent Solutions for RNA Structure Prediction
A successful research program in this field relies on a suite of computational tools and resources. The following table details key components of the research toolkit.
Table 2: Essential Research Reagent Solutions for RNA Structure Prediction
| Reagent / Resource | Type | Primary Function | Relevance to Orphan RNAs |
|---|---|---|---|
| BGSU Representative Sets [3] | Dataset | Provides a curated, non-redundant set of RNA structures from the PDB. | Essential for creating balanced training and benchmarking datasets to evaluate method performance. |
| RNA-FM / ESM-2 [3] | Language Model | A large language model pre-trained on millions of diverse RNA sequences. | Provides evolution-informed sequence embeddings even without MSAs, crucial for orphan RNA prediction. |
| CD-HIT [3] | Software Tool | Clusters protein or nucleotide sequences to reduce redundancy. | Used in dataset preparation to remove sequence bias and ensure diversity in benchmark sets. |
| TrRosettaRNA / DeepFoldRNA [2] | Prediction Method | DL methods that predict 3D structures from MSAs and other features. | State-of-the-art performers on targets with homologs; baselines for comparison on orphans. |
| FARFAR2 [3] [2] | Prediction Method | A fragment-assembly-based, physics-driven method for de novo RNA 3D structure modeling. | A strong non-ML baseline that often shows more robust performance on orphan RNAs compared to MSA-dependent DL methods. |
| Rsite2 / RBind [35] | Prediction Method | Tools for identifying small molecule binding sites on RNA structures. | Useful for functional annotation once a structural model is obtained, bridging structure to function. |
The accurate prediction of low-homology and orphan RNA structures remains a formidable challenge in computational biology. Systematic benchmarking reveals that while deep learning methods lead in overall accuracy, their performance advantage narrows significantly on orphans, with all methods exhibiting room for improvement. The primary determinant of success for most current methods is the availability of evolutionary information through MSAs. The most promising strategies to overcome this limitation involve the integration of multimodal data and the application of RNA language models, which learn fundamental principles of RNA structural from vast sequence corpora. As these technologies mature and the structural coverage of RNA space expands, researchers and drug developers will be better equipped to decipher the structure and function of the vast uncharted territory of the RNA genome.
Addressing Computational Complexity for Long Transcripts
Predicting the three-dimensional (3D) structure of RNA from its sequence represents one of the most significant challenges in computational structural biology. This challenge becomes particularly pronounced for long transcripts, where computational complexity increases substantially due to the need to model intricate tertiary interactions, complex topological arrangements, and dynamic folding pathways. The computational burden arises from RNA's greater structural diversity compared to proteins—with approximately 11 backbone torsional degrees of freedom for RNA building blocks versus only 2 for proteins—combined with complex packing arrangements of various structural elements [36]. Understanding these structures is crucial for deciphering RNA functions in fundamental biological processes and for informing RNA-targeting drug development, especially as research reveals that most of the human genome is transcribed into non-coding RNAs with regulatory roles [36] [3].
The field of RNA structure prediction has evolved through multiple methodological approaches, from early physics-based and fragment-assembly methods to contemporary deep learning frameworks. Each approach presents distinct trade-offs between accuracy, computational demand, and scalability to longer RNA molecules. This guide provides a systematic comparison of these computational methods, focusing specifically on their performance and limitations when applied to long transcripts, with supporting experimental data from rigorous benchmarking studies conducted within the scientific community.
Computational Methodologies for RNA Structure Prediction
RNA structure prediction algorithms can be broadly categorized into three methodological paradigms: fragment assembly-based approaches, deep learning methods, and language model-enhanced deep learning frameworks. Each employs distinct strategies to navigate the complex conformational space of RNA folding.
Table 1: Core Methodologies in RNA Structure Prediction
| Method Category | Representative Tools | Core Approach | Key Inputs |
|---|---|---|---|
| Fragment Assembly | FARFAR2, RNAComposer, 3dRNA | Assemblies 3D structures from fragment libraries | Primary sequence, Secondary structure (often) |
| Deep Learning (MSA-dependent) | RoseTTAFold2NA, DeepFoldRNA, trRosettaRNA | Learns structure from evolutionary patterns | Primary sequence, Multiple Sequence Alignments (MSA) |
| Language Model-Enhanced | RhoFold+, ERNIE-RNA | Leverages pre-trained language models on large sequence corpora | Primary sequence (optionally MSA/Secondary structure) |
Fragment Assembly Approaches
Fragment assembly methods, such as Rosetta's FARFAR2 (Fragment Assembly of RNA with Full-Atom Refinement 2), operate by assembling three-dimensional RNA structures from libraries of short structural fragments derived from experimentally solved RNA structures [6]. These methods typically employ sophisticated sampling algorithms to explore possible conformations, often guided by energy functions that favor RNA-like geometries. A significant limitation of these approaches is their substantial computational requirements, which scale poorly with increasing RNA length. For instance, FARFAR2 is generally applicable only to small RNAs (typically under 50 nucleotides) due to exponential growth in conformational space with increasing chain length [36] [6].
RNAComposer represents another fragment-based approach that utilizes a "Lego-like" assembly of structural motifs from a database, requiring secondary structure as input [6]. While this method can handle larger structures than FARFAR2, its accuracy remains heavily dependent on the quality of the input secondary structure and the availability of appropriate structural motifs in its database. Performance evaluations indicate that RNAComposer successfully recapitulated the crystal structure of the Malachite Green Aptamer (38 nucleotides) with a low all-atom root mean square deviation (RMSD) of 2.558 Å, but showed notable divergence (RMSD of 16.077 Å) for human glycyl-tRNA-CCC when using RNAfold-predicted secondary structure [6].
Deep Learning Frameworks
Deep learning methods have revolutionized structural bioinformatics by leveraging patterns learned from existing structural data to predict novel structures. These approaches can be further subdivided based on their dependency on evolutionary information derived from Multiple Sequence Alignments (MSAs).
MSA-dependent methods like RoseTTAFold2NA and DeepFoldRNA build models by learning co-evolutionary patterns from aligned homologous sequences, mirroring strategies that proved successful in protein structure prediction [2]. These methods typically employ sophisticated neural network architectures, such as transformer networks, to convert MSAs and predicted secondary structures into spatial constraints (distances, orientations, torsion angles), which are then used to build all-atom 3D models [3]. The main computational bottleneck for these approaches lies in generating deep MSAs, which requires extensive searches across large sequence databases—a process that becomes increasingly time-consuming for longer transcripts [3].
MSA-independent methods, including DRFold, bypass the need for MSAs by relying solely on predicted secondary structures and other sequence-derived features to inform 3D structure predictions [3]. This approach offers significant speed advantages by eliminating the computationally expensive MSA construction step, but generally achieves lower accuracy compared to MSA-based methods, particularly for RNAs with complex long-range interactions [3].
Language Model-Enhanced Prediction
The most recent innovation in RNA structure prediction incorporates language models pre-trained on massive corpora of RNA sequences. RhoFold+ exemplifies this approach by integrating RNA-FM, a large RNA language model pre-trained on approximately 23.7 million RNA sequences, to extract evolutionarily and structurally informed embeddings [3]. These embeddings enrich the sequence representation with implicit evolutionary and structural information, potentially reducing the method's dependency on explicit MSAs while maintaining high predictive accuracy.
Similarly, ERNIE-RNA employs a modified BERT architecture that incorporates base-pairing-informed attention bias during pre-training, enabling the model to learn RNA structural patterns through self-supervised learning rather than relying on potentially biased structural predictions [7]. This innovative approach allows the model to discover flexible and generalizable structural representations directly from sequence data, with its attention maps demonstrating remarkable capability to discern RNA structural features even in zero-shot settings [7].
Figure 1: Methodological workflows for RNA structure prediction approaches showing different input processing strategies.
Performance Benchmarking Across RNA Types and Lengths
Independent benchmarking studies provide critical insights into the relative performance of various RNA structure prediction methods, particularly highlighting their strengths and limitations when applied to transcripts of different lengths and structural complexities.
A comprehensive systematic benchmarking study evaluated five deep-learning and two fragment-assembly-based methods across diverse datasets, revealing that machine learning-based methods generally outperform traditional fragment-assembly methods on most RNA targets [2]. Among automated 3D RNA structure prediction methods, DeepFoldRNA achieved the best prediction results followed by DRFold as the second-best method [2]. However, the performance advantage of ML-based methods diminishes when working with unseen novel or synthetic RNAs (orphan RNAs), where all methods exhibit poor performance [2].
Table 2: Overall Performance Ranking of RNA Structure Prediction Methods
| Method | Type | Overall Performance | Key Strengths | Key Limitations |
|---|---|---|---|---|
| DeepFoldRNA | Deep Learning (MSA-dependent) | Best overall | High accuracy across diverse families | Performance depends on MSA quality |
| DRFold | Deep Learning (MSA-independent) | Second best | Fast (no MSA required) | Lower accuracy on complex RNAs |
| RhoFold+ | Language Model-Enhanced | Competitive | Integrates language model embeddings | Relatively new approach |
| RoseTTAFold2NA | Deep Learning (MSA-dependent) | Variable | Advanced network architecture | MSA construction bottleneck |
| RNAComposer | Fragment Assembly | Moderate | Handles larger structures | Dependent on input secondary structure |
| FARFAR2 | Fragment Assembly | Limited to small RNAs | High accuracy for small RNAs | Computationally intensive |
Performance variation across methods is significantly influenced by factors including RNA family diversity, sequence length, RNA type, MSA quality, and the accuracy of input secondary structure predictions [2]. Notably, the quality of the MSA and secondary structure prediction both play important roles in determining final model accuracy, and most methods struggle to predict non-Watson-Crick pairs in RNAs [2].
Performance on Specific RNA Structures
Experimental comparisons on specific RNA structures with known experimental determinations provide tangible performance metrics. For the Malachite Green Aptamer (MGA, 38 nucleotides), RNAComposer successfully recapitulated the crystal structure with an all-atom RMSD of 2.558 Å, outperforming both FARFAR2 (RMSD 6.895 Å) and AlphaFold 3 (RMSD 5.745 Å) [6]. This demonstrates that fragment-based methods can achieve high accuracy for small, well-defined RNA structures.
For more complex structures like human glycyl-tRNA-CCC, the performance of both RNAComposer and Rosetta FARFAR2 showed significant dependence on the accuracy of input secondary structure [6]. When using RNAfold-predicted secondary structure, RNAComposer produced a model with RMSD of 16.077 Å, exceeding the RMSD100 threshold of 9.1 Å for larger RNA structures [6]. Notably, Rosetta FARFAR2 failed to recapitulate the typical inverted "L" shape of tRNA structure regardless of the secondary structure input, highlighting limitations in modeling complex topological arrangements [6].
In rigorous assessments against community-wide blind tests (RNA-Puzzles), RhoFold+ demonstrated superior performance over existing methods, including human expert groups, achieving an average RMSD of 4.02 Å—2.30 Å better than the second-best model (FARFAR2 top 1%: 6.32 Å) [3]. Importantly, RhoFold+ exhibited no significant correlation between model performance and sequence similarity to training data, suggesting strong generalization capability for predicting accurate RNA structures across diverse families [3].
Impact of RNA Length on Prediction Accuracy
The length of RNA transcripts directly impacts the computational complexity and achievable accuracy of structure prediction methods. For fragment assembly approaches like FARFAR2, practical application is generally limited to RNAs under 50 nucleotides due to exponential growth of conformational space [36]. Early benchmarking revealed that prediction accuracy deteriorates significantly with increasing length, with most programs producing large RMSD values (20Å on average) for RNA sequences of medium to large sizes (50-130 nucleotides) [36].
Deep learning methods have demonstrated improved capability for longer transcripts, though performance remains length-dependent. In the RNA-Puzzles assessment, RhoFold+ achieved RMSD values below 5 Å for 17 of 24 single-chain RNA targets, including structures of substantial length such as PZ7, a 186-nucleotide-long Varkud satellite ribozyme RNA [3]. This represents a significant advancement in handling biologically relevant RNA lengths that were previously intractable for computational prediction.
Language model-based approaches like ERNIE-RNA show particular promise for longer transcripts due to their ability to capture long-range interactions through self-attention mechanisms. During pre-training, ERNIE-RNA processed sequences up to 1022 nucleotides in length, suggesting capability for handling substantial transcripts [7]. The model's attention maps naturally develop comprehensive representations of RNA architecture, enabling effective capture of structural features across extended sequences [7].
Experimental Protocols for Benchmarking Studies
Rigorous benchmarking of RNA structure prediction methods requires standardized protocols to ensure fair comparison and reproducible results. The following section outlines established methodological frameworks employed in comprehensive evaluation studies.
Dataset Curation and Preparation
Benchmarking studies typically employ diverse RNA datasets with high-quality reference structures. These often include structures from specific RNA families carefully studied by experts, such as 5S ribosomal RNA, group I introns, large subunit rRNA, RNase P RNA, and tRNA [37]. For example, one benchmarking collection (Archive II) incorporates structures from the 5S rRNA database, the Comparative RNA Web Site, and specialized databases for RNase P, SRP RNA, tmRNA, and tRNA [37].
To minimize bias, datasets are often processed to reduce redundancy by clustering sequences at specific similarity thresholds (e.g., 80% sequence identity) [3]. Additionally, temporal partitioning may be implemented where methods are trained on structures determined before a specific date and tested on more recently solved structures to assess generalization to novel folds [3].
For assessing performance on orphan RNAs (those with no close structural homologs), specialized datasets may be curated that exclude sequences with significant similarity to any known RNA family in databases such as Rfam [2]. This enables evaluation of method performance on truly novel folds rather than variations of known structures.
Accuracy Metrics and Statistical Analysis
Multiple metrics are employed to quantitatively assess prediction accuracy, each providing complementary information about different aspects of structural similarity:
Root Mean Square Deviation (RMSD): Measures the average distance between corresponding atoms in predicted and reference structures after optimal superposition. Lower values indicate better agreement. For RNA structures, length-dependent thresholds (RMSD100) are often used for normalization [6].
Template Modeling (TM) Score: A superposition-free metric that assesses global structural similarity, with values ranging from 0-1 where higher scores indicate better agreement [3].
Local Distance Difference Test (LDDT): Evaluates local distance differences for all atoms in a model without requiring global superposition [3].
Sensitivity and Positive Predictive Value (PPV): For secondary structure assessment, sensitivity (recall) measures the fraction of true base pairs correctly predicted, while PPV (precision) measures the fraction of predicted pairs that are correct [37].
F1 Score: The harmonic mean of sensitivity and PPV, providing a single metric to summarize base-pair prediction accuracy [37].
Statistical significance testing is essential when comparing method performance, typically employing paired tests such as Wilcoxon signed-rank tests to determine if observed differences are statistically significant rather than resulting from random variation [37].
Figure 2: Standardized workflow for benchmarking RNA structure prediction methods
Table 3: Essential Research Resources for RNA Structure Prediction Benchmarking
| Resource Category | Specific Tools/Databases | Primary Function | Application Context |
|---|---|---|---|
| Structure Datasets | RNA Strand, BGSU representative sets, RNA-Puzzles targets | Provide reference structures for training and benchmarking | Method development and validation |
| Secondary Structure Data | Comparative RNA Web Site, 5S rRNA database, RNase P Database | Source of conserved structures determined by comparative analysis | Input for fragment-based methods |
| Sequence Databases | RNAcentral, Rfam | Source of homologous sequences for MSA construction | Evolutionary analysis and deep learning |
| Evaluation Metrics | RMSD, TM-score, LDDT, F1 score | Quantify prediction accuracy against reference structures | Performance benchmarking |
| Visualization Tools | PyMOL, ChimeraX | 3D structure visualization and analysis | Model inspection and quality assessment |
| Computational Frameworks | Rosetta, VFold, OpenMM | Provide sampling algorithms and energy functions | Physics-based modeling and simulation |
The computational prediction of RNA structures, particularly for long transcripts, remains a challenging frontier in structural bioinformatics. Current benchmarking reveals that deep learning methods generally outperform traditional fragment-assembly approaches, with DeepFoldRNA achieving the best overall performance in recent evaluations [2]. However, significant limitations persist, including performance degradation on orphan RNAs, dependency on MSA quality and accurate secondary structure prediction, and difficulties modeling non-canonical base pairs [2].
Language model-enhanced approaches like RhoFold+ and ERNIE-RNA represent promising directions that may address some current limitations, particularly through their ability to capture structural patterns from sequence data without heavy reliance on MSAs [3] [7]. These methods have demonstrated superior performance in community-wide blind tests and show better generalization across diverse RNA families [3].
For researchers working with long transcripts, method selection involves important trade-offs. MSA-dependent deep learning methods typically offer highest accuracy but require substantial computational resources for MSA construction. Language model-based approaches provide a balanced alternative with competitive accuracy and reduced computational overhead. Fragment assembly methods remain valuable for small RNAs or when expert knowledge can guide secondary structure constraints.
Future progress will likely depend on several key factors: expansion of experimentally determined RNA structures for training, development of better representations for RNA conformational space, improved modeling of non-canonical interactions, and more efficient algorithms for handling long-range interactions in extended transcripts. As these computational methods continue to mature, they will increasingly enable researchers to address fundamental questions in RNA biology and accelerate the development of RNA-targeted therapeutics.
Rigorous Benchmarking: Performance, Datasets, and Best Practices
The accurate prediction of RNA structure is a cornerstone of modern biology, with profound implications for understanding gene regulation, cellular differentiation, and the development of novel therapeutics and synthetic biology tools [14] [38]. However, the field of computational RNA biology faces a significant challenge: the lack of standardized, high-quality benchmark datasets. This absence hinders the fair comparison of algorithms, obscures true performance progress, and ultimately slows development [14]. While machine learning (ML) methodologies have demonstrated potential to surpass traditional thermodynamic-based prediction methods, their success is critically dependent on access to large, curated, and experimentally validated training data [14] [2]. The establishment of community-wide gold standards is therefore not merely an academic exercise but a prerequisite for advancing the field. This guide examines the current landscape of curated RNA structure prediction datasets, provides a systematic comparison of their composition and applications, and details the experimental protocols for their use in benchmarking, offering researchers a framework for fair and rigorous algorithm evaluation.
A Landscape of RNA Structure Prediction Datasets
The development of RNA structure prediction algorithms relies on datasets that span different levels of structural complexity, from secondary to tertiary structures. The table below summarizes the key curated datasets available for benchmarking.
Table 1: Curated Datasets for RNA Structure Prediction Benchmarking
| Dataset Name | Structural Focus | Size & Content | Key Features & Challenges | Primary Use Case |
|---|---|---|---|---|
| Comprehensive Dataset for RNA Design [14] [38] | Secondary Structure (Inverse Folding) | >320,000 instances; 5 to 3,538 nt; from RNAsolo & Rfam | Focus on multi-branched loops; includes challenging n-way junctions (up to 10-way) | Benchmarking RNA inverse folding and secondary structure prediction algorithms |
| EteRNA100 [14] [38] | Secondary Structure (Inverse Folding) | 100 distinct secondary structures; 12 to 400 nt (avg: 127 nt) | Manually assembled by experts; variety of structure elements; lack of standardized evaluation protocols | Community-wide challenges and algorithm testing |
| RnaBench [14] | Secondary Structure & RNA Design | Not specified; structures <500 nt | Includes homology-aware datasets, standardized protocols, and novel performance measures | Development of deep learning algorithms for RNA structure prediction and design |
| RhoFold+ Training Set [39] | Tertiary Structure (3D) | 782 unique RNA chains (clustered at 80% sequence identity from 5,583 PDB chains) | Curated from BGSU representative sets; focuses on single-chain RNAs | Training and evaluation of 3D RNA structure prediction models |
| RNAscope Benchmark [28] | Structure, Interaction, Function | 1,253 experiments across diverse subtasks | Comprehensive evaluation of RNA language models beyond just structure prediction | Systematic assessment of RNA pre-trained language models (pLMs) |
A critical challenge in tertiary structure prediction is the scarcity of experimentally determined RNA 3D structures. As of late 2023, RNA-only structures constitute less than 1% of the Protein Data Bank (PDB), creating a significant data bottleneck for training ML models [39]. This scarcity is a primary reason why many methods, including RhoFold+, rely on carefully curated and non-redundant subsets of the available structural data [39]. In contrast, secondary structures are supported by much larger databases like Rfam, enabling the creation of massive benchmarks like the 320,000-instance dataset focused on complex loop motifs [14] [38].
Experimental Protocols for Benchmarking RNA Structure Prediction Algorithms
A rigorous benchmarking experiment requires a standardized workflow to ensure fairness and reproducibility. The following protocol, synthesized from recent large-scale assessments, provides a template for evaluating RNA structure prediction tools.
Table 2: Key Performance Metrics for RNA Structure Evaluation
| Metric | Structural Level | Definition and Interpretation | Considerations |
|---|---|---|---|
| F1 Score / MCC | Secondary Structure | Measures base-pair prediction accuracy against a reference. | Struggles with complex tertiary interactions like pseudoknots [40]. |
| Weisfeiler-Lehman Graph Kernel (WL) | Secondary Structure | A graph-based metric that compares the topology of predicted and reference structures as graphs. | More capable of capturing complex interaction patterns than F1 [40]. |
| Root Mean Square Deviation (RMSD) | Tertiary Structure (3D) | Measures the average distance between corresponding atoms in predicted and reference structures after superposition. | Sensitive to global fold; can be high for locally correct structures [39] [2]. |
| Template Modeling (TM) Score | Tertiary Structure (3D) | A superposition-free score that assesses global fold similarity, scaled between 0 and 1. | More sensitive to global topology than RMSD; >0.5 indicates generally correct fold [39]. |
| Local Distance Difference Test (LDDT) | Tertiary Structure (3D) | A local consistency metric that evaluates distance differences for all atoms in a model without superposition. | Robust to domain movements; assesses local structural quality [39]. |
Benchmarking Workflow Protocol
- Dataset Selection and Curation: Choose an appropriate benchmark dataset (e.g., from Table 1) that matches the intended use case of the algorithm. For inverse folding, the comprehensive 320k dataset or EteRNA100 are suitable. For 3D structure prediction, a curated set like the RhoFold+ training data or targets from RNA-Puzzles should be used. Ensure no overlap between the training data of the evaluated tools and the test set [39] [2].
- Tool Execution and Data Collection: Run the selected algorithms (e.g., RhoFold+, DeepFoldRNA, RoseTTAFold2NA, DRfold for 3D; RNAinverse, INFO-RNA, Meta-LEARNA for inverse folding) on the benchmark dataset. For a fair comparison, use the "out-of-the-box" versions of the tools without human intervention or target-specific tuning [2]. Collect all predicted structures.
- Performance Calculation: For each prediction, compute the relevant metrics from Table 2. For secondary structure, this involves converting both the prediction and the reference structure into a base-pair matrix or graph representation before calculating F1, MCC, or the WL kernel [40]. For 3D structures, use tools like
rmsd,TM-score, andLDDTto compute the respective scores after structural alignment [39] [2]. - Analysis and Reporting: Aggregate results across the entire dataset. Perform stratified analysis to understand performance variation based on factors like RNA family, sequence length, and the quality of Multiple Sequence Alignments (MSA) for 3D methods [2]. Report average scores and standard deviations, and use visualization modules (e.g., from RnaBench) to illustrate key findings.
The diagram below visualizes this benchmarking workflow.
Visualization of Evaluation Metrics and Their Interrelationships
Understanding the strengths and weaknesses of different evaluation metrics is crucial for a nuanced interpretation of benchmarking results. The relationships between these metrics and the aspects of RNA structure they probe can be visualized as follows.
The Scientist's Toolkit: Essential Reagents for RNA Benchmarking
Table 3: Key Research Reagent Solutions for RNA Structure Benchmarking
| Reagent / Resource | Type | Function in Benchmarking | Example Tools / Sources |
|---|---|---|---|
| Standardized Benchmark Datasets | Data | Provides a common ground for fair and reproducible comparison of algorithm performance. | Comprehensive 320k dataset [14], EteRNA100 [38], RNA-Puzzles targets [39] |
| Multiple Sequence Alignment (MSA) Generators | Software | Constructs MSAs from input sequences, providing evolutionary information critical for the accuracy of many 3D prediction tools. | HH-suite, Jackhmmer [2] |
| Secondary Structure Prediction Tools | Software | Provides predicted base-pairing constraints that are often used as input for 3D structure prediction methods. | RNAfold, Contextfold, SPOT-RNA [14] [2] |
| Structure Comparison & Metric Calculators | Software | Computes quantitative metrics (RMSD, TM-score, LDDT, F1) to compare predicted models against reference structures. | TM-score calculator, LDDT tools [39] |
| Experimentally Validated Structure Databases | Database | Serves as the source of ground truth data for creating benchmarks and training models. | Protein Data Bank (PDB), RNAsolo, Rfam [14] [39] |
| Pre-trained RNA Language Models | Model | Provides evolutionarily informed sequence embeddings that can be used as input features for deep learning models. | RNA-FM (used in RhoFold+) [39] |
The establishment and adoption of curated gold-standard datasets are fundamental to driving progress in RNA structure prediction. The recent development of large-scale, diverse, and publicly available benchmarks, such as the comprehensive 320,000-instance dataset and the RNAscope framework, provides the community with the tools needed for rigorous evaluation [14] [28]. Moving forward, key challenges remain. These include improving the scarcity and quality of RNA 3D structural data, developing more nuanced metrics like the Weisfeiler-Lehman graph kernel that can better capture complex interactions, and creating benchmarks that effectively test generalization to orphan RNAs and structures with high conformational flexibility [40] [2]. By adhering to standardized benchmarking protocols and utilizing the reagents outlined in this guide, researchers can ensure their contributions are measurable, comparable, and ultimately, more impactful in advancing our understanding of RNA biology.
The prediction of ribonucleic acid (RNA) structure is a fundamental challenge in computational biology, with profound implications for understanding gene regulation, cellular functions, and the development of RNA-targeted therapeutics [9]. Traditional methods for structure prediction, which rely on thermodynamic models or comparative sequence analysis, often struggle with accuracy and generalizability, particularly for RNA families with limited homologous sequences or complex features like pseudoknots [41] [20]. The recent application of large language models (LLMs) to biological sequences has ushered in a transformative era for the field. These models, pre-trained on massive corpora of unlabeled RNA sequences, learn evolutionary, structural, and functional patterns, enabling them to serve as powerful foundation models for a wide range of downstream tasks [26] [7].
This guide provides a comparative analysis of three leading RNA language models: RNA-FM, RiNALMo, and ERNIE-RNA. Framed within the broader context of benchmarking RNA structure prediction algorithms, this article objectively evaluates their architectures, training methodologies, and performance on key structural and functional prediction tasks. The analysis is designed to assist researchers, scientists, and drug development professionals in selecting the most appropriate model for their specific research needs.
Model Architectures and Training Protocols
The performance of RNA language models is fundamentally shaped by their architectural choices and the data on which they are trained. This section details the core technical specifications and pre-training methodologies of the models under review.
Table 1: Architectural and Training Specifications of Leading RNA Language Models
| Model | Release Timeline | Architecture Style | Parameters | Pre-training Data Volume | Key Architectural Features |
|---|---|---|---|---|---|
| RNA-FM [42] | 2022 | BERT-style Encoder | 99 Million | 23.7 million ncRNA sequences | 12 layers, 640 hidden dimensions |
| RiNALMo [26] [43] | 2025 | Advanced BERT-style Encoder | 650 Million | 36 million ncRNA sequences | Rotary Positional Embedding (RoPE), SwiGLU activation, FlashAttention-2 |
| ERNIE-RNA [7] | 2025 | Modified BERT with Structural Bias | 86 Million | 20.4 million RNA sequences | Base-pairing-informed attention bias mechanism, 12 layers, 12 attention heads |
Core Architectural Innovations
RNA-FM: As a pioneering model, RNA-FM established the standard BERT-style encoder architecture for RNA sequences. It utilizes a masked language modeling (MLM) objective to learn contextual representations from 23.7 million non-coding RNA (ncRNA) sequences [42]. Its embeddings have been shown to implicitly encode secondary structure and 3D proximity information.
RiNALMo: Positioned as the largest RNA language model to date, RiNALMo incorporates several advanced architectural improvements inspired by modern natural language processing. The use of Rotary Positional Embedding (RoPE) enhances the model's ability to capture relative positional information, while the SwiGLU activation function and FlashAttention-2 optimization contribute to more efficient and effective learning from its extensive training corpus of 36 million ncRNA sequences [26].
ERNIE-RNA: This model introduces a key innovation by explicitly integrating RNA structural knowledge into its core architecture. Instead of relying solely on sequence, ERNIE-RNA incorporates a base-pairing-informed attention bias during the calculation of attention scores. This mechanism provides the model with prior knowledge of potential canonical base-pairing (A-U, G-C, G-U), guiding it to learn structural patterns directly from sequence data in a self-supervised manner [7].
Pre-training Data Curation
The composition and quality of pre-training data are critical for model performance. RNA-FM and RiNALMo were both trained predominantly on ncRNA sequences sourced from the RNAcentral database [26] [42]. RiNALMo's dataset is larger and was carefully curated from several databases. In contrast, ERNIE-RNA's training set was filtered to remove sequences longer than 1022 nucleotides and underwent redundancy removal, resulting in a final set of 20.4 million sequences. Notably, the developers of ERNIE-RNA conducted ablation studies on data composition, creating subsets that excluded overrepresented RNA families like rRNA and tRNA to analyze their impact on model learning [7].
Benchmarking Experimental Design
To ensure a fair and objective comparison, it is essential to understand the common experimental protocols and datasets used to evaluate these models. The following workflow outlines a standardized benchmarking pipeline.
Key Downstream Tasks and Datasets
The models are typically evaluated on a suite of downstream tasks that probe their understanding of RNA structure and function. Key tasks include:
- Secondary Structure Prediction: This involves predicting the base-pairing pattern of an RNA sequence. Generalizability is tested through family-wise cross-validation, where models are trained on certain RNA families and tested on completely unseen ones [26] [20]. Standard datasets include ArchiveII (3,966 RNAs), bpRNA-TS0 (1,305 RNAs), and Rfam (over 10,000 RNAs) [20].
- Tertiary Structure Prediction: For 3D structure prediction, models like RhoFold+ (which builds on RNA-FM embeddings) are benchmarked on community-wide challenges such as RNA-Puzzles and CASP15 [3]. Performance is measured using metrics like Root-Mean-Square Deviation (RMSD) and Template Modeling Score (TM-Score).
- Functional Classification: The Rfam family classification task evaluates the model's ability to categorize RNA sequences into their functional families based on sequence embeddings alone [26].
- Other Functional Tasks: This includes predicting splice sites, translation efficiency (TE), and expression level (EL) [26] [7].
The Scientist's Toolkit
Table 2: Essential Research Reagents and Resources for RNA Structure Prediction Research
| Resource Name | Type | Primary Function in Research |
|---|---|---|
| RNAcentral Database [26] [7] | Data Repository | Primary source of non-coding RNA sequences for model pre-training and analysis. |
| ArchiveII & bpRNA-TS0 [20] | Benchmark Dataset | Curated datasets for training and evaluating RNA secondary structure prediction algorithms. |
| RNA-Puzzles [3] | Benchmark Dataset | A set of blind challenges for assessing the accuracy of RNA 3D structure prediction methods. |
| PDB (Protein Data Bank) [3] | Data Repository | Repository of experimentally determined 3D structures used for validation and testing. |
| x3dna-dssr [44] | Software Tool | Analyzes 3D nucleic acid structures to extract secondary structure information for restraint-based modeling. |
Performance Comparison and Analysis
This section presents a detailed comparison of the models' performance across the key benchmarking tasks, synthesizing quantitative data from the provided sources.
Table 3: Comparative Performance on Key Downstream Tasks
| Model | Secondary Structure (Generalization) | Tertiary Structure (RMSD Å) | Rfam Family Classification (Accuracy) | Key Strength |
|---|---|---|---|---|
| RNA-FM | Struggles with generalization on unseen families [26] | Powers RhoFold+: ~4.02Å avg. on RNA-Puzzles [3] | Lower accuracy compared to newer models [26] | Foundation for 3D structure prediction (RhoFold+) |
| RiNALMo | State-of-the-art generalization [26] | Information not available in search results | State-of-the-art performance [26] | Generalization & large-scale representation learning |
| ERNIE-RNA | High zero-shot F1-score (0.55) [7] | Information not available in search results | State-of-the-art performance [7] | Explicit structural bias & zero-shot prediction |
| BPfold [20] | Superior accuracy and generalizability | Information not available in search results | Information not available in search results | Integration of thermodynamic energy priors |
Secondary Structure Prediction
The ability to predict secondary structure on unseen RNA families is a critical test of a model's generalizability.
- RiNALMo demonstrates a remarkable capability to overcome the generalization problem that plagues many deep learning methods. It achieves state-of-the-art results on inter-family secondary structure prediction, meaning it performs well on RNA families not encountered during its training [26].
- ERNIE-RNA excels in zero-shot secondary structure prediction, where the model predicts structure without task-specific fine-tuning. Its attention maps, informed by base-pairing biases, achieve an F1-score of up to 0.55, outperforming conventional methods like RNAfold and RNAstructure [7].
- RNA-FM, while a powerful foundation model, has been shown to have limitations in generalizing to unseen families compared to RiNALMo and ERNIE-RNA [26].
- BPfold, a deep learning approach that integrates a base pair motif energy library, also demonstrates great superiority in accuracy and generalizability, highlighting the value of incorporating physical priors [20].
Tertiary Structure and Functional Prediction
For tertiary structure prediction, models are often integrated into larger pipelines.
- RNA-FM serves as the foundational embedding model for RhoFold+, which achieves an average RMSD of 4.02 Å on RNA-Puzzles targets, surpassing other computational methods [3]. This demonstrates that RNA-FM's embeddings effectively capture information crucial for 3D structure assembly.
- For functional classification, such as assigning RNAs to their correct Rfam families, both RiNALMo and ERNIE-RNA report state-of-the-art performance, indicating that their sequence representations are highly informative of RNA function [26] [7].
The comparative analysis of RNA-FM, RiNALMo, and ERNIE-RNA reveals a clear trajectory in the development of RNA language models: from general-purpose foundational models toward more specialized, knowledge-informed architectures that prioritize generalizability.
For researchers, the choice of model depends heavily on the specific application:
- For tasks requiring the highest accuracy in 3D structure prediction, pipelines powered by RNA-FM, such as RhoFold+, are currently the best-validated option [3].
- For projects involving secondary structure prediction where generalizability to novel RNAs is paramount, RiNALMo or ERNIE-RNA are superior choices. RiNALMo offers the power of scale [26], while ERNIE-RNA provides a novel, inherently structure-aware architecture [7].
- For zero-shot structure analysis or when explicit structural interpretability is desired, ERNIE-RNA's attention maps offer a unique advantage [7].
Future progress in the field will likely involve even tighter integration of biophysical principles and evolutionary information into model architectures, as seen in the trends across all leading models. Furthermore, the creation of larger, more diverse, and higher-quality RNA structural datasets will be crucial for unlocking the next level of performance and reliability, ultimately accelerating the development of RNA-targeted therapeutics and synthetic biology applications.
Performance Metrics and the Critical Role of Homology-Aware Splits
Accurately predicting RNA structure is a cornerstone of understanding RNA function and developing RNA-targeting therapeutics [23]. The field has undergone a significant evolution, transitioning from thermodynamics-based methods to a new data-driven paradigm dominated by machine learning (ML) and deep learning (DL) models [23]. These models learn folding patterns directly from data, leading to notable improvements in prediction accuracy. However, this rapid progress has revealed a critical challenge: the "generalization crisis" [23]. Powerful models that demonstrated excellent performance on standard benchmarks were found to fail when applied to new RNA families, exposing a fundamental vulnerability in evaluation protocols. This crisis has prompted a community-wide shift toward stricter, homology-aware benchmarking to ensure that reported performance metrics reflect true predictive power rather than memory of training data.
This comparison guide objectively examines current RNA structure prediction algorithms through the critical lens of rigorous benchmarking. We detail the performance metrics essential for meaningful evaluation and demonstrate why homology-aware data splits are now considered mandatory for assessing model generalizability. By providing a structured analysis of experimental protocols and results, we equip researchers with the framework needed to critically evaluate existing tools and advance the development of more robust prediction methods.
Performance Metrics: Quantifying Prediction Accuracy
Core Metrics for Secondary and Tertiary Structure
The performance of RNA structure prediction algorithms is quantified using distinct metrics for secondary (2D) and tertiary (3D) structures. These metrics provide complementary views of model accuracy and are not directly comparable.
Table 1: Key Performance Metrics for RNA Structure Prediction
| Metric | Structural Level | Definition | Interpretation |
|---|---|---|---|
| F1 Score | Secondary (2D) | Harmonic mean of precision (correctness of predicted pairs) and recall (completeness of true pairs found) for base pairs [23]. | Ranges from 0-1; higher values indicate better accuracy. |
| Positive Predictive Value (PPV) | Secondary (2D) | Proportion of predicted base pairs that are correct [23]. | Measures prediction precision; standalone can be misleading if recall is low. |
| Sensitivity | Secondary (2D) | Proportion of true base pairs that are correctly predicted [23]. | Measures prediction completeness. |
| Root Mean Square Deviation (RMSD) | Tertiary (3D) | Average distance between the atoms (e.g., phosphorus atoms) of a predicted model and the native structure after optimal superposition [3]. | Measured in Ångströms (Å); lower values indicate better structural agreement. |
| Template Modeling (TM) Score | Tertiary (3D) | A superposition-free score that assesses the global similarity of two structures [3]. | Ranges from 0-1; higher values indicate better global topology. A score >0.5 suggests the same fold. |
| Local Distance Difference Test (lDDT) | Tertiary (3D) | A superposition-free score that evaluates local distance differences for all atoms in a model [3]. | Ranges from 0-100; higher values indicate better local atomic accuracy. |
The Critical Role of Homology-Aware Data Splits
The "generalization crisis" in RNA structure prediction emerged when researchers discovered that models achieving high F1 scores on standard benchmarks performed poorly on RNAs from families not represented in their training data [23]. This failure occurred because standard data splits (e.g., random or by chromosome) often allowed sequences from the same RNA family to appear in both training and test sets. Models could then "memorize" family-specific structures rather than learning the underlying principles of RNA folding.
Homology-aware splitting addresses this by ensuring that all sequences in the test set come from RNA families (or clusters) that are completely absent from the training data [23]. This method rigorously tests a model's ability to generalize to truly novel RNAs. The CompaRNA benchmark was an early effort in this direction, though the field's practices have since evolved [45]. The diagram below illustrates the logical relationship between data splitting strategies and the assessment of model capability.
Comparative Performance of Representative Algorithms
Tertiary Structure Prediction on RNA-Puzzles
A retrospective benchmark on RNA-Puzzles, a community-wide challenge for 3D structure prediction, highlights the performance of leading methods when evaluated using rigorous metrics. The following table summarizes the results, demonstrating the advantage of newer deep learning approaches.
Table 2: Performance on RNA-Puzzles Tertiary Structure Challenges [3]
| Method | Approach Type | Average RMSD (Å) | Average TM-score | Key Characteristics |
|---|---|---|---|---|
| RhoFold+ | Deep Learning (Language Model) | 4.02 | 0.57 | Fully automated, end-to-end; integrates an RNA language model pretrained on 23.7M sequences [3]. |
| FARFAR2 | De Novo Sampling (Energy-Based) | 6.32 | 0.44 | Physics-based Rosetta energy minimization; computationally intensive [3]. |
| trRosettaRNA | Deep Learning & Energy Minimization | ~8.5* | ~0.41* | Uses deep learning restraints (from RNAformer) with Rosetta minimization [3]. |
| E2Efold-3D | Deep Learning (End-to-End) | N/A (Reported lower than FARFAR2) | N/A | Differentiable, end-to-end pipeline [3]. |
| AlphaFold3 | Deep Learning (Diffusion-Based) | N/A | N/A | Can predict RNA structures directly from sequence; relies on constructed MSAs [3]. |
Note: Values for trRosettaRNA are estimated from graphical data in the source publication [3]. N/A indicates specific values were not provided in the cited source.
Secondary Structure Prediction and the Generalization Crisis
For secondary structure, the shift to homology-aware benchmarking has recalibrated the perceived performance of many algorithms. The table below categorizes representative methods and notes their context regarding generalization assessment.
Table 3: Categories of RNA Secondary Structure Prediction Methods [46] [23]
| Method Category | Representative Tools | Key Principle | Performance & Generalization Notes |
|---|---|---|---|
| Thermodynamics-Based | RNAfold (ViennaRNA), Mfold/UNAFold, RNAstructure | Finds the structure with the Minimum Free Energy (MFE) using a nearest-neighbor model [23]. | Performance plateaued; generally pseudoknot-free. Generalization is inherent but accuracy is limited. |
| Early Machine Learning | CONTRAfold, ContextFold | Replaces fixed energy parameters with data-driven scoring functions [23]. | First wave of data-driven methods; improved accuracy but faced generalization issues on novel families [23]. |
| Deep Learning (Single Sequence) | UFold, E2Efold | End-to-end deep learning that directly maps sequence to structure, often using image-like representations [46] [23]. | High accuracy but susceptible to the generalization crisis if not trained/evaluated with homology splits [23]. |
| Evolutionary (MSA-Based) | RNAalifold (from ViennaRNA), PETfold | Uses Multiple Sequence Alignments (MSAs) to identify covarying mutations that indicate conserved base pairs [23]. | Powerful but constrained by the "homology bottleneck"; fails for "orphan" RNAs with no known homologs [23]. |
| Hybrid & Foundation Models | (Emerging area) | Combines deep learning with biophysical principles or uses large language models pretrained on massive sequence corpora [23]. | A promising direction to mitigate data scarcity and improve generalization [23]. |
Experimental Protocols for Rigorous Benchmarking
Standardized Workflow for Model Evaluation
To ensure fair and meaningful comparisons, benchmarking studies should adhere to a standardized workflow that prioritizes homology-aware splitting. The following protocol, synthesized from current best practices [3] [23], provides a detailed methodology for evaluating new and existing prediction tools.
1. Dataset Curation:
- Source: Collect RNA sequences with experimentally validated structures from authoritative databases like the Protein Data Bank (PDB). Studies often use curated, non-redundant sets like the BGSU representative RNA structures [3].
- Preprocessing: Focus on single-chain RNAs for clarity. Cluster sequences at a specific identity threshold (e.g., 80% using Cd-hit) to define homologous families [3].
2. Data Partitioning (The Critical Step):
- Procedure: Assign entire sequence clusters to either the training set or the test set. No cluster should have sequences in both sets. This ensures the test set contains only "novel folds" from families unseen during training [23].
- Validation: A held-out validation set should also be created using the same cluster-based principle for model selection during training.
3. Model Training & Prediction:
- Training: Train the model exclusively on the training set partitions.
- Inference: Run the trained model on the held-out test set to generate structural predictions. It is critical that the model, in its evaluated form, has never been exposed to the test clusters.
4. Performance Quantification:
- Calculation: For each RNA in the test set, compute the metrics outlined in Table 1 (e.g., F1 score, RMSD, TM-score) by comparing the prediction against the experimental structure.
- Aggregation: Report the average and distribution of these metrics across the entire test set to provide a comprehensive view of performance.
The workflow is visualized in the following diagram.
Case Study: RhoFold+ Evaluation on RNA-Puzzles
The evaluation of RhoFold+ serves as a exemplary implementation of a rigorous benchmark [3]. The developers curated 24 single-chain RNA targets from RNA-Puzzles that did not overlap with their training data. To explicitly test for generalization, they analyzed the correlation between model performance (TM-score and lDDT) and the maximum sequence similarity between each puzzle target and any RNA in the training set. The results showed no significant correlation (R² = 0.23 for TM-score), providing strong evidence that RhoFold+'s high accuracy (average RMSD of 4.02 Å) stemmed from genuine learning of structural principles rather than memorization [3]. Furthermore, for most targets, RhoFold+'s predictions surpassed the structural similarity achieved by the best single template in the training set, demonstrating its power for de novo prediction.
The Scientist's Toolkit: Essential Research Reagents
Implementing and evaluating RNA structure prediction models requires a suite of computational "reagents." The following table details key resources, their functions, and their relevance to rigorous benchmarking.
Table 4: Essential Computational Tools for RNA Structure Research
| Tool/Resource | Category | Function | Relevance to Benchmarking |
|---|---|---|---|
| ViennaRNA Package | Secondary Structure Prediction | Provides classic thermodynamics-based algorithms (e.g., RNAfold) for MFE and partition function calculation [46]. | Serves as a foundational baseline for comparing the accuracy of modern data-driven methods. |
| RNAstructure | Secondary Structure Prediction | A versatile software suite for predicting RNA secondary structure, with support for experimental constraints and pseudoknots [46]. | Another key baseline; its constraint functionality is useful for incorporating experimental data. |
| FARFAR2 | Tertiary Structure Prediction | A de novo fragment assembly method within the Rosetta framework for sampling native-like RNA 3D structures [3]. | A standard benchmark against which new deep learning-based tertiary predictors are compared. |
| BGSU Representative Sets | Data Curation | A periodically updated, non-redundant set of RNA structures from the PDB, clustered by sequence similarity [3]. | Provides a pre-processed, high-quality dataset ideal for creating homology-aware training and test sets. |
| Cd-hit | Data Curation | A program for clustering biological sequences to reduce redundancy and define sequence families [3]. | The essential tool for implementing the homology-aware splitting protocol. |
| TM-align | Structure Comparison | An algorithm for calculating the TM-score, a metric for assessing the topological similarity of two protein or RNA structures [3]. | A standard tool for quantifying the accuracy of predicted tertiary structures against experimental references. |
| CompaRNA | Benchmarking Portal | A web server for continuous benchmarking of automated RNA secondary structure prediction methods [45]. | A historical and illustrative example of community-wide benchmarking efforts. |
Independent Benchmarking Studies and Community-Wide Validation Efforts
The field of computational RNA structure prediction has experienced rapid innovation, particularly with the rise of machine learning (ML) and deep learning methods. This proliferation of new algorithms has made independent benchmarking and community-wide validation not merely beneficial but essential for quantifying progress, identifying robust methods, and guiding future research directions [47] [48]. Benchmarking provides an objective framework to evaluate the performance of different algorithms on standardized datasets, separating genuine advancements from overfitting to specific data types. For researchers, drug developers, and scientists relying on these predictions, benchmarking studies offer a critical compass, highlighting which tools are most reliable for specific tasks, such as predicting secondary structure for a well-conserved family or tackling a novel, "orphan" RNA with no known homologs [11] [2]. This guide synthesizes findings from recent, independent benchmarking studies to objectively compare the performance of leading RNA structure prediction methods, detailing their experimental protocols and presenting key quantitative data.
Current Landscape of RNA Structure Prediction Algorithms
RNA structure prediction methods can be broadly categorized by their prediction target (secondary or tertiary structure) and their underlying methodology.
Secondary structure prediction involves determining the set of canonical (Watson-Crick) and non-canonical (e.g., G-U) base pairs that form within a single RNA strand. Traditional approaches include:
- Thermodynamic-based methods (e.g., Mfold, RNAfold) which predict the minimum free energy structure [48].
- Comparative methods which use evolutionary information from multiple sequence alignments to infer a consensus structure [48].
- Deep Learning-based methods, including models leveraging large language models (LLMs) pretrained on millions of RNA sequences to learn folding patterns directly from data [47] [11].
Tertiary (3D) structure prediction aims to determine the full three-dimensional atomic coordinates. Key approaches include:
- Fragment-Assembly (FA) methods (e.g., FARFAR2/ARES, RNAComposer) which assemble 3D models from structural fragments of known RNAs [3] [2].
- Deep Learning methods (e.g., DeepFoldRNA, RoseTTAFold2NA, RhoFold+) which often use end-to-end deep neural networks, sometimes incorporating evolutionary and secondary structure information, to predict 3D coordinates [3] [2].
A significant challenge identified by recent benchmarks is the "generalization crisis"—where powerful models trained on specific RNA families fail to maintain accuracy when applied to new, unseen families [47] [11]. This has prompted a community-wide shift towards stricter, homology-aware benchmarking to ensure realistic performance estimates.
Comparative Performance Analysis of Prediction Methods
Performance Benchmarking of Tertiary Structure Prediction
Independent, systematic benchmarking of state-of-the-art deep learning and traditional methods for RNA tertiary structure prediction reveals clear performance trends and dependencies [2]. The following table summarizes the key comparative findings:
Table 1: Benchmarking Results for Tertiary RNA Structure Prediction Methods
| Method | Type | Overall Performance (RMSD ↓) | Performance on Orphan/Novel RNAs | Dependencies |
|---|---|---|---|---|
| DeepFoldRNA | DL-based | Best overall [2] | Slightly better than FA-based, but generally poor [2] | MSA depth, RNA type, secondary structure [2] |
| RhoFold+ | DL-based | Superior on RNA-Puzzles (Avg. RMSD: 4.02 Å) [3] | Generalizes well to sequence-dissimilar targets [3] | Uses MSA and RNA language model [3] |
| DRFold | DL-based | Second best overall [2] | Slightly better than FA-based, but generally poor [2] | Relies on predicted secondary structures [3] [2] |
| FARFAR2 | FA-based (Non-ML) | Lower accuracy than DL (e.g., Avg. RMSD: 6.32 Å) [3] | Comparable to DL methods [2] | Template/library-dependent [3] |
| RoseTTAFold2NA | DL-based | Moderate accuracy [2] | Slightly better than FA-based, but generally poor [2] | MSA depth, RNA type, secondary structure [2] |
| trRosettaRNA | DL-based | Moderate accuracy [2] | Slightly better than FA-based, but generally poor [2] | MSA depth, RNA type, secondary structure [2] |
The benchmarking study concluded that ML-based methods generally outperform traditional fragment-assembly-based methods on most RNA targets [2]. However, this performance advantage narrows significantly when predicting structures for "orphan RNAs" — those without close homologs in databases — with all methods showing poor performance in this challenging scenario [2]. The quality of the Multiple Sequence Alignment (MSA) and the accuracy of the predicted secondary structure were identified as two critical factors influencing the performance of most deep learning methods [2].
Performance Benchmarking of Secondary Structure Prediction using LLMs
With the emergence of RNA-specific Large Language Models (LLMs), new benchmarks have been developed to evaluate their utility for secondary structure prediction. A 2025 comprehensive benchmarking study assessed various pretrained RNA-LLMs under a unified experimental setup with datasets of increasing generalization difficulty [11].
Table 2: Benchmarking Insights for RNA LLMs on Secondary Structure Prediction
| Aspect | Key Finding |
|---|---|
| Overall Performance | Two LLMs (not named in excerpt) clearly outperformed the others, though the top performers were context-dependent [11]. |
| Generalization Challenge | Models showed "significant challenges for generalization in low-homology scenarios" [11]. |
| Community Resource | The study provided "curated benchmark datasets of increasing complexity and a unified experimental setup" for future comparisons [11]. |
Another notable model, ERNIE-RNA, demonstrated strong capabilities in zero-shot RNA secondary structure prediction, outperforming conventional thermodynamics-based methods like RNAfold and RNAstructure, suggesting it naturally develops comprehensive structural representations during pre-training [7].
Experimental Protocols in Benchmarking Studies
Standardized Benchmarking Methodology
To ensure fair and informative comparisons, independent benchmarking studies follow rigorous experimental protocols. The workflow below illustrates the general process for a tertiary structure prediction benchmark, synthesized from published methodologies [3] [2].
Diagram 1: Tertiary structure benchmarking workflow.
The foundational steps of a robust benchmarking protocol include:
Dataset Curation: Compiling a diverse and balanced set of RNA sequences with known experimental structures is the first critical step. To ensure a rigorous test, datasets are often clustered to remove redundancy (e.g., using Cd-hit at 80% sequence identity) and are carefully split to prevent homology between training and test sets [3] [2]. Standard sources include the PDB and community challenge targets from RNA-Puzzles and CASP [3].
Method Execution & Automation: Benchmarking studies emphasize running all prediction methods in a fully automated, "out-of-the-box" manner, without human intervention or expert knowledge input. This approach tests the real-world applicability of the tools and ensures a fair comparison [2].
Performance Quantification: Predictions are evaluated against experimentally-solved ground-truth structures using standardized metrics. Common metrics include:
- Root Mean Square Deviation (RMSD): Measures the average distance between corresponding atoms in predicted and true structures after optimal superposition. Lower values indicate better accuracy [3].
- Template Modeling Score (TM-Score): A superposition-free metric that is more sensitive to global topology than local errors. Scores range from 0-1, with higher values indicating better structural similarity [3].
- Local Distance Difference Test (LDDT): A superposition-free metric that evaluates local distance differences for all atoms in a model, assessing the local quality of the prediction [3].
Stratified Analysis: Results are analyzed across different dimensions to understand performance dependencies. Key factors include RNA family diversity, sequence length, RNA type (e.g., tRNA, rRNA), and the quality/depth of the Multiple Sequence Alignment (MSA) used by the method [2].
Community-Wide Validation Efforts
Beyond individual research group benchmarks, community-wide blind assessments provide the gold standard for validation. These efforts mimic the successful CASP (Critical Assessment of protein Structure Prediction) experiments and are crucial for unbiased evaluation.
- RNA-Puzzles: A community-wide experiment where research groups blindly predict RNA structures for which the experimental result is unknown but soon to be released. This prevents any bias from tailoring methods to a known answer. A retrospective analysis of these puzzles is a common form of validation for new methods [3].
- CASP (Critical Assessment of Structure Prediction): This international experiment includes a RNA structure prediction track. The performance of AI-based methods in CASP15 for RNA was notably less successful than for proteins, highlighting the unique challenges of RNA modeling [2].
The diagram below illustrates the cyclical, community-driven nature of these validation efforts.
Diagram 2: Community-wide blind assessment cycle.
Essential Research Reagents and Computational Tools
For scientists embarking on RNA structure prediction or seeking to reproduce benchmarking studies, the following table details key computational "research reagents" and their functions.
Table 3: Essential Research Reagents and Resources for RNA Structure Prediction
| Resource Name | Type | Function in Research | Relevance to Benchmarking |
|---|---|---|---|
| Protein Data Bank (PDB) | Data Repository | Primary archive of experimentally determined 3D structures of proteins and nucleic acids. | Source of ground truth data for training and testing prediction algorithms [3] [2]. |
| RNAcentral | Database | A comprehensive database of non-coding RNA sequences, consolidating data from various specialist resources. | Source of millions of sequences for pre-training language models like ERNIE-RNA and RNA-FM [7]. |
| BGSU Representative Sets | Curated Dataset | Non-redundant sets of RNA structures clustered by sequence similarity, maintained by Bowling Green State University. | Provides a standardized, non-redundant dataset for training and evaluation to avoid bias [3]. |
| RNA-Puzzles & CASP Targets | Benchmark Datasets | Collections of RNA sequences used in community-wide blind prediction challenges. | Serves as a standard, independent benchmark for evaluating and comparing new methods [3] [2]. |
| Cd-hit | Software Tool | A program for clustering biological sequences to reduce redundancy and create representative datasets. | Critical for curating non-redundant training and testing datasets to prevent overfitting [3]. |
| RNA-FM / ERNIE-RNA | Pretrained Language Model | Foundational models pre-trained on massive RNA sequence corpora to generate semantically rich numerical representations (embeddings). | Used as input features to enhance downstream prediction tasks, improving generalization [3] [7]. |
| Curated Benchmark Datasets [11] | Benchmark Dataset | Publicly available datasets of increasing complexity, created for unified LLM evaluation. | Enables fair comparison of different RNA LLMs on secondary structure prediction tasks [11]. |
Independent benchmarking consistently shows that while deep learning methods have pushed the boundaries of RNA structure prediction, significant challenges remain. The performance of leading methods is highly dependent on the availability of evolutionary information (MSA depth) and accurate secondary structure, and generalization to novel RNA families is still a major hurdle [47] [11] [2].
The future of robust benchmarking will likely involve:
- Prospective, standardized benchmarking systems to ensure continuous and unbiased validation of new methods [47].
- Increased focus on generalization, with benchmarks specifically designed to include orphan RNAs and low-homology scenarios.
- Expanding prediction targets beyond single, static structures to include dynamic ensembles, pseudoknots, and the effects of chemically modified nucleotides [47].
For researchers and drug developers, this guide underscores the importance of consulting independent benchmarking studies when selecting a computational tool. The choice of method should be guided by the specific RNA of interest—whether it has abundant homologs or is a novel target—as no single algorithm currently dominates all scenarios.
Conclusion
The field of RNA structure prediction is in a transformative phase, driven by deep learning and large language models that have significantly pushed the boundaries of accuracy. However, this review underscores that the path forward requires overcoming critical hurdles: ensuring model generalization to novel RNA families, expanding the woefully incomplete library of known RNA structural fragments, and developing standardized, prospective benchmarking systems. The emergence of curated datasets and rigorous, homology-aware evaluation protocols marks a crucial step toward unbiased validation. For biomedical and clinical research, particularly in RNA therapeutics and drug discovery, these computational advances promise to accelerate the functional interpretation of the non-coding genome. Future progress hinges on a synergistic combination of larger and more diverse experimental data, innovative model architectures that capture RNA structural ensembles, and a continued commitment to community-driven benchmarking, ultimately closing the gap between sequence and meaningful structure.
References
- 1. State-of-the-RNArt: benchmarking current methods for RNA ... [https://pmc.ncbi.nlm.nih.gov/articles/PMC11091930/]
- 2. Systematic benchmarking of deep-learning methods for ... [https://journals.plos.org/ploscompbiol/article?id=10.1371/journal.pcbi.1012715]
- 3. Accurate RNA 3D structure prediction using a language ... [https://www.nature.com/articles/s41592-024-02487-0]
- 4. mRNA folding algorithms for structure and codon optimization [https://pmc.ncbi.nlm.nih.gov/articles/PMC12319323/]
- 5. rapid assessment and visualization of RNA structure content [https://pmc.ncbi.nlm.nih.gov/articles/PMC10017096/]
- 6. Comparison of Three Computational Tools for the ... [https://pmc.ncbi.nlm.nih.gov/articles/PMC11587127/]
- 7. ERNIE-RNA: an RNA language model with structure ... [https://www.nature.com/articles/s41467-025-64972-0]
- 8. Comprehensive benchmarking of large language models ... [https://pmc.ncbi.nlm.nih.gov/articles/PMC11982019/]
- 9. RNA structure prediction using deep learning [https://www.sciencedirect.com/science/article/pii/S0010482525001957]
- 10. A comprehensive benchmark of RNA–RNA interaction ... [https://pmc.ncbi.nlm.nih.gov/articles/PMC5408919/]
- 11. Comprehensive benchmarking of large language models ... [https://pubmed.ncbi.nlm.nih.gov/40205851/]
- 12. Challenges and opportunities in technologies and methods ... [https://pmc.ncbi.nlm.nih.gov/articles/PMC12492894/]
- 13. Big data and deep learning for RNA biology [https://www.nature.com/articles/s12276-024-01243-w]
- 14. Comprehensive datasets for RNA design, machine ... [https://www.nature.com/articles/s41598-025-07041-2]
- 15. Accurate prediction of RNA secondary structure including ... [https://pmc.ncbi.nlm.nih.gov/articles/PMC10924946/]
- 16. How to benchmark RNA secondary structure prediction accuracy [https://pubmed.ncbi.nlm.nih.gov/30951834/]
- 17. DynaRNA: accurate dynamic RNA conformation ensemble ... [https://pmc.ncbi.nlm.nih.gov/articles/PMC12528399/]
- 18. How does RNA fold dynamically? [https://www.sciencedirect.com/science/article/pii/S0022283622002571]
- 19. Analysis of energy-based algorithms for RNA secondary ... [https://bmcbioinformatics.biomedcentral.com/articles/10.1186/1471-2105-13-22]
- 20. Deep generalizable prediction of RNA secondary structure ... [https://www.nature.com/articles/s41467-025-60048-1]
- 21. free grammars for RNA secondary structure prediction - PMC [https://pmc.ncbi.nlm.nih.gov/articles/PMC3464655/]
- 22. Grammar-Based Computational Framework for Predicting ... [https://www.mdpi.com/2673-4117/5/4/132]
- 23. Machine Learning for RNA Secondary Structure Prediction [https://arxiv.org/html/2511.02622v1]
- 24. Large language models (LLMs) might be the future ... [https://pmc.ncbi.nlm.nih.gov/articles/PMC12430758/]
- 25. Comprehensive benchmarking of large language models ... [https://arxiv.org/html/2410.16212v1]
- 26. RiNALMo: general-purpose RNA language models can ... [https://www.nature.com/articles/s41467-025-60872-5]
- 27. A Comparative Review of RNA Language Models [https://arxiv.org/abs/2505.09087]
- 28. RNAscope: Benchmarking RNA Language Models for ... [https://openreview.net/forum?id=zYAuJxcl2E]
- 29. A Comprehensive Benchmark for RNA 3D Structure ... [https://arxiv.org/abs/2503.21681]
- 30. A comprehensive comparison of general RNA ... [https://www.lifescience.net/publications/1592915/a-comprehensive-comparison-of-general-rna-rna-inte/]
- 31. A Comprehensive Benchmark for RNA 3D Structure ... [https://arxiv.org/html/2503.21681v2]
- 32. PaRPI predicts RNA-Protein interactions from cross- ... [https://www.nature.com/articles/s42003-025-08807-0]
- 33. Comparative analysis of RNA secondary structure accuracy ... [https://journals.plos.org/plosone/article?id=10.1371/journal.pone.0290907]
- 34. Systematic benchmarking of deep-learning methods for ... [https://pubmed.ncbi.nlm.nih.gov/39775239/]
- 35. Advances in Methods for Accurate Prediction of RNA–Small ... [https://pmc.ncbi.nlm.nih.gov/articles/PMC12567027/]
- 36. Computational Approaches to RNA Structure Prediction ... [https://pmc.ncbi.nlm.nih.gov/articles/PMC3112238/]
- 37. How to Benchmark RNA Secondary Structure Prediction ... [https://pmc.ncbi.nlm.nih.gov/articles/PMC7202366/]
- 38. Comprehensive datasets for RNA design, machine learning ... [https://pmc.ncbi.nlm.nih.gov/articles/PMC12215848/]
- 39. Accurate RNA 3D structure prediction using a language model ... [https://pmc.ncbi.nlm.nih.gov/articles/PMC11621015/]
- 40. Rethinking Performance Measures of RNA Secondary ... [https://arxiv.org/abs/2401.05351]
- 41. A brief review and comparative analysis of RNA secondary ... [https://pubmed.ncbi.nlm.nih.gov/40693431/]
- 42. ml4bio/RNA-FM: Nature Methods: RNA foundation model ... [https://github.com/ml4bio/RNA-FM]
- 43. RiNALMo: an AI model that deciphers the language of RNA ... [https://www.eurekalert.org/news-releases/1105840]
- 44. Comparative analysis of RNA 3D structure prediction ... [https://data.mendeley.com/datasets/8yg88x7rdk/5]
- 45. CompaRNA - on-line benchmarks of RNA structure ... [https://genesilico.pl/comparna/]
- 46. List of RNA structure prediction software [https://en.wikipedia.org/wiki/List_of_RNA_structure_prediction_software]
- 47. Machine Learning for RNA Secondary Structure Prediction [https://arxiv.org/abs/2511.02622]
- 48. A comprehensive comparison of comparative RNA structure ... [https://pmc.ncbi.nlm.nih.gov/articles/PMC526219/]