RNA-seq vs Microarray: A Modern Guide to Gene Expression Analysis for Biomedical Research
This article provides a comprehensive comparison of bulk RNA sequencing and microarray technologies for researchers and drug development professionals.
RNA-seq vs Microarray: A Modern Guide to Gene Expression Analysis for Biomedical Research
Abstract
This article provides a comprehensive comparison of bulk RNA sequencing and microarray technologies for researchers and drug development professionals. It covers foundational principles, methodological workflows, and data analysis to guide platform selection. The content explores key advantages of RNA-seq, including its wider dynamic range and ability to detect novel transcripts, while also examining contexts where microarrays remain viable. Drawing from recent studies and systematic evaluations, the article delivers evidence-based insights for optimizing transcriptomic studies, from experimental design to data interpretation, supporting informed decision-making in biomedical and clinical research.
Core Principles: Understanding the Fundamental Differences Between RNA-seq and Microarrays
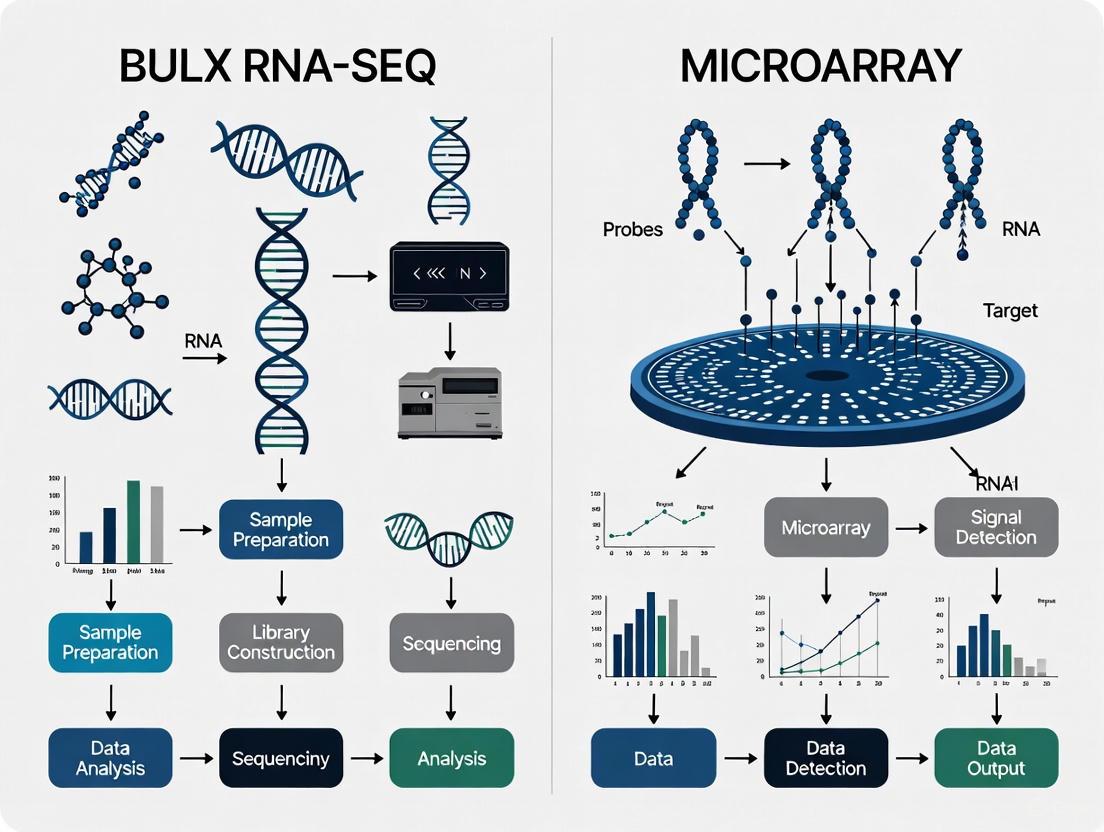
In the field of transcriptomics, two fundamentally distinct technological paradigms have enabled researchers to profile gene expression on a genome-wide scale: hybridization-based and sequencing-based methods. Hybridization-based technologies, primarily represented by DNA microarrays, determine expression levels by measuring the intensity of fluorescent signals when labeled nucleic acids bind to complementary probes fixed on a solid surface [1] [2]. In contrast, sequencing-based technologies, most notably RNA sequencing (RNA-Seq), directly determine the nucleotide sequence of cDNA molecules through massive parallel sequencing, providing digital counts of transcript abundance [3] [4].
These approaches operate on different biochemical principles, offer distinct advantages and limitations, and have followed contrasting trajectories in their adoption and development. Microarrays, developed earlier, maturely standardized, and more cost-effective, dominated the field for over a decade [3]. RNA-Seq, emerging later, offers a more flexible and comprehensive view of the transcriptome without relying on predefined probes [4]. Within the context of bulk RNA-seq versus microarray comparison research, understanding their core differences is essential for selecting the appropriate tool for specific biological questions, especially in drug discovery and development where accurate transcriptome profiling can identify novel therapeutic targets and biomarkers [5] [6].
Core Technological Principles and Workflows
The Hybridization-Based Approach (Microarrays)
The fundamental principle of microarray technology involves the specific base-pairing (hybridization) of fluorescently-labeled cDNA fragments from a sample to DNA probes attached to a solid surface in a predefined array.
Diagram 1: Microarray experimental workflow.
The detailed experimental protocol for microarrays typically follows these steps [3]:
- Sample Preparation & cDNA Synthesis: Total RNA is extracted from biological samples. Using reverse transcriptase and a T7-linked oligo(dT) primer, single-stranded cDNA is synthesized, which is then converted to double-stranded cDNA.
- Labeling: The double-stranded cDNA serves as a template for in vitro transcription (IVT) to synthesize complementary RNA (cRNA). This reaction incorporates biotinylated UTP and CTP, thereby labeling the cRNA.
- Hybridization: The biotin-labeled cRNA is fragmented and hybridized to the microarray chip, which contains hundreds of thousands of specific DNA probes. Hybridization occurs under controlled conditions (e.g., 45°C for 16 hours).
- Washing and Staining: After hybridization, the chip is washed to remove non-specifically bound material. It is then stained with a fluorescent dye (e.g., streptavidin-phycoerythrin) that binds to the biotin labels.
- Signal Detection: The chip is scanned with a laser, and the fluorescence intensity at each probe spot is measured. This intensity is proportional to the abundance of the corresponding transcript in the original sample.
- Data Processing: The raw image files are processed to generate cell intensity files. Background adjustment, quantile normalization, and summarization of probe-level data are performed using algorithms like the Robust Multi-chip Average to obtain normalized gene expression values.
The Sequencing-Based Approach (RNA Sequencing)
RNA-Seq abandons the concept of hybridization to predefined probes in favor of directly sequencing the entire population of cDNA molecules.
Diagram 2: RNA-seq experimental workflow.
The standard protocol for bulk RNA-Seq involves [3] [7]:
- RNA Extraction and Selection: Total RNA is extracted. Messenger RNA (mRNA) is typically enriched either by oligo(dT) magnetic beads that capture poly-adenylated transcripts or by ribosomal RNA depletion.
- Library Preparation: The enriched RNA is fragmented. cDNA is synthesized from the fragments, and then sequencing adapters are ligated to both ends. This creates a "library" of molecules ready for sequencing.
- Massively Parallel Sequencing: The library is loaded onto a sequencing platform (e.g., Illumina). The process involves amplification and cyclic sequencing-by-synthesis, generating millions to billions of short sequence reads.
- Bioinformatic Analysis:
- Pre-processing & Alignment: Raw sequencing reads are quality-checked and trimmed. They are then aligned to a reference genome or transcriptome.
- Quantification: The number of reads mapped to each gene or transcript is counted, generating a digital expression value (e.g., read counts).
- Normalization & Differential Expression: Read counts are normalized to account for factors like sequencing depth and gene length. Statistical models (e.g., in DESeq2) are then applied to identify differentially expressed genes (DEGs) between sample groups.
Performance Comparison: Key Metrics and Experimental Data
Direct comparisons between microarrays and RNA-Seq have been the subject of numerous studies. The table below synthesizes quantitative and qualitative findings from benchmark reports and reviews.
Table 1: Performance comparison of hybridization-based microarrays and RNA-Seq.
| Feature | Hybridization-Based (Microarray) | Sequencing-Based (RNA-Seq) | Supporting Evidence |
|---|---|---|---|
| Detection Principle | Analog fluorescence intensity | Digital read counts | [1] [4] |
| Dynamic Range | ~10³ (limited by background & saturation) | >10⁵ (wide, virtually unlimited) | [4] |
| Specificity & Sensitivity | Lower, especially for low-abundance transcripts | Higher, can detect more DEGs, including low-expression genes | [4] [7] |
| Ability to Detect Novel Features | No; limited to predefined probes on the array | Yes; can identify novel transcripts, isoforms, gene fusions, SNPs, and indels | [4] |
| Reproducibility | High correlation across technical replicates on same platform | High correlation, but inter-laboratory variation can be significant | [1] [7] |
| Typical Workflow Duration | Shorter, streamlined | Longer, more complex steps | Implied by [8] [9] |
| Cost per Sample | Generally lower | Generally higher | [3] |
| Data Analysis | Well-established, standardized methods | Complex, computationally intensive, evolving tools | [3] [7] |
| Concordance with "Ground Truth" | Moderate to high correlation with qPCR for well-expressed genes | High correlation with qPCR and spike-in controls; more accurate for absolute quantification | [7] |
A large-scale, real-world benchmarking study across 45 laboratories highlighted significant inter-laboratory variations in RNA-Seq performance, particularly when detecting subtle differential expression between samples with very similar transcriptome profiles [7]. This study emphasized that factors like mRNA enrichment protocol, library strandedness, and the choice of bioinformatics pipelines are major sources of variation. In contrast, microarray data from different platforms generally show high correlations, though concordance with sequencing-based methods like MPSS is only moderate [1] [2]. The discrepancies are often attributed to genes with low-abundance transcripts and technological limitations inherent to each method [2].
The Scientist's Toolkit: Essential Reagents and Solutions
Table 2: Key research reagents and their functions in transcriptomics.
| Reagent / Kit | Function | Technology |
|---|---|---|
| Oligo(dT) Magnetic Beads | Enriches for polyadenylated mRNA from total RNA | RNA-Seq |
| Biotinylated UTP/CTP | Labels cRNA for fluorescence detection after hybridization | Microarray |
| GeneChip PrimeView Array | A predefined microarray chip containing probes for human gene expression | Microarray |
| Illumina Stranded mRNA Prep Kit | Library preparation kit for creating sequencing-ready RNA libraries | RNA-Seq |
| EZ1 RNA Cell Mini Kit | Automated purification of total RNA from cell lysates | Both |
| External RNA Control Consortium (ERCC) Spike-Ins | Synthetic RNA controls added to samples to assess technical performance and accuracy | Both (QC) |
| DNase I | Digests contaminating genomic DNA during RNA purification | Both |
| Streptavidin-Phycoerythrin | Fluorescent dye that binds to biotin for signal detection | Microarray |
Hybridization-based microarrays and sequencing-based RNA-Seq are both powerful and important tools for transcriptome profiling [1] [2]. The choice between them is not a matter of one being universally superior, but rather depends on the specific research goals, budget, and technical expertise.
For well-defined projects focused on profiling the expression of known genes, where cost-effectiveness, streamlined workflow, and access to well-established public databases are priorities, microarrays remain a viable and robust choice [3]. However, for discovery-oriented research that requires a comprehensive, unbiased view of the transcriptome, including the detection of novel transcripts, splice variants, and other genetic variations, RNA-Seq is the unequivocal leading technology [4].
The evolution of transcriptomics continues with the rise of single-cell RNA sequencing (scRNA-seq), which resolves cellular heterogeneity and is transforming target identification and validation in drug discovery [5]. Furthermore, the application of artificial intelligence to analyze large-scale pharmacotranscriptomic data is creating a new paradigm for drug screening and mechanism-of-action studies [6]. As sequencing costs decrease and analytical methods become more standardized and robust, RNA-Seq and its derivatives are poised to become even more central to biological and clinical research.
The choice of transcriptome profiling technology is a fundamental decision in genomics research, influencing the depth, accuracy, and scope of biological insights. For years, gene expression microarrays were the cornerstone of transcriptomics. The advent of next-generation sequencing (NGS) introduced RNA sequencing (RNA-seq), which provides a fundamentally different approach to measuring RNA abundance. This guide offers an objective, data-driven comparison of these two platforms, focusing on the critical performance parameters of dynamic range, sensitivity, and specificity. Understanding these technical specifications is essential for researchers and drug development professionals to select the optimal technology for their experimental aims, whether for discovery-driven research or targeted clinical assay development.
The core distinction between microarrays and RNA-seq lies in their underlying mechanism for detecting RNA molecules. Microarrays are a hybridization-based technology that relies on fluorescence. In this process, RNA is extracted and reverse-transcribed into complementary DNA (cDNA), which is labeled with fluorescent dyes. This labeled cDNA is then hybridized to pre-defined probes immobilized on a solid surface. The resulting fluorescence intensity at each probe spot is measured, and this signal serves as a proxy for the original RNA abundance [10].
In contrast, RNA-seq is a sequencing-based technology that provides digital, countable data. After RNA extraction, a library is constructed by fragmenting the RNA and converting it into cDNA. These cDNA fragments are then sequenced in a high-throughput manner using NGS platforms. The generated sequence reads are digitally mapped to a reference genome or transcriptome, and the abundance of each transcript is quantified by counting the number of reads that align to it [4] [10].
The following diagram illustrates the fundamental differences in these workflows:
Direct Technical Comparison
The differing principles of microarrays and RNA-seq lead to significant disparities in their technical performance. The following table summarizes the key specifications for dynamic range, sensitivity, and specificity based on empirical comparisons.
Table 1: Technical Specifications of Microarray vs. RNA-seq
| Performance Parameter | Microarray | RNA-Seq | Experimental Support |
|---|---|---|---|
| Dynamic Range | ~10³ [4] | >10⁵ [4] | Broader linear range without upper saturation or background noise limits [4]. |
| Sensitivity | Lower, especially for low-abundance transcripts [4] | Higher; can detect rare and low-abundance transcripts (e.g., single transcripts per cell) [4] | RNA-seq identifies a higher percentage of differentially expressed genes (DEGs), particularly those with low expression [4] [11]. |
| Specificity | Limited by cross-hybridization between related sequences [3] | High; precise mapping of reads to the genome allows discrimination between homologous genes and isoforms [4] | RNA-seq provides improved specificity for detecting transcripts and specific isoforms [4]. |
| Novel Transcript Detection | Restricted to known, pre-defined probes [4] | Unbiased discovery of novel transcripts, splice variants, and gene fusions [4] [12] | RNA-seq can identify novel exons and transcript isoforms not annotated in reference databases [12]. |
Experimental Evidence and Validation
Concordance in Differential Expression and Pathway Analysis
Despite the superior technical performance of RNA-seq, studies have shown that both platforms can yield concordant biological interpretations under specific conditions. A 2025 toxicogenomics study compared microarray and RNA-seq using two cannabinoids, cannabichromene (CBC) and cannabinol (CBN). While RNA-seq identified a larger number of differentially expressed genes (DEGs) with a wider dynamic range, gene set enrichment analysis (GSEA) revealed that the functions and pathways impacted by chemical exposure were equivalent between the platforms. Furthermore, transcriptomic point of departure (tPoD) values derived from benchmark concentration (BMC) modeling were on the same level for both CBC and CBN, indicating similar utility for quantitative risk assessment [3].
Another 2025 study analyzing human whole blood samples from youth with and without HIV also found a high correlation (median Pearson correlation coefficient of 0.76) in gene expression profiles between the platforms. Although RNA-seq identified 2,395 DEGs compared to 427 from microarrays, there was a statistically significant concordance in the 223 shared DEGs. Pathway analysis further showed that while RNA-seq perturbed 205 pathways versus 47 for microarrays, 30 key pathways were shared. The study concluded that with consistent non-parametric statistical methods, both platforms provide highly concordant results for downstream functional analysis [11] [13].
Clinical Endpoint Prediction
A critical large-scale analysis by the MAQC-III/SEQC consortium systematically compared the power of RNA-seq and microarray-based models for clinical endpoint prediction using 498 neuroblastoma samples. The study found that while RNA-seq vastly outperformed microarrays in characterizing the transcriptome (revealing >48,000 genes and 200,000 transcripts versus 21,101 genes on the microarray), this did not translate into superior predictive models. The development of 360 predictive models for six clinical endpoints demonstrated that prediction accuracies were most strongly influenced by the nature of the endpoint itself. The technological platform (RNA-seq vs. microarrays) did not significantly affect model performance. This suggests that for well-defined predictive tasks based on known transcript biomarkers, microarrays remain a viable tool [12].
Experimental Design and Protocols
Sample Size Considerations for RNA-seq
Robust gene expression analysis requires adequate sample sizes to minimize false positives and maximize true discoveries. A large-scale 2025 murine study, which profiled organs from wild-type and heterozygous mice with a maximum sample size of N=30 per group, provided empirical guidance. The study demonstrated that experiments with N=4 or fewer samples are highly misleading due to high false positive rates and poor sensitivity. The results indicated that a minimum of 6-7 biological replicates per group is required to consistently decrease the false positive rate below 50% and achieve detection sensitivity above 50% for a 2-fold expression difference cutoff. The study strongly recommended a sample size of 8-12 for significantly better performance, noting that "more is always better" for both metrics [14].
Table 2: Key Reagents and Platforms for Transcriptomic Profiling
| Category | Item | Function/Description | Example Products/Brands |
|---|---|---|---|
| RNA Isolation | Total RNA Kit | Purifies high-quality, intact RNA from biological samples. | PAXgene Blood RNA Kit [11], RNeasy Plus Mini Kit [15] |
| Sample Quality Control | Bioanalyzer | Assesses RNA Integrity Number (RIN) to ensure sample quality. | Agilent 2100 Bioanalyzer [3] [15] |
| Microarray Platform | Oligonucleotide Array | Contains pre-defined probes for hybridization-based expression profiling. | GeneChip Human Genome U133 Plus 2.0 Array [11], Agilent 44k/PrimeView Arrays [3] [12] |
| RNA-seq Library Prep | Stranded mRNA Kit | Prepares sequencing libraries from RNA, including poly-A selection and adapter ligation. | Illumina Stranded mRNA Prep [3], NEBNext Ultra II RNA Library Prep Kit [11] |
| Sequencing Platform | NGS Sequencer | Performs high-throughput sequencing of cDNA libraries. | Illumina HiSeq [11] [15] |
| Data Analysis | Bioinformatics Tools | For processing, normalizing, and analyzing raw data (e.g., CEL files, FASTQ files). | Affymetrix TAC Software [3], R/Bioconductor (e.g., DESeq2) [13] [15], Trimmonatic, FASTQC [11] [15] |
RNA-seq Data Analysis Pipeline
The analysis of RNA-seq data is complex, with multiple algorithmic options at each step that can influence results. A comprehensive 2020 study systematically evaluated 192 alternative pipelines. The following diagram outlines a generalized, robust RNA-seq workflow based on its findings, highlighting key steps where methodological choices are critical [15].
The choice between microarray and RNA-seq is not a simple matter of one technology being universally "better" than the other. Instead, the decision should be guided by the specific research goals, budget, and bioinformatics capacity.
Choose RNA-seq when the research aims require unbiased discovery, such as identifying novel transcripts, splice variants, gene fusions, or non-coding RNAs. It is also the preferred technology for profiling organisms without a well-annotated genome, for projects requiring the widest possible dynamic range and sensitivity for low-abundance transcripts, and when digital counting and low background are priorities [4] [12].
Microarrays remain a viable and pragmatic choice for well-defined applications where the goal is to profile the expression of known genes in a high-throughput, cost-effective manner. This includes large-scale studies focused on validated gene signatures, clinical endpoint prediction where models have already been established, and targeted toxicogenomics applications like concentration-response modeling, where it has been shown to perform equivalently to RNA-seq for deriving points of departure [3] [12].
For many research programs, a complementary approach is highly effective. Microarrays can be used for initial large-scale screening due to their lower cost and simpler data analysis, while RNA-seq can be employed for deeper investigation and discovery on select samples. As the cost of sequencing continues to decline, RNA-seq is undoubtedly the future of transcriptomics. However, the vast repositories of high-quality legacy microarray data and its continued utility for targeted applications ensure its relevance for the foreseeable future [11] [13].
A critical challenge in modern genomics is the accurate characterization of the complete transcriptome. For years, microarray technology was the standard for gene expression profiling, but its dependence on predefined probes fundamentally limited its discovery potential. The advent of RNA sequencing (RNA-seq) has revolutionized the field, offering an unbiased method that dramatically enhances the ability to detect novel transcripts and genetic variants. This guide objectively compares the performance of these two technologies, providing supporting experimental data to underscore RNA-seq's superior discovery power.
Experimental Evidence and Performance Comparison
The superior discovery power of RNA-seq is not merely theoretical; it is consistently demonstrated in direct, head-to-head comparative studies and in applications requiring deep transcriptome characterization.
Quantitative Comparison: RNA-seq vs. Microarray
The following table summarizes key performance metrics from recent studies, highlighting the distinct advantages of RNA-seq.
| Performance Metric | Microarray | RNA-seq (Short-Read) | Long-Read RNA-seq (lrRNA-seq) |
|---|---|---|---|
| Novel Transcript Detection | Limited to pre-designed probes; cannot discover novel transcripts [4]. | Can identify novel transcripts, splice junctions, and gene fusions [16] [4]. | Excellent; ideal for discovering full-length isoforms and complex splice variants [17] [18] [19]. |
| Dynamic Range | Limited (~10³), constrained by background noise and signal saturation [4]. | Wide (>10⁵), due to digital counting of reads [4]. | Wide; effective for quantifying transcript abundance across a broad range [18]. |
| Variant Detection | Cannot detect sequence-level variants (SNVs, indels) [4]. | Can detect single nucleotide variants (SNVs) and insertions/deletions (indels) [16] [4]. | Excellent for detecting expressed mutations and linking them to specific transcript isoforms [16] [19]. |
| Data from Recent Studies | In a 2025 toxicogenomic study, microarrays identified fewer DEGs with a narrower dynamic range compared to RNA-seq [3]. | A 2025 multi-center study highlighted RNA-seq's utility for clinical diagnostics, though it also noted inter-laboratory variations [7]. | A 2024 benchmark study found lrRNA-seq effectively reconstructs full-length transcripts, with longer, more accurate reads improving detection [18]. A 2025 study identified ~47,000 novel isoforms in human blood [17]. |
Case Studies in Discovery
Revealing the "Dark Transcriptome": A 2025 study using long-read RNA-seq on human whole blood from healthy individuals identified an average of about 46,000 genes and 185,000 isoforms using the GRCh38 reference genome. Strikingly, approximately 90,000 of these isoforms (47%) were novel, previously unannotated transcripts. This study underscores lrRNA-seq's power to expand our map of the human transcriptome, a feat impossible with microarray technology [17].
Uncovering Transcript-Specific Regulation in Neurons: Research employing nanopore long-read sequencing in human-derived cortical neurons, induced pluripotent stem cells, and fibroblasts uncovered extensive transcript diversity, with over 15,000 transcripts identified in neurons. The analysis revealed 35,519 differential transcript expression events and 5,135 differential transcript usage events across cell types. This detailed view exposed transcript-specific changes in disease-relevant genes like APP (Alzheimer's disease) and KIF2A (neuronal migration disorders), which are obscured in traditional gene-level expression analyses [19].
Bridging the DNA-Protein Divide in Oncology: Targeted RNA-seq has proven its clinical utility by identifying expressed mutations that are missed or unverified by DNA sequencing alone. In one study, RNA-seq provided functional evidence that allowed for the reclassification of variants found by exome and genome sequencing in a significant number of cases. It uniquely identified variants with high pathological relevance, demonstrating its power to uncover clinically actionable mutations that DNA-based methods may suggest but cannot confirm are expressed [16] [20].
Detailed Experimental Protocols
To ensure the reproducibility of the powerful results cited above, here are the detailed methodologies from key studies.
Protocol 1: Long-Read RNA-seq for Novel Isoform Discovery in Whole Blood
This protocol is adapted from a 2025 study that identified thousands of novel isoforms in human blood [17].
- 1. RNA Extraction: Collect peripheral whole blood in PAXgene Blood RNA Tubes. Extract total RNA using the PAXgene Blood RNA Kit.
- 2. RNA Quality Control: Assess RNA integrity using an Agilent Bioanalyzer with the RNA 6000 Nano Kit. Confirm RNA Integrity Number (RIN) ≥7 before proceeding.
- 3. cDNA Synthesis & Amplification: Synthesize and amplify cDNA from total RNA using the Iso-Seq Express 2.0 kit (PacBio).
- 4. SMRTbell Library Preparation: Ligate SMRTbell adapters to the 5' and 3' ends of the prepared cDNA using the SMRTbell prep kit 3.0 (PacBio).
- 5. Sequencing: Sequence the cDNA libraries on a PacBio Sequel IIe system.
- 6. Bioinformatics Analysis:
- Alignment: Map raw PacBio reads to a reference genome (e.g., GRCh38 or T2T-CHM13) using the
pbmm2aligner. - Isoform Identification: Process aligned data with the
Isoseqbioinformatics suite to identify and classify full-length isoforms. - QC and Annotation: Use tools like
SQANTI3for quality control and annotate isoforms against a reference transcriptome (e.g., from UCSC Genome Browser).
- Alignment: Map raw PacBio reads to a reference genome (e.g., GRCh38 or T2T-CHM13) using the
Protocol 2: Targeted RNA-seq for Expressed Mutation Detection
This protocol is based on a 2025 study that used targeted RNA-seq to complement DNA-based cancer mutation panels [16].
- 1. RNA Library Preparation: Prepare sequencing libraries from total RNA using targeted RNA-seq panels (e.g., Agilent Clear-seq or Roche Comprehensive Cancer panels). These panels are designed with probes to enrich for genes of interest and often include exon-exon junction spanning probes.
- 2. Sequencing: Perform high-depth sequencing on the enriched libraries using a next-generation sequencing platform (e.g., Illumina).
- 3. Bioinformatics Analysis for Variant Calling:
- Alignment: Map sequencing reads to the human reference genome.
- Variant Calling: Utilize multiple callers (e.g., VarDict, Mutect2, LoFreq) in a consolidated pipeline to maximize sensitivity.
- Filtering: Apply stringent filters based on variant allele frequency (VAF ≥2%), total read depth (DP ≥20), and alternative allele depth (ADP ≥2) to control the false positive rate.
Workflow and Relationship Visualization
The following diagram illustrates the foundational workflow of RNA-seq and the key technological differences that underpin its superior discovery power compared to microarrays.
The Scientist's Toolkit: Essential Research Reagents and Materials
Successful transcriptome discovery relies on a suite of specialized reagents and computational tools. The table below lists key solutions used in the featured experiments.
| Item Name | Function/Benefit | Example Use Case |
|---|---|---|
| PacBio Iso-Seq Express 2.0 Kit | Enables synthesis of high-quality cDNA for long-read sequencing, facilitating full-length transcript capture. | Generating sequencing-ready SMRTbell libraries from blood RNA for novel isoform discovery [17]. |
| Oxford Nanopore Technology | Provides a platform for direct RNA and cDNA sequencing, producing very long reads that span entire transcripts. | Profiling transcriptomes of cortical neurons to analyze differential transcript usage [19]. |
| Targeted RNA-seq Panels | Probe sets designed to enrich for specific genes/transcripts of interest, allowing for deeper coverage and more sensitive variant detection. | Complementing DNA-seq results in cancer samples to identify and validate expressed mutations [16]. |
| ERCC RNA Spike-In Controls | A set of synthetic RNA molecules at known concentrations used to assess technical performance, accuracy, and dynamic range of the RNA-seq assay. | Serving as built-in truth for benchmarking in multi-center RNA-seq studies [7]. |
| SQANTI3 | A comprehensive computational tool for the quality control, classification, and annotation of long-read transcripts. | Classifying and filtering identified isoforms as known or novel after long-read sequencing [17]. |
The collective evidence firmly establishes that RNA-seq, particularly long-read sequencing, offers a transformative advantage over microarrays for the discovery of novel transcripts and variants. Its unbiased nature, wider dynamic range, and single-base resolution make it an indispensable tool for advancing genomic research and precision medicine.
For researchers aiming to maximize discovery power, the following best practices are recommended:
- Prioritize Long-Read Sequencing for projects where the primary goal is the discovery of novel isoforms, the resolution of complex splice variants, or the accurate quantification of transcript usage [18] [19].
- Utilize Targeted RNA-seq Panels in a clinical or diagnostic setting to achieve high sensitivity for detecting expressed mutations in specific genes of interest, thereby bridging the gap between DNA findings and protein function [16].
- Incorporate Spike-In Controls and use standardized reference materials, such as those from the Quartet project, to ensure technical accuracy and enable meaningful cross-laboratory comparisons, especially when detecting subtle differential expression [7].
- Leverage Specialized Bioinformatics Pipelines that are tailored for the specific sequencing technology and analytical goal, as the choice of alignment, quantification, and differential expression tools significantly impacts results [7] [21].
In the evolving landscape of transcriptomics, next-generation RNA sequencing (RNA-seq) has emerged as a powerful tool with unprecedented discovery power. Yet, within this context of technological advancement, microarray technology maintains distinct advantages in specific, well-defined research scenarios. The established strength of microarray standardization, coupled with its cost-effectiveness and robust analytical frameworks, makes it a compelling choice for applications where detecting predefined transcripts is sufficient and operational efficiency is paramount. This guide objectively examines the performance characteristics of both platforms, providing researchers with data-driven insights to inform their experimental design.
Key Strengths of Microarray Technology
Proven Standardization and Analytical Maturity
Microarray technology benefits from decades of development, resulting in a highly standardized ecosystem.
- Established Standards: Initiatives like the Microarray Gene Expression Data Society (MGED) have produced consensus standards for data reporting (MIAME), analysis, and interpretation, ensuring reproducibility across laboratories [22].
- Mature Bioinformatics: Data processing pipelines, such as the Robust Multi-array Average (RMA) algorithm, are well-established and widely validated, reducing analytical variability [3] [23].
- Regulatory Familiarity: The long-standing use of microarrays has fostered comfort with the technology in regulatory contexts for risk assessment of chemicals and pharmaceuticals [3].
Cost-Effectiveness and Operational Efficiency
For large-scale studies with constrained budgets, microarrays offer significant practical advantages.
- Lower Sequencing Costs: The per-sample cost of microarrays is generally lower than that of RNA-seq, making them suitable for high-throughput screening applications [3].
- Reduced Data Storage and Computational Demands: Microarray data files are substantially smaller and require less computational power for processing and analysis compared to the vast datasets generated by RNA-seq [3] [12].
Equivalent Performance in Targeted Applications
Contrary to common assumption, microarrays can perform on par with RNA-seq for specific, targeted research goals.
- Clinical Endpoint Prediction: A landmark study on 498 neuroblastoma samples found that predictive models for clinical outcomes performed similarly regardless of whether they were based on microarray or RNA-seq data. The nature of the clinical endpoint itself was a far more significant factor than the technology platform [24] [12].
- Pathway Analysis in Toxicogenomics: Research on cannabinoids demonstrated that while RNA-seq identified more differentially expressed genes, functional pathway analysis through Gene Set Enrichment Analysis (GSEA) yielded equivalent biological insights from both platforms [3].
- Concentration-Response Modeling: In quantitative toxicogenomics, transcriptomic point of departure (tPoD) values derived from microarray and RNA-seq data were comparable, affirming microarray's utility for benchmark concentration (BMC) modeling [3].
Head-to-Head Technology Comparison
Table 1: Comparative Analysis of Microarray and RNA-Seq Technologies
| Feature | Microarray | RNA-Seq |
|---|---|---|
| Fundamental Principle | Hybridization-based with predefined probes [10] | Sequencing-based with direct cDNA sequencing [10] |
| Prior Sequence Knowledge Required | Yes [4] [10] | No [4] [10] |
| Dynamic Range | ~10³ [4] | >10⁵ [4] |
| Ability to Detect Novel Transcripts | No [4] | Yes (e.g., novel genes, isoforms, fusions) [4] [12] |
| Sensitivity for Low-Abundance Transcripts | Limited by background noise and saturation [4] [23] | High; can be improved by increasing sequencing depth [4] [23] |
| Typical Cost per Sample | Lower [3] | Higher |
| Data Output & Complexity | Smaller data size, simpler analysis [3] | Large, complex data requiring substantial storage and computing [3] |
| Standardization & Established Workflows | High; well-established standards and pipelines [3] [22] | Evolving standards and methodologies [22] |
Table 2: Experimental Evidence from Direct Comparative Studies
| Study Context | Key Finding on Microarray Performance | Citation |
|---|---|---|
| Clinical Endpoint Prediction (Neuroblastoma) | Microarray-based classifiers performed similarly to RNA-seq-based models for predicting patient outcomes. | [24] [12] |
| Toxicogenomics (Cannabinoids) | Transcriptomic points of departure (tPoD) and enriched pathways were equivalent to those identified by RNA-seq. | [3] |
| Ligament Tissue Transcriptomics | Showed high internal reproducibility (r=0.97); cross-platform concordance with RNA-seq was moderate (r=0.64). | [23] |
| Asthma Biomarker Development | While the study developed an RNA-seq risk score, it noted the historical use and validation context of microarrays. | [25] |
Methodological Spotlight: Concentration-Response Modeling
The following workflow, derived from a toxicogenomics study, illustrates a key area where microarray standardization delivers robust results [3].
Diagram 1: Microarray concentration-response workflow.
Detailed Experimental Protocol
This protocol is adapted from a 2025 comparative study of cannabichromene and cannabinol [3].
Cell Culture & Exposure:
- Culture iPS-derived hepatocytes (e.g., iCell Hepatocytes 2.0) in a collagen-coated 24-well plate using a specialized plating and maintenance medium.
- On culture day 6, expose cells to varying concentrations of the test compound (e.g., cannabinoids diluted in DMSO). Include a vehicle control (0.5% DMSO). Incubate for 24 hours at 37°C and 5% CO₂.
RNA Sample Preparation:
- Lyse cells in a denaturing guanidinium-thiocyanate-containing buffer (e.g., RLT buffer) supplemented with β-mercaptoethanol.
- Homogenize lysates and purify total RNA using automated systems (e.g., EZ1 Advanced XL) with integrated DNase digestion to remove genomic DNA.
- Assess RNA concentration and purity (Nanodrop) and RNA integrity (RIN) using an Agilent 2100 Bioanalyzer.
Microarray Processing (Affymetrix Platform):
- Starting with 100 ng of total RNA, generate double-stranded cDNA using a T7-linked oligo(dT) primer.
- Perform in vitro transcription (IVT) with biotinylated nucleotides to produce labeled complementary RNA (cRNA).
- Fragment the cRNA and hybridize to the microarray chip (e.g., GeneChip PrimeView Human Array) for 16 hours.
- Wash and stain the array on a fluidics station and scan it to generate image (DAT) files.
- Convert image files to cell intensity (CEL) files using the manufacturer's software (e.g., Affymetrix Command Console).
Data Analysis & BMC Modeling:
- Import CEL files into an analysis console (e.g., Affymetrix Transcriptome Analysis Console).
- Perform background adjustment, quantile normalization, and summarization using the RMA algorithm.
- Identify differentially expressed genes (DEGs) with a fold-change threshold and false-discovery rate (FDR) adjustment.
- Fit the expression data of significant DEGs to a concentration-response curve to calculate the Benchmark Concentration (BMC).
- The transcriptomic Point of Departure (tPoD) is defined as the lowest BMC among the significant DEGs.
The Scientist's Toolkit: Essential Research Reagents
Table 3: Key Reagent Solutions for Microarray Experiments
| Reagent / Kit | Function in Workflow |
|---|---|
| TRIzol / RLT Buffer | Cell lysis and initial RNA stabilization [3] [23]. |
| DNase I Digestion Kit | Removal of contaminating genomic DNA during RNA purification [3]. |
| 3' IVT PLUS Reagent Kit | For cDNA synthesis, in vitro transcription, and biotin-labeling of target RNA [3]. |
| GeneChip Hybridization Kit | Contains buffers and controls for hybridizing labeled cRNA to the microarray [3]. |
| Fluidics Station & Scanner | Automated washing, staining, and imaging of the processed microarray chip [3] [22]. |
Microarray technology, with its proven standardization, cost-effectiveness, and analytical maturity, retains a vital role in the transcriptomics toolkit. For applications focused on targeted gene expression profiling, clinical prediction where models are established, and large-scale toxicogenomic screening, it provides a reliable and efficient solution. The choice between microarray and RNA-seq should be guided not by technological trend alone, but by a clear alignment between the platform's strengths and the specific biological questions and operational constraints of the research project.
While RNA sequencing (RNA-seq) has emerged as the dominant platform for novel transcriptome profiling, offering a wider dynamic range and detection of novel features, microarrays remain a powerful, cost-effective tool for many applications. The choice between them is no longer a simple question of which is "better," but rather which is more fit-for-purpose based on specific research goals, budget, and analytical requirements. Recent evidence shows that for established applications like toxicogenomic pathway analysis and clinical endpoint prediction, both platforms can yield highly concordant biological conclusions [3] [12].
Platform Performance: A Quantitative Comparison
The table below summarizes a direct comparison of key performance metrics based on recent, head-to-head experimental studies.
Table 1: Experimental Comparison of Microarray and RNA-Seq Performance
| Performance Metric | Microarray | RNA-Seq | Supporting Evidence |
|---|---|---|---|
| Dynamic Range | Limited by background and saturation [26] | Wider, precise for low and high abundance transcripts [26] | Toxicogenomic study in rat liver [26] |
| Protein-Coding DEGs Detected | Baseline | 1.5 to 5.6 times more DEGs identified [26] [13] | Study on human whole blood (223 vs. 2395 DEGs) [13] |
| Non-Coding RNA Detection | Limited to predefined probes | Comprehensive (lncRNA, miRNA, pseudogenes) [3] [26] | Cannabinoid toxicogenomics study [3] |
| Transcript/Splice Variant Resolution | No | Yes, enables detection of discordant transcript variants [12] | Neuroblastoma clinical endpoint prediction study [12] |
| Concordance in Pathway Analysis | High functional concordance despite differences in raw DEG lists [3] [26] | High functional concordance despite differences in raw DEG lists [3] [26] | Both platforms enriched similar liver toxicity pathways [26] |
| Performance in Clinical Prediction | Equivalent to RNA-seq for endpoint prediction [12] | Equivalent to microarray for endpoint prediction [12] | 360 models across 6 clinical endpoints in neuroblastoma [12] |
Experimental Protocols for Platform Comparison
To ensure valid and reproducible comparisons between platforms, a rigorous experimental methodology is required. The following protocol, derived from recent literature, outlines the key steps.
Core Principle
The most robust comparisons are performed by analyzing the same RNA samples on both platforms in parallel, minimizing biological variability and allowing direct assessment of technological differences [3] [26].
Detailed Workflow
Diagram 1: Experimental comparison workflow. RMA: Robust Multi-array Average; IVT: In Vitro Transcription; GSEA: Gene Set Enrichment Analysis; IPA: Ingenuity Pathway Analysis.
Key Methodological Considerations
- RNA Quality: Use high-quality total RNA (RNA Integrity Number, RIN ≥ 9) for both platforms [26].
- Library Preparation: For RNA-seq, use stranded, poly-A-enriched library kits (e.g., Illumina Stranded mRNA Prep) to enable direct comparison with microarray data focused on coding mRNA [3] [26].
- Data Transformation for Comparability: To directly integrate or compare data from both platforms, transform high-dimensional gene-level data into gene set enrichment scores (e.g., using single-sample GSEA). This filters out platform-specific noise and increases the biological concordance of the results [27].
Enhancing Cross-Platform Comparability
A significant challenge in the field is the direct integration of data from legacy microarray studies with modern RNA-seq datasets. Research has shown that transforming gene-level data into pathway-level scores significantly improves correlation.
Diagram 2: Cross-platform analysis via enrichment scores. ssGSEA: single-sample Gene Set Enrichment Analysis.
The Scientist's Toolkit: Essential Research Reagents and Materials
Successful transcriptomic profiling, regardless of platform, relies on a foundation of high-quality reagents and well-established protocols.
Table 2: Key Research Reagent Solutions for Transcriptomics
| Reagent / Material | Function / Description | Example Products / Kits |
|---|---|---|
| Total RNA Isolation Kit | Purifies intact RNA from cells or tissue; critical first step for both platforms. | QIAGEN RNeasy Plus kits, PAXgene Blood RNA Kit [3] [13] |
| Globin mRNA Depletion Reagents | Reduces high abundance of globin transcripts in whole blood RNA, improving detection of other mRNAs. | GLOBINclear Kit [13] |
| Microarray Target Prep Kit | Converts RNA into fluorescently labeled cDNA for hybridization. | GeneChip 3' IVT Plus Reagent Kit [3] [13] |
| RNA-seq Library Prep Kit | Converts RNA into a sequencing-ready library of cDNA fragments with adapters. | Illumina Stranded mRNA Prep, TruSeq Stranded mRNA Kit, NEBNext Ultra II [3] [26] [13] |
| Reference Genome & Annotation | Essential for RNA-seq read alignment and quantification. | ENSEMBL, UCSC Genome Browser, GENCODE [28] [29] |
| Enrichment Analysis Software | For functional interpretation of gene lists and cross-platform data transformation. | Qiagen IPA, GSEA [26] [27] [13] |
Statistical Analysis and Sample Size Considerations
The statistical pipeline for RNA-seq data is well-established, with tools like DESeq2 and limma-voom being standards for differential expression analysis [29] [30]. A critical consideration for robust RNA-seq studies is sample size.
- Underpowered studies (N < 5) yield highly misleading results with high false positive rates and poor sensitivity [14].
- Minimum sample size should be 6-7 biological replicates per group to achieve a false positive rate below 50% and sensitivity above 50% for a 2-fold change cutoff [14].
- Adequate sample size of 8-12 replicates per group significantly improves the recapitulation of true biological effects and is strongly recommended [14].
The evolving landscape of transcriptomics is not a simple story of one technology replacing another. RNA-seq is the undisputed leader for discovery-phase research, offering an unparalleled view of the transcriptome's complexity. However, microarrays maintain their relevance due to lower cost, smaller data sizes, and extensive curated public databases. The trend in platform adoption is increasingly guided by the research question: use RNA-seq for discovery and microarrays for focused, high-throughput applications. Furthermore, methods like gene set enrichment scoring are breaking down barriers between platforms, allowing the vast legacy of microarray data to be leveraged alongside modern RNA-seq datasets, ensuring that valuable biological information remains relevant in the sequencing era.
From Sample to Insight: Practical Workflows and Research Applications
The evolution of transcriptomic technologies has fundamentally transformed biological research and drug discovery. For over a decade, whole-genome microarrays served as the primary platform for transcriptome-wide gene expression profiling, utilizing a hybridization-based approach to measure fluorescence intensity of predefined transcripts [3]. While microarrays offer advantages in relatively simple sample preparation, lower per-sample costs, and well-established data processing methodologies, they suffer from limitations including a restricted dynamic range, high background noise, and an inability to detect novel transcripts such as splice variants and non-coding RNAs [3]. The mid-2000s witnessed the emergence of next-generation RNA sequencing (RNA-seq) as a powerful alternative based on counting reads that can be reliably aligned to a reference sequence. This fundamental shift provides virtually unlimited dynamic range and enables discovery of previously undetectable transcripts [3] [31].
Despite its gradual adoption as the mainstream transcriptomic platform, RNA-seq analysis presents substantial challenges for researchers. The process involves multiple intricate steps, each requiring specific tools and parameters, with the added complexity of species-specific considerations that impact tool performance [32]. For researchers lacking extensive bioinformatics backgrounds, constructing an optimal analysis workflow from the array of available tools represents a significant hurdle [32]. This deconstruction of the RNA-seq workflow aims to provide clarity and guidance for navigating these critical decisions, with particular emphasis on how these choices impact the reliability and interpretability of results in both basic research and drug development contexts.
Workflow Breakdown: Tools, Comparisons, and Methodologies
A typical RNA-seq analysis pipeline progresses through three primary phases: primary analysis (processing raw sequencing data), secondary analysis (aligning and quantifying pre-processed reads), and tertiary analysis (extracting biologically relevant information) [33]. The following sections deconstruct the critical steps of this workflow, comparing popular tools and providing experimental protocols.
Primary Analysis: From Raw Sequences to Processed Reads
The initial processing of raw sequencing data includes quality control, demultiplexing, adapter trimming, and quality filtering. This primary analysis phase is crucial, as the quality of output directly impacts all subsequent results.
Base calling and demultiplexing begin the pipeline. Sequencing instruments generate raw data in binary base call (BCL) format, which is converted to FASTQ files—the standard format for storing unaligned NGS reads containing both sequence and quality score information [33]. For multiplexed samples sequenced together, demultiplexing sorts reads into individual files based on their unique index (barcode) sequences. Tools for this step include Illumina's proprietary bcl2fastq and Lexogen's iDemux, with dual index sequencing providing the best opportunity for error correction and data salvage [33].
Read trimming follows demultiplexing, removing undesirable adapter contamination, poly(A) tails, poly(G) sequences (common in Illumina sequencers with 2-channel chemistry), and poor-quality sequences. Failure to remove these artifacts reduces alignment rates and increases false alignments [33]. Popular trimming tools include Cutadapt and Trimmomatic [33], with fastp and Trim_Galore also being widely used options [32].
Table 1: Comparison of Primary Analysis Tools
| Tool | Primary Function | Key Features | Performance Notes |
|---|---|---|---|
| fastp [32] | Filtering & Trimming | Rapid analysis; simple operation; integrated quality control | Significantly enhances processed data quality [32] |
| Trim_Galore [32] | Filtering & Trimming | Integrates Cutadapt & FastQC; comprehensive QC in single step | May cause unbalanced base distribution in tail [32] |
| Cutadapt [33] | Read Trimming | Effective adapter removal | Often used through Trim_Galore wrapper |
| Trimmomatic [33] | Read Trimming | Highly customizable parameters | Complex parameter setup; no speed advantage [32] |
| iDemux [33] | Demultiplexing | Handles i7, i5, and i1 indices; sophisticated error correction | Maximizes data output by rescuing reads with index errors |
Quality control assessment uses tools like FastQC for initial quality checks on raw sequence data, with MultiQC providing consolidated reports across multiple samples [34]. Key metrics include the Q30 score (percentage of bases with quality score ≥30, indicating 99.9% base-calling accuracy), cluster density, and percentage of reads passing filter [33]. The decision to trim reads is based on these QC results, considering factors like poor-quality bases, adapter contamination, and unbalanced base composition [34].
Secondary Analysis: Alignment and Quantification
Secondary analysis involves aligning processed reads to a reference genome and summarizing them into quantitative expression values.
Read alignment requires specialized, splice-aware algorithms because RNA-seq reads originate from spliced mRNA transcripts. Generic DNA aligners like BWA or Bowtie2 are unsuitable as they cannot handle reads spanning exon-intron junctions [34]. The alignment process matches reads to specific genomic regions, with the percentage of successfully and uniquely aligned reads serving as a key quality metric [31].
Table 2: Comparison of Splice-Aware Alignment Tools
| Tool | Algorithm Type | Key Features | Considerations |
|---|---|---|---|
| STAR [31] [5] | Spliced Transcripts Alignment to Reference | Fast, accurate splice junction discovery; handles large volumes of data | High memory requirements |
| HISAT2 [34] | Hierarchical Indexing | Successor to TopHat2; fast with low memory requirements | Standard choice for many RNA-seq pipelines |
| TopHat2 [31] | Spliced Read Mapper | Previously popular; uses Bowtie for alignment | Largely superseded by newer tools |
Alignment experimental protocol typically begins with building a genome index, followed by mapping read pairs to the indexed genome. For example, with HISAT2, the commands would be [34]:
The alignment output is typically in Sequence Alignment/Map (SAM) or its binary equivalent (BAM) format [31].
Read summarization counts the mapped reads corresponding to known genes, exons, or transcripts, producing a count matrix that serves as input for differential expression analysis [31]. This step requires an annotation file (GTF or GFF) linking reads to genomic features. The four most common annotation databases are RefSeq, UCSC, Ensembl, and GENCODE [31].
Table 3: Comparison of Read Quantification Tools
| Tool | Counting Approach | Key Features | Output |
|---|---|---|---|
| featureCounts [31] | Gene-level or exon-level | Fast; low memory requirements; part of Subread package | Count matrix (genes × samples) |
| HTSeq-count [31] | Gene-level | Flexible counting modes; well-established | Count matrix (genes × samples) |
The quantification command with featureCounts might appear as:
Tertiary Analysis: Differential Expression and Functional Interpretation
The final phase focuses on extracting biological meaning from quantitative expression data, with differential expression (DE) analysis as its cornerstone.
Differential expression analysis identifies genes whose expression patterns significantly differ across experimental conditions or phenotypes. Unlike microarray data analysis, which often uses t-tests or similar parametric tests, RNA-seq count data requires specialized statistical methods that account for its discrete nature and inherent technical variability [31]. Common normalization approaches include Reads Per Kilobase Million (RPKM), Fragments Per Kilobase Million (FPKM), Counts Per Million (CPM), and Transcripts Per Kilobase Million (TPM), which adjust for gene length and sequencing depth variations [31].
Experimental protocol for DE analysis typically utilizes tools like DESeq2, which employs a negative binomial distribution to model count data and estimate dispersion. A basic DESeq2 analysis in R would follow this structure [34]:
Functional enrichment analysis follows DE analysis, interpreting the biological significance of differentially expressed genes through Gene Ontology (GO) term analysis, Kyoto Encyclopedia of Genes and Genomes (KEGG) pathway mapping, or other gene set enrichment methods [31] [33]. This step translates gene lists into actionable biological insights about affected pathways, functions, and processes.
Critical Considerations in Experimental Design
The Critical Role of Sample Size
Appropriate sample size determination is arguably the most crucial consideration in RNA-seq experimental design. Underpowered studies with too few replicates yield unreliable results characterized by excessive false positives, false negatives, and inflated effect sizes—a major factor driving irreproducibility in scientific literature [14].
A comprehensive 2025 study examining murine RNA-seq experiments provided empirical evidence for sample size requirements. Using large cohorts (N=30) of wild-type and genetically modified mice as gold standards, researchers systematically evaluated how results from smaller sample sizes recapitulated full datasets [14]. The findings demonstrated that experiments with N=4 or fewer replicates were "highly misleading," with false discovery rates (FDR) exceeding 38% for N=3 in some tissues [14].
Table 4: Sample Size Recommendations from Empirical Data [14]
| Sample Size (N) | False Discovery Rate | Sensitivity | Recommendation |
|---|---|---|---|
| N ≤ 4 | Very High (>38%) | Very Low | Highly misleading; insufficient for reliable results |
| N = 5 | High | Low | Fails to recapitulate full signature |
| N = 6-7 | <50% | >50% | Minimum for 2-fold expression differences |
| N = 8-12 | Significantly Lower | Significantly Higher | Significantly better; recommended range |
| N > 12 | Approaches 0% | Approaches 100% | Diminishing returns; ideal but resource-intensive |
The study further demonstrated that simply raising the fold-change threshold cannot compensate for inadequate sample sizes, as this strategy results in consistently inflated effect sizes and substantially reduced detection sensitivity [14]. Researchers should aim for a minimum of 6-7 biological replicates per condition, with 8-12 replicates providing significantly more reliable results [14].
Bulk RNA-seq vs. Microarray: An Updated Comparison
While RNA-seq has largely superseded microarrays in many applications, recent evidence suggests microarrays remain viable for specific use cases. A 2024 comparative study of cannabinoid effects using both platforms revealed that despite RNA-seq identifying larger numbers of differentially expressed genes with wider dynamic ranges, both platforms displayed equivalent performance in identifying impacted functions and pathways through gene set enrichment analysis [3].
Furthermore, transcriptomic point of departure (tPoD) values derived through benchmark concentration (BMC) modeling were nearly identical between platforms [3]. Considering the relatively low cost, smaller data size, and better availability of software and public databases for analysis, microarray technology may still be appropriate for traditional transcriptomic applications like mechanistic pathway identification and concentration-response modeling [3].
Applications in Drug Discovery and Development
RNA-seq has become indispensable throughout the drug discovery and development pipeline, contributing significantly to multiple stages from target identification to clinical application.
In target discovery and selection, RNA-seq helps uncover genes and pathways playing important roles in disease mechanisms [35]. Once candidate drugs are identified, RNA-seq detects drug-induced genome-wide changes in gene expression, helping to elucidate mechanisms of action [35]. The technology also contributes to biomarker discovery, where transcriptomic profiles correlate with disease presence, progression, or severity, enabling early diagnosis and providing potential therapeutic targets [35].
Additional applications include identifying genes involved in drug resistance and sensitivity, assessing drug toxicity by monitoring changes in gene expression caused by drug exposure, and drug repurposing by screening for new therapeutic targets [35]. The emergence of time-resolved RNA-seq addresses a critical limitation of conventional approaches by enabling observations of RNA abundances over time, distinguishing between primary (direct) and secondary (indirect) drug effects [35].
The Scientist's Toolkit: Essential Research Reagents and Materials
Table 5: Essential Reagents and Materials for RNA-seq Experiments
| Item | Function/Purpose | Examples/Considerations |
|---|---|---|
| RNA Isolation Kits | Extract high-quality RNA from biological samples | Quality critical; assess with RIN (RNA Integrity Number) |
| Poly-A Selection Kits | Enrich for mRNA by binding poly-A tails | Standard for mRNA sequencing; excludes non-polyadenylated RNAs |
| Ribo-Depletion Kits | Remove ribosomal RNA | Alternative to poly-A selection; preserves non-coding RNAs |
| Stranded Library Prep Kits | Create sequencing libraries preserving strand information | Essential for determining transcript orientation |
| Unique Molecular Identifiers (UMIs) | Tag individual RNA molecules pre-amplification | Correct for PCR amplification bias; enable digital counting |
| Quality Control Instruments | Assess RNA and library quality | Bioanalyzer/Tapestation (RIN), Qubit (quantification) |
| Reference Genome | Map sequenced reads to genomic coordinates | Species-specific (e.g., GRCh38 for human, GRCm39 for mouse) |
| Annotation File (GTF/GFF) | Define genomic features for read summarization | Sources: Ensembl, GENCODE, RefSeq |
Visualizing the RNA-seq Workflow
The following diagram illustrates the complete RNA-seq analysis workflow, from raw data to biological interpretation, highlighting key decision points at each stage.
RNA-seq Analysis Workflow: This diagram outlines the primary steps in RNA-seq data analysis, from raw data processing to biological interpretation, highlighting essential tools and decision points.
The deconstruction of the RNA-seq workflow reveals a sophisticated analytical pipeline with critical decision points at each stage. Tool selection—from trimming and alignment algorithms to quantification and statistical analysis methods—significantly impacts results and their biological interpretation. The empirical evidence demonstrating the necessity of adequate sample sizes (N=8-12 replicates per condition) provides crucial guidance for experimental design, addressing the reproducibility crisis in transcriptomic literature [14]. While RNA-seq offers distinct advantages over microarrays in detection range and novel transcript discovery, microarray technology remains viable for specific applications like pathway analysis and concentration-response modeling [3].
For researchers in drug discovery and development, RNA-seq provides powerful capabilities throughout the pipeline, from target identification to mechanism elucidation and biomarker discovery. The implementation of robust, well-designed RNA-seq workflows, informed by the comparative data and methodologies presented here, will continue to drive advances in both basic biological understanding and therapeutic development.
Gene expression analysis is a cornerstone of modern molecular biology, enabling researchers to understand cellular processes, disease mechanisms, and drug responses. Among the technologies developed for this purpose, DNA microarrays represent a well-established and robust platform. This guide provides a detailed examination of the microarray workflow, focusing on its core steps of labeling, hybridization, and signal detection, while objectively comparing its performance with the increasingly popular RNA sequencing (RNA-seq) technology. Understanding the technical specifics and performance characteristics of microarrays is essential for researchers and drug development professionals to select the appropriate gene expression analysis tool for their specific applications.
Microarray Workflow: A Step-by-Step Breakdown
The microarray process involves a series of coordinated steps to convert RNA samples into quantifiable gene expression data.
Sample Labeling
The process begins with the extraction of total RNA from biological samples. In the most common fluorescent labeling approaches, RNA is reverse-transcribed into complementary DNA (cDNA) while incorporating labeled nucleotides or using labeled primers [3] [36].
Key Labeling Methods:
- Direct Incorporation: Fluorophore-conjugated nucleotides (e.g., Cy3 or Cy5) are directly incorporated during the reverse transcription reaction. This method is straightforward but can suffer from lower cDNA yields due to steric hindrance from the fluorescent moieties [36].
- Indirect (Aminoallyl) Method: Modified aminoallyl nucleotides are incorporated during cDNA synthesis and are later chemically coupled with the fluorescent dye. This two-step process provides higher dye incorporation and reduces dye bias, making it a benchmark for dual-labeling experiments [36].
- Direct Random-Primed Labeling: This one-step method uses 5'-labeled random nonamer primers during reverse transcription, followed by RNA template hydrolysis and cleanup. It offers a rapid, cost-effective alternative with excellent reproducibility, increasing the statistical confidence in identifying differentially expressed genes [36].
After labeling, the cDNA yield, dye incorporation (pmol of dye per μg of cDNA), and fragment size distribution are assessed to ensure quality before hybridization [36].
Hybridization
The fluorescently labeled cDNA is applied to the microarray slide, which contains thousands of predefined DNA probes immobilized in a grid-like pattern on a solid surface [37] [38]. These probes are short, synthetic sequences complementary to specific genes of interest.
Hybridization occurs under controlled conditions (temperature, salt concentration, and time) that promote specific binding between the labeled cDNA targets and their complementary probes on the array [37]. Stringent washing steps follow to remove any non-specifically bound cDNA, thereby reducing background noise and improving data accuracy [39] [40].
Signal Detection and Data Processing
After hybridization and washing, the microarray is scanned using a specialized fluorescence scanner [37]. This scanner measures the fluorescence intensity at each spot on the array, with the signal intensity corresponding to the abundance of that particular transcript in the original sample [38].
The resulting image file is then processed through several steps:
- Background Correction: Local background distortions are minimized by calculating the average background signal from a wider area around each spot, preserving the overall variability across the slide [39].
- Normalization: Scale factors are applied to correct for technical variations, such as differences in dye properties and hybridization efficiency across the slide. Methods like the "constant majority" assume most probes do not change in concentration and use local regression (e.g., LOWESS) to adjust for intensity- and spatial-dependent biases [39].
- Differential Expression Scoring: Statistical methods are applied to identify array elements that are significantly differentially hybridized between experimental conditions [39].
Performance Comparison: Microarray vs. RNA-Seq
While both microarrays and RNA-seq are powerful tools for gene expression profiling, they exhibit distinct technical and performance characteristics.
Technical and Analytical Comparison
Table 1: Key Characteristics of Microarray and RNA-Seq
| Aspect | Microarray | RNA-Seq |
|---|---|---|
| Technology Principle | Hybridization-based; fluorescence detection of predefined probes [38] | Sequencing-based; digital counting of sequenced reads [41] [38] |
| Coverage | Known transcripts only [38] | All transcripts, including novel genes, splice variants, and non-coding RNAs [38] |
| Dynamic Range | Narrower [3] [38] | Wide [3] [38] |
| Sensitivity | Moderate; lower for low-abundance transcripts [38] | High; capable of detecting rare transcripts [38] |
| Data Complexity | Lower; well-established, standardized analysis pipelines [3] [38] | Higher; requires more complex bioinformatics pipelines [38] |
| Cost per Sample | Lower [3] [38] | Higher [38] |
Experimental Data and Concordance
Recent studies have systematically compared the outputs of both platforms. A 2025 study on cannabinoids found that despite RNA-seq identifying larger numbers of differentially expressed genes (DEGs) with a wider dynamic range, both platforms revealed similar overall gene expression patterns and equivalent performance in identifying impacted functions and pathways through gene set enrichment analysis (GSEA) [3]. Furthermore, transcriptomic point of departure (tPoD) values derived from benchmark concentration (BMC) modeling were on the same level for both platforms [3].
Another study from 2025, analyzing samples from youth with and without HIV, found a high median Pearson correlation coefficient of 0.76 for gene expression profiles between the two platforms [41]. However, RNA-seq identified 2,395 DEGs compared to 427 by microarray, with 223 DEGs shared between them, representing 52.2% of microarray DEGs and 9.3% of RNA-seq DEGs [41]. This indicates significant concordance in the overlapping DEGs, but also highlights the broader detection capability of RNA-seq.
Table 2: Comparative Performance in Differential Gene Expression Analysis
| Performance Metric | Microarray | RNA-Seq | Study Context |
|---|---|---|---|
| Differentially Expressed Genes (DEGs) | 427 | 2,395 | HIV study [41] |
| Shared DEGs | 223 (52.2% of its total) | 223 (9.3% of its total) | HIV study [41] |
| Correlation of Expression Profiles | Median Pearson r = 0.76 with RNA-seq | Median Pearson r = 0.76 with microarray | HIV study [41] |
| Pathway Analysis | 47 perturbed pathways identified | 205 perturbed pathways identified | HIV study [41] |
| Transcriptomic Point of Departure (tPoD) | Equivalent levels for both platforms | Equivalent levels for both platforms | Cannabinoid toxicogenomics study [3] |
Essential Reagents and Tools for Microarray Experiment
A successful microarray experiment relies on a suite of specialized reagents and tools.
Table 3: Key Research Reagent Solutions for Microarray Workflow
| Item | Function | Example |
|---|---|---|
| Total RNA Extraction Kit | Isolates high-quality, intact RNA from biological samples. | PAXgene Blood RNA Kit [41], RNeasy Plus Mini Kit [15] |
| Globin Reduction Kit | Depletes abundant globin mRNA from blood samples to improve detection of other transcripts. | GLOBINclear Kit [41] |
| Labeling Kit | Converts RNA into fluorescently labeled cDNA for hybridization. | GeneChip 3' IVT Plus Reagent Kit [3], Direct Random-Primed Labeling reagents [36] |
| Microarray Chip | Solid support with immobilized DNA probes for specific transcript detection. | GeneChip PrimeView Human Gene Expression Array [3] |
| Hybridization System | Provides controlled conditions for specific probe-target binding. | GeneChip Hybridization Oven [3] |
| Fluidics Station | Automates the washing and staining steps post-hybridization. | GeneChip Fluidics Station [3] |
| Scanner | Detects fluorescence signals from hybridized arrays. | GeneChip Scanner [3] |
| Analysis Software | Processes raw image data, performs normalization, and identifies DEGs. | Affymetrix Transcriptome Analysis Console (TAC) [3], ExpressYourself [39] |
Workflow Visualization
The following diagram summarizes the core steps of the microarray workflow and how it compares to the RNA-seq process.
Microarray technology remains a viable and effective platform for gene expression analysis, particularly in contexts where the study focuses on well-annotated genomes, cost-effectiveness is a priority, and standardized, accessible data processing is desired [3] [38]. Its workflow—encompassing sample labeling, hybridization to predefined probes, and fluorescence-based signal detection—is well-established and robust. While RNA-seq offers a broader dynamic range, superior sensitivity, and the ability to discover novel transcripts, both platforms can produce highly concordant results in functional pathway analysis and concentration-response modeling [3] [41]. The choice between microarray and RNA-seq should therefore be guided by the specific research questions, genomic resources, and analytical capabilities at hand.
For decades, transcriptomics has been a cornerstone of molecular biology, with bulk RNA sequencing (RNA-seq) and microarray standing as the two primary technologies for gene expression analysis. While RNA-seq is often viewed as a successor, microarray technology remains a viable and robust platform for many applications. This guide provides an objective comparison of their performance, supported by experimental data, to help researchers align platform selection with their specific research objectives.
Bulk RNA-seq and microarray technologies operate on fundamentally different principles. Microarrays use a hybridization-based approach, where fluorescently-labeled nucleic acids bind to predefined probes on a chip, providing a relative measure of gene expression [3] [42]. In contrast, RNA-seq is a sequencing-based method that involves converting RNA into a cDNA library, followed by high-throughput sequencing and alignment of the resulting reads to a reference genome to enable digital counting of transcripts [3] [42].
The core strengths of each platform derive from their underlying methodologies:
Microarray
- Cost-Effectiveness: Lower per-sample cost, making it suitable for large-scale studies [3] [43].
- Established Analysis: Well-standardized, user-friendly software and public databases for data interpretation [3].
- Focused Data: Smaller, more manageable data sizes with a focus on known, annotated transcripts [3].
Bulk RNA-Seq
- Dynamic Range and Discovery: Unrestricted dynamic range and ability to detect novel transcripts, including splice variants, non-coding RNAs, and gene fusions [3] [42].
- Precision and Sensitivity: Higher precision and lower background noise compared to microarray [3].
- Multi-Faceted Data: Can reveal a wider range of genomic alterations, including mutations, indels, and alternative splicing, from a single assay [42].
Direct Experimental Comparison: A 2025 Case Study
A direct comparative study published in 2025 provides robust, quantitative data on the performance of both platforms in a toxicogenomic context. The research used two cannabinoids, cannabichromene (CBC) and cannabinol (CBN), as case studies in human iPSC-derived hepatocytes to assess their capabilities in concentration-response modeling and pathway analysis [3].
Experimental Protocol
- Cell Culture & Exposure: Commercial iPSC-derived hepatocytes (iCell Hepatocytes 2.0) were cultured and exposed to varying concentrations of CBC and CBN for 24 hours [3].
- RNA Sample Preparation: Total RNA was purified using an EZ1 Advanced XL automated instrument. RNA concentration, purity, and integrity (RIN) were rigorously checked [3].
- Microarray Data Generation: From 100 ng of total RNA, biotin-labeled cRNA was synthesized and hybridized onto GeneChip PrimeView Human Gene Expression Arrays. Arrays were scanned, and CEL files were processed using the Affymetrix Transcriptome Analysis Console (TAC) software (v4.0) with the RMA algorithm for normalization [3].
- RNA-seq Data Generation: Sequencing libraries were prepared from 100 ng of total RNA using the Illumina Stranded mRNA Prep, Ligation Kit. PolyA-tailed mRNAs were purified for library construction [3].
- Data Analysis: Both datasets were analyzed for differentially expressed genes (DEGs), followed by gene set enrichment analysis (GSEA). Benchmark concentration (BMC) modeling was performed to derive transcriptomic points of departure (tPoD) [3].
Table 1: Quantitative Performance Comparison from Cannabinoid Case Studies [3]
| Performance Metric | Microarray Findings | Bulk RNA-Seq Findings | Interpretation |
|---|---|---|---|
| Differentially Expressed Genes (DEGs) | Identified a robust but smaller set of DEGs. | Detected larger numbers of DEGs with a wider dynamic range. | RNA-seq has higher sensitivity and a broader detection range. |
| Functional Pathway Analysis (GSEA) | Effectively identified functions and pathways impacted by exposure. | Revealed equivalent performance in identifying impacted functions and pathways. | Key biological conclusions were consistent across platforms. |
| Transcriptomic Point of Departure (tPoD) | tPoD values for CBC and CBN were on specific levels. | Produced tPoD values that were on the same levels for both compounds. | Both platforms are equally effective for quantitative risk assessment. |
| Additional Capabilities | Limited to predefined, known transcripts. | Identified various non-coding RNA transcripts (e.g., miRNA, lncRNA). | RNA-seq is superior for discovery-based research. |
This experimental data demonstrates that while RNA-seq possesses superior technical capabilities, the two platforms can yield equivalent conclusions for traditional applications like pathway identification and concentration-response modeling [3].
The Scientist's Toolkit: Essential Research Reagent Solutions
The following table details key reagents and materials used in the featured comparative experiment, which can serve as a reference for designing similar studies [3].
Table 2: Key Research Reagents and Materials
| Item | Function/Description | Example Product/Brand |
|---|---|---|
| iPSC-derived Hepatocytes | Biologically relevant in vitro model for toxicology and drug metabolism studies. | iCell Hepatocytes 2.0 (FUJIFILM Cellular Dynamics) |
| RNA Purification Kit | Automated purification of high-quality total RNA, including DNase digestion step. | EZ1 RNA Cell Mini Kit (Qiagen) on EZ1 Advanced XL instrument |
| RNA Quality Control | Assessment of RNA Integrity Number (RIN) to ensure sample quality. | RNA 6000 Nano Reagent Kit on Agilent 2100 Bioanalyzer |
| Microarray Platform | Array for whole-genome expression profiling of known human transcripts. | GeneChip PrimeView Human Gene Expression Array (Affymetrix) |
| Microarray Labeling & Processing | Kit for sample preparation, including IVT-based cDNA and cRNA synthesis. | GeneChip 3' IVT PLUS Reagent Kit (Affymetrix) |
| RNA-seq Library Prep Kit | Kit for construction of stranded, sequencing-ready RNA-seq libraries from polyA-selected mRNA. | Illumina Stranded mRNA Prep, Ligation Kit |
| Microarray Analysis Software | Software suite for processing, normalizing, and analyzing microarray CEL files. | Affymetrix Transcriptome Analysis Console (TAC) (v4.0) |
Workflow and Data Analysis Diagrams
The following diagrams illustrate the core experimental workflows and the logical process of data analysis and interpretation for the two platforms.
Microarray and RNA-seq Experimental Workflows
Transcriptomic Data Analysis and Application Logic
Decision Framework: Selecting the Right Tool
The choice between bulk RNA-seq and microarray is not a matter of which is universally better, but which is the right fit for the research question, budget, and analytical constraints.
Table 3: Platform Selection Guide Based on Research Goals
| Research Goal | Recommended Platform | Rationale Based on Experimental Evidence |
|---|---|---|
| Large-Scale Screening (e.g., 100s of samples) | Microarray | Lower cost and simpler data analysis make it economically feasible for large cohort studies [3] [43]. |
| Mechanistic Pathway Identification | Microarray or RNA-seq | Both platforms showed equivalent performance in gene set enrichment analysis (GSEA) in a direct comparison [3]. |
| Quantitative Dose-Response Modeling (e.g., tPoD/BMC) | Microarray or RNA-seq | Both platforms produced tPoD values on the same level, making either suitable for regulatory toxicology [3]. |
| Discovery-Based Research (novel transcripts, splicing, fusions) | Bulk RNA-seq | RNA-seq can identify novel transcripts, splice variants, and non-coding RNAs not detectable by microarray [3] [42]. |
| Biomarker Discovery & Validation | Bulk RNA-seq | Broader dynamic range and ability to detect multiple variant types (SNVs, indels, fusions) provides a more comprehensive biomarker signature [16] [42]. |
| Studies with Limited Budget | Microarray | Significantly lower per-sample cost while still providing reliable data for many applications [3] [44]. |
In the context of the broader thesis comparing bulk RNA-seq and microarray, the evidence confirms that microarray remains a powerful and highly applicable technology. Its strengths in cost-effectiveness, streamlined data analysis, and proven reliability for hypothesis-driven research make it a compelling choice for many research and drug development settings, particularly in large-scale studies and standardized toxicogenomic applications [3].
The selection of a transcriptomic platform should be a deliberate decision based on a clear understanding of the project's primary goals. Researchers should opt for microarray when the study focuses on known transcripts, requires high throughput, and is constrained by budget. Bulk RNA-seq is the definitive choice for discovery-oriented projects demanding a comprehensive view of the transcriptome. As the 2025 study concludes, for traditional applications like mechanistic pathway identification and concentration-response modeling, "microarray is still a viable method of choice" [3].
Gene expression profiling is a cornerstone of modern toxicogenomics, used for nearly two decades to predict toxic effects, understand their mechanisms, and identify biomarkers [45]. In this field, bulk RNA sequencing (RNA-seq) and microarray technologies are the two principal platforms for conducting genome-wide transcriptional profiling. The fundamental difference between them lies in their core methodology: RNA-seq directly sequences cDNA molecules, providing a digital, quantitative readout, while microarrays rely on the hybridization of labeled cDNA to predefined probes on a chip, yielding an analog, fluorescence-based signal [10]. This methodological distinction underlies many of their comparative advantages and limitations.
The choice between these platforms is not merely technical but has profound implications for the depth and breadth of biological insight, especially in biomarker discovery. As toxicogenomics evolves to address more complex questions about compound safety and mechanisms of action, understanding the relative performance of RNA-seq and microarrays becomes critical for researchers and drug development professionals. This guide provides an objective, data-driven comparison of their performance, drawing on recent comparative studies and experimental data.
Technical Comparison: RNA-seq vs. Microarrays
The following table summarizes the core technical characteristics of each platform, which directly influence their application in toxicogenomic studies.
Table 1: Fundamental comparison of RNA-seq and microarray technologies
| Feature | RNA Sequencing (RNA-seq) | Microarray |
|---|---|---|
| Core Principle | Direct sequencing of cDNA using NGS [10] | Hybridization to predefined probes [10] |
| Requirement for Prior Sequence Knowledge | No | Yes [10] |
| Dynamic Range | >10⁵ (digital counts) [4] | ~10³ (analog signal) [4] |
| Specificity & Sensitivity | Higher, especially for low-abundance transcripts [4] | Lower, limited by background and saturation [4] |
| Data Output | Sequence and abundance of all RNA molecules | Fluorescence intensity of hybridized probes |
| Key Applications in Toxicogenomics | - Novel transcript discovery- Detection of splice variants, gene fusions- Rare transcript quantification- Non-coding RNA analysis | - Profiling known transcripts- Cost-effective large studies- Leveraging established databases |
RNA-seq's key advantages include its wider dynamic range and superior ability to detect novel events. It can identify novel transcripts, gene fusions, single nucleotide variants (SNVs), and other previously unknown changes that arrays cannot detect [4]. This "discovery" power is a significant advantage in toxicogenomics, where unexpected transcriptomic responses to compounds are common. Furthermore, its digital nature and lack of upper signal saturation allow it to quantify expression across a vastly larger range (>10⁵ for RNA-Seq vs. 10³ for arrays) [4].
Microarrays remain a viable tool, particularly for well-defined species and transcripts, benefiting from lower cost and extensive, well-curated public databases [46]. However, they are inherently limited to detecting sequences for which probes have been designed.
Performance Comparison in Real-World Case Studies
Case Study 1: Hepatotoxicity in Rat Models
A seminal toxicogenomic study compared both platforms using liver RNA from rats treated with five known hepatotoxicants: α-naphthylisothiocyanate (ANIT), carbon tetrachloride (CCl₄), methylenedianiline (MDA), acetaminophen (APAP), and diclofenac (DCLF) [45].
Table 2: Summary of results from rat hepatotoxicity study
| Performance Metric | RNA-seq | Microarray | Interpretation |
|---|---|---|---|
| Differentially Expressed Genes (DEGs) | Identified more protein-coding DEGs [45] | Identified fewer DEGs [45] | RNA-seq has a superior ability to detect transcriptomic changes. |
| Quantitative Range | Wider dynamic range of expression changes [45] | Narrower dynamic range [45] | RNA-seq more accurately quantifies very low and very high expression levels. |
| Pathway Enrichment | Enriched known toxicity pathways (e.g., Nrf2, cholesterol biosynthesis) and suggested additional ones [45] | Successfully identified major known toxicity pathways [45] | Both are valid for core pathways, but RNA-seq can provide deeper mechanistic insight. |
| Non-Coding RNA | Enabled identification of differentially expressed non-coding RNAs [45] | Limited capability | RNA-seq offers potential for improved mechanistic clarity through non-coding RNA analysis. |
| Correlation Between Platforms | ~78% of microarray DEGs overlapped with RNA-seq data [45] | Spearman’s correlation of 0.7 to 0.83 with RNA-seq [45] | Good concordance for commonly identified DEGs. |
This study concluded that RNA-seq is an acceptable alternative to microarrays with several advantages, generating more insight into mechanisms of toxicity due to its wider dynamic range and ability to identify more DEGs and non-coding RNAs [45].
Case Study 2: Clinical Endpoint Prediction in Cancer
A large-scale study within the MAQC/SEQC consortia systematically evaluated the performance of RNA-seq and microarray-based classifiers for predicting clinical endpoints, using 498 primary neuroblastoma samples [12]. This study provided a critical finding: while RNA-seq vastly outperforms microarrays in characterizing the transcriptome (revealing >48,000 genes and >200,000 transcripts in neuroblastoma), the two platforms performed similarly in clinical endpoint prediction.
The research generated 360 predictive models for six different clinical endpoints. The results demonstrated that prediction accuracy was most strongly influenced by the nature of the clinical endpoint itself, not by the technology platform (RNA-seq vs. microarray), RNA-seq data analysis pipeline, or feature level used [12]. This indicates that for well-defined predictive tasks based on known gene signatures, the richer data from RNA-seq may not always translate into superior predictive performance.
Case Study 3: Correlation with Protein Expression
Research using The Cancer Genome Atlas (TCGA) datasets across six cancer types (e.g., lung, colorectal, breast) compared how well RNA-seq and microarray data predict actual protein expression, the latter measured by Reverse Phase Protein Array (RPPA) [46].
The study found that for the vast majority of genes, the correlation coefficients between mRNA and protein expression were not significantly different between the two platforms. However, it identified 16 specific genes (including BAX and PIK3CA) where the correlation with protein levels was significantly different, suggesting that the optimal platform can be gene- and context-specific [46]. Furthermore, in building survival prediction models, neither platform was universally superior; microarray performed better in colorectal, renal, and lung cancer, while RNA-seq was better in ovarian and endometrial cancer [46].
Experimental Protocols for a Typical Toxicogenomic Comparison
The following workflow visualizes the key steps in a standardized comparative study, as implemented in the rat hepatotoxicity case study [45].
Detailed Methodology
The following protocol is adapted from Rao et al. (2019) [45].
In-Life Study and Sample Collection:
- Animals: Use an appropriate model (e.g., male Sprague Dawley rats).
- Dosing: Treat animals with tool toxicants (e.g., ANIT, CCl₄, APAP) and relevant vehicle controls for a set period (e.g., 5 days). Dose selection should be based on established toxicogenomic databases or prior literature to ensure a transcriptomic response.
- Necropsy: Collect tissue samples (e.g., liver left lateral lobe) at necropsy. Flash-freeze a portion immediately in liquid nitrogen for RNA analysis. Fix another portion in formalin for histopathological confirmation of toxicity.
RNA Sample Preparation (Critical for Comparison):
- Extraction: Isolate total RNA from flash-frozen tissue using a standard method like Qiazol extraction with on-column DNase treatment.
- Quality Control (QC): Assess RNA integrity (RIN scores ≥ 9) using an instrument such as an Agilent BioAnalyzer. This step is crucial for obtaining reliable data from both platforms.
- Aliquot: Use the same total RNA samples as input for both the RNA-seq and microarray platforms to ensure a fair comparison.
Platform-Specific Library Preparation and Data Generation:
- For RNA-seq:
- Library Prep: Use a kit such as the TruSeq Stranded mRNA Library Prep Kit to enrich for coding mRNA.
- Sequencing: Sequence the libraries on a platform like the Illumina NextSeq500 to generate a sufficient number of single-reads (e.g., ~25-30 million reads per sample).
- For Microarray:
- Labeling: Reverse transcribe RNA into cDNA and label with fluorescent dyes (e.g., Cy3 for control, Cy5 for treatment).
- Hybridization: Hybridize the labeled cDNA to the microarray chip (e.g., Agilent 44k oligonucleotide microarray).
- Scanning: Scan the array to capture fluorescence intensity data for each probe.
- For RNA-seq:
Bioinformatic and Statistical Analysis:
- RNA-seq Data: Align short reads to the reference genome (e.g., using OSA4, STAR). Generate a count matrix for differential expression analysis (e.g., using DESeq2).
- Microarray Data: Process raw intensity files with background correction and normalization (e.g., RMA algorithm). Perform differential expression analysis.
- Comparative Analysis: Identify differentially expressed genes (DEGs) from both platforms. Compare the number of DEGs, overlap between platforms, and correlation of fold-changes. Perform pathway enrichment analysis (e.g., Nrf2 pathway, cholesterol biosynthesis) on the DEG lists from both platforms to compare biological insights.
Table 3: Key materials and resources for toxicogenomic studies
| Item | Function / Application | Example Products / Databases |
|---|---|---|
| Total RNA Extraction Kit | Isolate high-integrity RNA from tissues/cells. Critical for data quality. | Qiagen RNeasy Kit, Qiazol extraction [45] |
| RNA Integrity Analyzer | Assess RNA quality (RIN score) to ensure input material is suitable for sequencing or arrays. | Agilent BioAnalyzer [45] |
| Stranded mRNA Library Prep Kit | For RNA-seq: Enriches for poly-A mRNA and constructs sequencing libraries. | Illumina TruSeq Stranded mRNA Kit [45] |
| Microarray Platform | For microarray analysis: The chip containing probes for transcriptome profiling. | Agilent 44k or 60k oligonucleotide microarray [12] |
| Sequence Alignment Software | For RNA-seq: Maps sequencing reads to a reference genome. | STAR, HISAT2, OSA4 [47] [45] |
| Differential Expression Analysis Tool | Identifies statistically significant changes in gene expression between groups. | DESeq2, Limma [47] [45] |
| Pathway Analysis Database | Interprets DEG lists in the context of biological pathways and functions. | Gene Ontology (GO), Kyoto Encyclopedia of Genes and Genomes (KEGG) [47] |
| Public Data Repository | Source of existing data for validation or meta-analysis. | Gene Expression Omnibus (GEO), The Cancer Genome Atlas (TCGA) [46] [47] |
The relationship between the key decision factors and the strengths of each technology is summarized in the following diagram.
The collective evidence indicates that the choice between RNA-seq and microarrays in toxicogenomics is context-dependent. RNA-seq is the superior discovery tool, providing a more comprehensive view of the transcriptome, which is invaluable for uncovering novel mechanisms of toxicity and biomarkers [45]. However, microarrays remain a robust and cost-effective technology for well-defined applications, such as profiling known transcripts or building predictive models for clinical endpoints where its performance can be on par with RNA-seq [12].
For researchers, the decision should be guided by the project's primary goal. If the aim is exploratory discovery or requires analysis of non-coding RNAs, RNA-seq is the clear choice. If the study is targeted, focused on a set of known genes, and requires cost-effective analysis of many samples, microarrays are a powerful and validated alternative. As sequencing costs continue to decline and analytical workflows become more standardized, RNA-seq is likely to become the dominant platform, but the extensive historical data from microarrays will remain a valuable resource for the toxicogenomics community.
The selection of a transcriptomic profiling platform is a fundamental decision in biomedical research, particularly for studies aimed at predicting clinical endpoints such as disease progression, survival, or treatment response. For over a decade, gene expression microarrays were the dominant technology for this application. The advent of RNA sequencing (RNA-seq) promised enhanced sensitivity and a broader dynamic range, yet its comparative performance for clinical prediction remains a subject of intensive investigation [3] [12].
This guide provides an objective comparison of microarray and bulk RNA-seq platforms for clinical endpoint prediction. We synthesize evidence from recent studies to evaluate their performance, outline experimental protocols for platform comparison, and present quantitative data to inform platform selection by researchers, scientists, and drug development professionals.
Fundamental Technological Differences
Microarray and RNA-seq technologies differ fundamentally in how they quantify gene expression. Microarrays use a hybridization-based approach, where fluorescently labeled cDNA binds to complementary probes on a solid surface, with fluorescence intensity serving as a proxy for expression levels [13]. In contrast, RNA-seq is a sequencing-based method that provides a digital readout by counting the number of reads aligned to each transcript in a reference genome [13] [3].
RNA-seq offers several inherent technical advantages, including a wider dynamic range, lower background noise, and the ability to detect novel transcripts, splice variants, and non-coding RNAs not covered by microarray probes [3] [12]. However, microarrays maintain benefits in terms of lower cost per sample, simpler data analysis pipelines, and extensive curation of public databases for comparison and validation [3].
Key Research Reagents and Solutions
Table 1: Essential Research Reagents and Platforms for Transcriptomic Profiling
| Category | Specific Examples | Function in Analysis |
|---|---|---|
| Microarray Platforms | GeneChip Human Genome U133 Plus 2.0 Array (Affymetrix), PrimeView Human Gene Expression Array (Affymetrix), 44k oligonucleotide-microarray (Agilent) | Pre-designed probe sets for targeted transcriptome profiling |
| RNA-seq Library Prep Kits | NEBNext Ultra II RNA Library Prep Kit for Illumina, Illumina Stranded mRNA Prep, SoLo Ovation Ultra-Low Input RNaseq kit (Tecan Genomics) | Convert RNA to sequence-ready libraries, often with barcoding for multiplexing |
| Globin Reduction Kits | GLOBINclear Kit (Ambion) | Deplete abundant globin mRNAs from blood samples to improve detection of other transcripts |
| RNA Isolation Kits | PAXgene Blood RNA Kit (PreAnalytiX), EZ1 RNA Cell Mini Kit (Qiagen) | Extract high-quality, intact total RNA from various sample types |
| Analysis Software/Packages | Affymetrix TAC, DESeq2, edgeR, affy/RMA (Bioconductor), metaRNASeq (R package) | Process raw data, perform normalization, and conduct differential expression analysis |
Performance Comparison for Clinical Endpoint Prediction
Predictive Accuracy Across Platforms
A landmark study within the MAQC-III/SEQC consortium directly compared the performance of RNA-seq and microarray-based predictive models using 498 primary neuroblastoma samples [12]. Researchers developed 360 models to predict six different clinical endpoints and made a critical discovery: prediction accuracies were most strongly influenced by the nature of the clinical endpoint itself, rather than the technology platform used [12]. The study concluded that "RNA-seq and microarray-based models perform similarly in clinical endpoint prediction," despite RNA-seq providing a more comprehensive view of the transcriptome, including over 48,000 expressed genes and 200,000 transcripts [12].
Similar findings have emerged from toxicogenomic studies. A 2025 comparison of microarray and RNA-seq for transcriptomic benchmark concentration (BMC) modeling of cannabinoids found that both platforms revealed equivalent overall gene expression patterns and produced transcriptomic points of departure (tPoD) at the same potency levels [3]. The study noted that despite RNA-seq identifying larger numbers of differentially expressed genes with wider dynamic ranges, functional and pathway analysis through gene set enrichment analysis (GSEA) yielded equivalent insights from both platforms [3].
Concordance in Gene Expression and Pathway Analysis
Recent evidence demonstrates that with consistent statistical approaches, the concordance between platforms can be remarkably high. A 2025 study of peripheral blood samples from 35 participants found a median Pearson correlation coefficient of 0.76 between microarray and RNA-seq gene expression profiles [13]. While RNA-seq identified more differentially expressed genes (2395 vs. 427 by microarray), the platforms shared 223 significant genes, representing substantial overlap [13].
Pathway analysis in the same study revealed similar convergence. RNA-seq identified 205 perturbed pathways compared to 47 by microarray, with 30 pathways shared between them [13]. The authors emphasized that applying consistent non-parametric statistical methods minimized discrepancies and enhanced the concordance of biological interpretations [13].
Table 2: Quantitative Comparison of Microarray and RNA-Seq Performance
| Performance Metric | Microarray | RNA-seq | Context and Notes |
|---|---|---|---|
| Typical Genes Detected | 15,828 - 21,101 genes [13] [12] | 22,323 - 48,415 genes [13] [12] | Varies by specific platform and annotation database |
| Differentially Expressed Genes (DEGs) Identified | 427 DEGs [13] | 2,395 DEGs [13] | From the same patient samples; 223 DEGs shared |
| Platform Concordance (DEGs) | 69-80% of microarray DEGs detected by RNA-seq [12] | 52% of RNA-seq DEGs detected by microarray [12] | Based on neuroblastoma subgroup analysis |
| Pathways Identified | 47 perturbed pathways [13] | 205 perturbed pathways [13] | 30 pathways shared between platforms |
| Correlation of Expression Profiles | Median Pearson r = 0.76 with RNA-seq [13] | Median Pearson r = 0.76 with microarray [13] | Based on normalized data from matched samples |
| Clinical Endpoint Prediction Accuracy | Equivalent to RNA-seq [12] | Equivalent to microarray [12] | Dependent on clinical endpoint, not platform |
Experimental Protocols for Platform Comparison
Standardized Sample Processing and Analysis
To ensure valid comparisons between platforms, rigorous experimental design and standardized protocols are essential. The following workflow has been successfully employed in multiple comparative studies:
Sample Preparation Protocol:
- Starting Material: Use the same RNA aliquot from each biological sample for both platforms to eliminate sample-to-sample variability [13] [3]. Studies utilized 100ng of globin-reduced total RNA with RNA Integrity Number (RIN) >7 [13].
- Library Preparation: For microarray analysis, employ standardized kits (e.g., GeneChip 3' IVT Express Kit). For RNA-seq, use poly(A) selection and library prep kits (e.g., NEBNext Ultra II RNA Library Prep Kit) [13] [3].
- Quality Control: Implement rigorous QC at each step using tools like FASTQC for RNA-seq and inspection of raw array images and metrics for microarrays [13].
Data Processing and Statistical Analysis:
- Normalization: Apply platform-appropriate normalization methods: Robust Multi-Array Averaging (RMA) with background correction for microarrays, and variance-stabilizing transformation (VST) for RNA-seq count data [13] [3].
- Differential Expression: Apply consistent statistical approaches across platforms. Recent studies recommend non-parametric tests (e.g., Mann-Whitney U) to minimize platform-specific artifacts [13].
- Pathway Analysis: Use standardized gene set enrichment tools (e.g., Ingenuity Pathway Analysis, GSEA) for functional interpretation of results from both platforms [13] [48].
Considerations for Robust Clinical Prediction
Recent research indicates that successful clinical prediction depends more on study design factors than platform selection [12] [49]. The MAQC-III/SEQC neuroblastoma study found that the nature of the clinical endpoint was the primary determinant of predictability, with platform choice (RNA-seq vs. microarray) showing no significant effect on performance across six different endpoints [12].
Statistical power remains a critical concern, particularly for RNA-seq studies. One recent analysis demonstrated that studies with fewer than 10 biological replicates per group show poor replicability in differential expression and enrichment results, regardless of the platform used [49]. This is particularly relevant for clinical studies where sample availability is often limited.
The evidence from recent comparative studies indicates that both microarrays and RNA-seq are capable platforms for clinical endpoint prediction, with neither technology demonstrating clear superiority for this specific application.
Microarrays offer a cost-effective solution for well-defined transcriptional studies where the genes of interest are well-annotated, and budget constraints are significant. The established analysis pipelines and extensive curated public databases further support their continued utility in clinical prediction research [3].
RNA-seq provides clear advantages for discovery-oriented research, offering the ability to detect novel transcripts, splice variants, and non-coding RNAs. However, these technical advantages do not necessarily translate to superior clinical prediction performance, though they may provide valuable biological context [12].
Platform selection should be guided by study objectives, budget considerations, and analytical expertise rather than assumed technological superiority for clinical endpoint prediction. For the foreseeable future, both platforms will likely continue to play complementary roles in clinical transcriptomics research.
Navigating Challenges: Data Analysis and Pipeline Optimization
The fundamental goal of transcriptomics remains consistent—to comprehensively profile gene expression—yet researchers now face a critical choice between established and emerging technologies. While microarrays use a hybridization-based approach to measure fluorescence intensity of predefined transcripts, RNA sequencing (RNA-seq) employs a counting-based method that aligns reads to a reference sequence, offering a wider dynamic range and detection of novel transcripts [3]. This comparison guide examines the complex algorithmic landscape for processing data from these technologies, providing performance benchmarks and experimental protocols to inform researchers' analytical decisions. The evolution of sequencing technologies continues to advance the field, with long-read RNA-seq from platforms like Nanopore and PacBio now enabling more robust identification of major isoforms and complex transcriptional events [50]. Within this rapidly changing context, selecting appropriate analysis tools and understanding their performance characteristics becomes paramount for generating reliable, reproducible biological insights.
Technology Comparison: RNA-seq vs. Microarray
Performance Characteristics and Applications
Despite the rising dominance of RNA-seq, microarray technology maintains relevance in specific applications due to its lower cost, smaller data size, and well-established analytical pipelines [3]. A 2025 comparative study of cannabinoid effects demonstrated that while RNA-seq identified larger numbers of differentially expressed genes (DEGs) with wider dynamic ranges, both platforms yielded equivalent performance in identifying impacted functions and pathways through gene set enrichment analysis (GSEA). Crucially, transcriptomic points of departure (tPODs) derived through benchmark concentration (BMC) modeling were nearly identical between platforms [3].
Table 1: Technology Comparison for Transcriptomic Profiling
| Feature | Bulk RNA-seq | Microarray | Single-Cell/Nucleus RNA-seq | Long-Read RNA-seq |
|---|---|---|---|---|
| Fundamental Principle | Counting aligned reads [3] | Fluorescence intensity measurement [3] | Barcoding and sequencing individual cells [51] | Sequencing full-length native RNA or cDNA [50] |
| Dynamic Range | Wide, virtually unlimited [3] | Limited [3] | Wide | Wide |
| Novel Transcript Detection | Yes (splice variants, non-coding RNAs) [3] | No (limited to predefined transcripts) [3] | Yes, at cellular resolution | Superior for isoforms, fusions, modifications [50] |
| Typical Cost | Moderate to High | Low [3] | High | Moderate to High (decreasing) |
| Ideal Application | Discovery-oriented studies, novel transcript detection [3] | Targeted studies, large cohorts with budget constraints [3] | Cellular heterogeneity, atlas building | Alternative splicing, isoform resolution, epitranscriptomics [50] |
Experimental Protocol for Cross-Platform Comparison
For researchers conducting their own technology comparisons, the following protocol provides a rigorous methodological framework:
- Sample Preparation: Use aliquots from the same biological source to eliminate variability. The 2025 cannabinoid study used identical cell culture lysates from iPSC-derived hepatocytes treated with cannabichromene (CBC) and cannabinol (CBN) [3].
- Platform-Specific Processing:
- Microarray: Process samples using kits such as the GeneChip 3' IVT PLUS Reagent Kit, hybridize to arrays (e.g., GeneChip PrimeView), and scan using systems like the GeneChip Scanner 3000 7G. Normalize data using the Robust Multi-chip Average (RMA) algorithm [3].
- RNA-seq: Prepare libraries using kits such as the Illumina Stranded mRNA Prep, sequence on appropriate platforms, and align reads to a reference genome/transcriptome using tools like HISAT2 or STAR [3] [52].
- Data Integration and Analysis: Merge datasets from different platforms and apply batch effect correction using tools like the
removeBatchEffectfunction from thelimmaR package [53]. Conduct differential expression analysis followed by functional enrichment analysis (GO, KEGG) using consistent parameters across platforms [3] [53].
Figure 1: Experimental workflow for cross-platform transcriptomics comparison. Identical biological samples undergo platform-specific processing before data integration and comparative analysis.
Bulk RNA-seq Analysis Tools and Performance
Core Computational Workflow and Tool Selection
Bulk RNA-seq data analysis follows a structured pipeline with specialized tools available for each stage. Selection depends on experimental goals, computational resources, and technical expertise [52].
- Quality Control: FastQC and MultiQC provide read-level quality checks and aggregate reports across multiple samples [52].
- Alignment/Quasi-mapping: STAR offers ultra-fast alignment but requires substantial memory, while HISAT2 provides a smaller memory footprint with excellent splice-aware mapping. For lightweight quantification, Salmon or Kallisto use quasi-mapping approaches that avoid full alignment [52].
- Quantification: featureCounts or HTSeq generate count matrices from alignments, while Salmon and Kallisto directly produce transcript-level estimates [52].
- Differential Expression: DESeq2, EdgeR, and Limma-voom represent the leading methods, each with distinct statistical approaches and performance characteristics [52].
- Visualization: IGV enables read-level inspection, while ggplot2-based packages create publication-quality summary plots [52].
Table 2: Core Bulk RNA-seq Analysis Tools and Characteristics
| Analysis Stage | Tool Options | Key Features | Performance Considerations | Ideal Use Case |
|---|---|---|---|---|
| Alignment | STAR | Ultra-fast, splice-aware, high memory usage [52] | Faster runtime, higher memory [52] | Large mammalian genomes with sufficient RAM [52] |
| HISAT2 | Splice-aware, lower memory footprint [52] | Balanced memory/runtime compromise [52] | Constrained computational environments [52] | |
| Quantification | Salmon | Quasi-mapping, bias correction, transcript-level [52] | Fast, reduced storage needs [52] | Routine differential expression, isoform resolution [52] |
| Kallisto | k-mer-based, ultra-fast, transcript-level [52] | Extremely fast, simple usage [52] | Rapid expression estimates [52] | |
| Differential Expression | DESeq2 | Negative binomial with shrinkage estimators [52] | Stable with modest sample sizes [52] | Small-n exploratory studies [52] |
| EdgeR | Negative binomial, flexible designs [52] | Efficient with biological variability [52] | Well-replicated experiments [52] | |
| Limma-voom | Linear models with precision weights [52] | Excellent for large cohorts [52] | Complex designs, large sample sizes [52] |
Experimental Protocol for Bulk RNA-seq Analysis
A standardized workflow ensures reproducible bulk RNA-seq analysis:
- Quality Assessment: Process raw FASTQ files with FastQC to assess per-base sequence quality, adapter contamination, and GC content. Use MultiQC to aggregate results across samples [52].
- Read Alignment: Align reads to a reference genome using a splice-aware aligner. For example, with STAR, first generate a genome index, then perform alignment with appropriate parameters for read length and overhang [52].
- Quantification: Generate gene-level count matrices using featureCounts, assigning reads to genomic features based on gene annotation files (GTF/GFF) [52].
- Differential Expression: Import count matrices into R/Bioconductor. For DESeq2 analysis, create a DESeqDataSet object, estimate size factors, estimate dispersions, and apply the Wald test or likelihood ratio test for hypothesis testing. Apply independent filtering and multiple testing correction (Benjamini-Hochberg) to control false discovery rate [52].
- Functional Enrichment: Use clusterProfiler or similar tools to perform Gene Ontology (GO) and Kyoto Encyclopedia of Genes and Genomes (KEGG) pathway enrichment analysis on significant DEGs [53].
Single-Cell/Nucleus RNA-seq Analysis Landscape
Platform Capabilities and Selection Criteria
The single-cell analysis tool ecosystem has expanded dramatically, with over 1,000 specialized tools cataloged as of 2021 [54]. These tools address unique challenges of sparse single-cell data, including high dropout rates and technical variability [51].
- Commercial Platforms: Nygen, BBrowserX, Partek Flow, and ROSALIND offer user-friendly interfaces with cloud-based infrastructure, reducing bioinformatics barriers for experimental biologists [55].
- Open-Source Platforms: Seurat (R-based) and Scanpy (Python-based) remain dominant frameworks providing comprehensive analytical capabilities for researchers with programming expertise [54].
- Quality Considerations: Precision and accuracy in scRNA-seq are generally low at the single-cell level, with reproducibility strongly influenced by cell count and RNA quality. Evidence-based guidelines recommend at least 500 cells per cell type per individual for reliable quantification [51].
Table 3: Single-Cell RNA-seq Analysis Platforms (2025)
| Platform | Best For | Key Features | Automation & AI | Cost & Licensing |
|---|---|---|---|---|
| Nygen | All researchers, especially those needing no-code workflows [55] | Cloud-based, Seurat/Scanpy integration, interactive dashboards [55] | AI-powered cell annotation, LLM-augmented insights [55] | Free-forever tier; Subscription from $99/month [55] |
| BBrowserX | Intuitive, AI-assisted platform for large-scale data [55] | Access to Single-Cell Atlas, customizable plots, GSEA [55] | AI-powered annotation, predictive modeling [55] | Free trial; Pro version requires custom pricing [55] |
| Partek Flow | Labs requiring modular, scalable workflows [55] | Drag-and-drop workflow builder, local/cloud deployment [55] | Guided analytics, automated processing [55] | Free trial; Subscriptions from $249/month [55] |
| ROSALIND | Collaborative teams focusing on interpretation [55] | GO enrichment, automated cell annotation, interactive reports [55] | Automated cell annotation, collaborative features [55] | Free trial; Paid plans from $149/month [55] |
| Seurat | Programmatically-inclined researchers, complex analyses | R-based, comprehensive toolkit, extensive documentation | Modular functions require user direction | Open-source (free) |
| Scanpy | Python-centric workflows, large-scale data processing | Python-based, scalable, integrates with machine learning | Modular functions require user direction | Open-source (free) |
Experimental Protocol for Single-Cell RNA-seq Analysis
A robust single-cell analysis workflow must address data sparsity and technical variability:
- Data Preprocessing and Quality Control: Filter cells based on quality metrics (mitochondrial percentage, unique feature counts, total counts). Remove doublets and low-quality cells using tools like DoubletFinder or Scrublet [51] [55].
- Normalization and Batch Correction: Apply normalization methods (SCTransform in Seurat, or normalizations in Scanpy) to account for sequencing depth variation. Use integration tools (Harmony, Seurat's IntegrateData, or Scanorama) to correct for batch effects across samples or experimental conditions [53] [55].
- Feature Selection and Dimensionality Reduction: Identify highly variable genes. Perform linear dimensionality reduction (PCA) followed by non-linear methods (UMAP, t-SNE) for visualization [55].
- Clustering and Cell Type Annotation: Cluster cells using graph-based methods (Leiden, Louvain) and annotate cell types using reference datasets (SingleCell Atlas in BBrowserX) or automated annotation tools (SingleR, scCATCH) [55].
- Differential Expression and Pathway Analysis: Identify marker genes for clusters using Wilcoxon rank sum tests or model-based approaches. Perform pathway enrichment analysis using tools like clusterProfiler [53].
Figure 2: Core single-cell RNA-seq analysis workflow. The process progresses from quality control through clustering and annotation to biological interpretation.
Critical Experimental Design Considerations
Sample Size Optimization for Reliable Results
Appropriate sample sizing is arguably the most critical factor in ensuring replicable transcriptomics research. A comprehensive 2025 murine study demonstrated that experiments with N ≤ 4 produced highly misleading results with high false positive rates and failure to detect genuinely differentially expressed genes [14]. The analysis revealed:
- Minimum Threshold: 6-7 biological replicates per condition are required to consistently decrease false positive rates below 50% and increase detection sensitivity above 50% for 2-fold expression differences [14].
- Optimal Range: 8-12 replicates per condition significantly improve recapitulation of true biological effects discovered in larger cohorts (N=30) [14].
- Impact of Underpowered Designs: Studies with fewer than 5 replicates systematically overstate effect sizes and exhibit high variability in false discovery rates across trials [14].
These findings align with independent research showing that underpowered RNA-seq experiments (≤5 replicates) produce results with low replicability, though this doesn't necessarily imply all findings are incorrect [49]. Increasing sample size provides substantially more benefit than raising fold-change cutoffs as a strategy to reduce false discoveries [14].
Emerging Methods and Advanced Applications
Bulk Tissue Deconvolution
Computational deconvolution methods infer cellular compositions from bulk RNA-seq data using scRNA-seq references, potentially obviating the need for resource-intensive single-cell experiments. Traditional methods (CIBERSORTx, Bisque) rely on predefined signature matrices and are susceptible to noise [56]. Emerging approaches like genoMap-based Cellular Component Analysis (gCCA) represent gene-expression profiles as images with gene-gene interactions encoded spatially, improving robustness against technical variation. This approach demonstrates a 14.1% average improvement in Pearson correlation compared to existing methods [56].
Long-Read RNA Sequencing
The Singapore Nanopore Expression (SG-NEx) project provides comprehensive benchmarking of long-read RNA-seq technologies, highlighting their superior ability to resolve alternative isoforms, novel transcripts, fusion transcripts, and RNA modifications compared to short-read approaches [50]. While currently more expensive for routine gene-level differential expression, long-read protocols offer unparalleled resolution for isoform-level analysis, with PCR-amplified cDNA sequencing requiring the least input RNA and direct RNA-seq enabling detection of native RNA modifications [50].
Table 4: Key Research Reagents and Computational Resources
| Category | Item | Specific Examples | Function/Purpose |
|---|---|---|---|
| Wet Lab Reagents | Library Prep Kits | Illumina Stranded mRNA Prep, GeneChip 3' IVT PLUS Reagent Kit [3] [50] | Convert RNA to sequenceable libraries |
| Spike-In Controls | ERCC, SIRV, Sequin [50] | Quality control, normalization, quantification benchmarking | |
| Cell Isolation Kits | iCell Hepatocytes 2.0 [3] | Provide consistent biological starting material | |
| Reference Data | Expression Atlas | BioTuring Single-Cell Atlas [55] | Reference for cell type annotation and comparison |
| Pathway Databases | KEGG, GO [53] | Functional interpretation of gene lists | |
| Annotation Databases | org.Hs.eg.db, STRING [53] | Gene identifier conversion, protein interaction networks | |
| Computational Tools | Quality Control | FastQC, MultiQC [52] | Assess sequence data quality |
| Processing Pipelines | nf-core RNA-seq, Cell Ranger [50] [55] | Standardized, reproducible data processing | |
| Visualization | IGV, ggplot2, t-SNE/UMAP plots [52] [55] | Data exploration and result presentation |
Within the context of a broader thesis comparing bulk RNA-seq and microarray technologies, understanding the specific data processing steps for microarrays is fundamental. While RNA sequencing (RNA-Seq) has emerged as a powerful tool for detecting novel transcripts and offering a wider dynamic range, microarray technology maintains significant relevance due to its cost-effectiveness, standardized protocols, and established analytical frameworks for well-annotated genomes [3] [57] [10]. The reliability and interpretability of any microarray experiment, however, hinge critically on robust data preprocessing, particularly normalization and background correction. These steps are essential for removing non-biological variation, enabling accurate comparisons across different samples or experimental conditions, and ensuring that downstream analyses reflect true biological signals [58]. This guide provides a detailed, objective comparison of these foundational processing steps, contextualized within the wider discussion of transcriptomic platforms.
Core Principles of Microarray Normalization and Background Correction
The raw data obtained from a microarray scanner is not immediately usable for biological interpretation. It is influenced by technical artifacts, including variations in sample preparation, dye labeling efficiency, hybridization conditions, and scanner settings. Normalization and background correction are computational procedures designed to correct for these systematic biases, allowing for the true biological differences in gene expression to be discerned.
- Background Correction aims to distinguish the specific fluorescence signal of a probe from the non-specific background noise surrounding it. This noise can arise from factors like non-specific binding of labeled cDNA to the array surface or autofluorescence of the array material. Effective background correction subtracts this noise, leading to more accurate estimates of gene expression levels [58].
- Normalization addresses the systematic technical variations that occur between different array hybridizations. The goal is to adjust the data so that the expression levels of genes are directly comparable across multiple arrays. This process relies on certain biological or technical assumptions, such as the expectation that only a small subset of genes is differentially expressed between conditions or that the average expression level across all genes should be similar between samples [58].
Methodologies and Experimental Protocols
A clear understanding of the experimental and computational workflows is a prerequisite for a meaningful comparison of technologies. The following section outlines the standard protocols for generating and processing microarray data, as cited in contemporary literature.
Standard Microarray Experimental Workflow
The generation of microarray data follows a well-established protocol. The following workflow, commonly described in methodology sections, details the key steps from sample to raw data [3] [10]:
Key Steps in the Experimental Protocol:
- Total RNA Extraction and Purification: RNA is isolated from cells or tissues, and its quality is assessed using methods like the Agilent Bioanalyzer to ensure an RNA Integrity Number (RIN) above a specific threshold (e.g., >7) [13].
- cDNA Synthesis and Labeling: RNA is reverse-transcribed into complementary DNA (cDNA), which is fluorescently labeled during the process. For single-labeled platforms like Affymetrix GeneChip, a single dye is used. For dual-labeled platforms, a test and control sample are labeled with different dyes (e.g., Cy5 and Cy3) [58] [10].
- Hybridization: The labeled cDNA is hybridized to a microarray chip containing thousands of immobilized DNA probes.
- Washing and Scanning: The chip is washed to remove any unbound cDNA and then scanned with a laser to excite the fluorescent dyes. The emitted light is captured, generating a digital image file [3].
- Image Processing: Specialized software (e.g., Affymetrix GeneChip Command Console) converts the image file into a raw data file (e.g., .CEL file), which contains a signal intensity value for each probe on the array [3] [13].
Data Processing and Normalization Workflow
Once raw data is acquired, it undergoes a series of computational steps to make it biologically meaningful. The following workflow, detailed in studies comparing both platforms, is standard for preprocessing [3] [58] [13]:
Detailed Computational Methodologies:
- Background Correction: This initial step adjusts the raw probe intensities by estimating and subtracting the local background noise. Methods vary by platform but generally aim to resolve the true signal from optical and non-specific hybridization noise [58].
- Normalization: This critical step adjusts data to remove technical variation. Common methods include:
- Robust Multi-array Average (RMA): A widely used method for single-labeled arrays (e.g., Affymetrix) that performs background adjustment, quantile normalization, and summarization using a robust median polishing technique [3] [13].
- Quantile Normalization: This powerful method assumes the overall distribution of gene expression is similar across all arrays. It forces the distribution of intensities to be identical across a set of arrays, effectively removing technical biases [3] [13].
- Loess/Lowess Normalization: Primarily used for dual-labeled arrays, this method performs a local regression to normalize the log-ratios of the two dyes (e.g., M versus A plots), accounting for intensity-dependent biases [58].
- Summarization: For arrays where multiple probes target the same gene, this step combines the normalized intensities of these probes into a single, robust expression value for that gene [3].
Comparative Performance: Microarray vs. RNA-Seq
A direct comparison of performance metrics, based on experimental data from studies that processed the same samples with both platforms, reveals their respective strengths and limitations. The following tables summarize quantitative findings from such comparative analyses.
Table 1: Experimental Design and Data Yield from a 2025 Comparative Study [13]
| Parameter | Microarray (Affymetrix) | RNA-Seq (Illumina) |
|---|---|---|
| Sample Input | 100 ng globin-reduced RNA | 100 ng globin-reduced RNA |
| Platform/Kit | GeneChip 3' IVT Express Kit | NEBNext Ultra II RNA Library Prep |
| Detection Principle | Fluorescence hybridization | Digital read counting |
| Genes Detected Post-Filtering | 15,828 | 22,323 |
| Shared Genes with Platform | 86% of its total | 61% of its total |
Table 2: Performance Outcomes in Differential Expression Analysis [13]
| Metric | Microarray | RNA-Seq |
|---|---|---|
| Total Differentially Expressed Genes (DEGs) Identified | 427 | 2,395 |
| Shared DEGs (Common to Both Platforms) | 223 | 223 |
| Concordance (Shared/Total Microarray DEGs) | 52.2% | - |
| Median Pearson Correlation of Expression Profiles | 0.76 | 0.76 |
| Pathways Perturbed (from IPA) | 47 | 205 |
| Shared Pathways (Common to Both) | 30 | 30 |
Synthesis of Comparative Data:
The experimental data shows a high correlation (median r=0.76) in gene expression profiles between the two technologies when the same samples are analyzed with consistent statistical methods [13]. However, RNA-seq's digital nature and independence from pre-defined probes provide a clear advantage in the scope of detection, leading to the identification of a larger number of genes and differentially expressed genes [13] [10]. Despite this, the functional biological interpretation can be highly concordant, as evidenced by the 30 shared pathways found in pathway analysis, suggesting that microarray data can reliably identify major biological mechanisms impacted in an experiment [3] [13].
Successful microarray data processing relies on a suite of established reagents, software tools, and public databases.
Table 3: Key Research Reagent Solutions for Microarray Processing
| Item Name | Function in Experiment | Example Manufacturer/Citation |
|---|---|---|
| GeneChip Human Genome U133 Plus 2.0 Array | Oligonucleotide probe array for profiling over 20,000 human genes. | Affymetrix [13] |
| PAXgene Blood RNA Kit | For stabilization and purification of total RNA from whole blood. | PreAnalytiX [13] |
| GLOBINclear Kit | Depletion of globin mRNA to improve sensitivity in blood samples. | Ambion [13] |
| GeneChip 3' IVT Express Kit | For amplification and biotin-labeling of RNA for hybridization. | Affymetrix [3] [13] |
| affy R/Bioconductor Package | Software for background correction, normalization (RMA), and summarization of raw data. | Open-source BioConductor [13] |
| Gene Expression Omnibus (GEO) | Public repository to archive and retrieve microarray data. | NIH/NCBI [59] |
Within the broader comparison of bulk RNA-seq and microarray technologies, the choice of platform is dictated by the specific research question and available resources. RNA-seq offers a more comprehensive and discovery-based approach, with a superior dynamic range and ability to detect novel transcripts [3] [4] [10]. However, as demonstrated by the experimental data, microarray technology, when coupled with rigorous and standardized data processing pipelines for normalization and background correction, remains a highly reliable and cost-effective tool [3] [57]. It provides biologically concordant results, particularly for identifying core functional pathways and differentially expressed genes among well-annotated sequences. Therefore, microarrays continue to be a viable and precise tool for targeted gene expression studies, especially in contexts with budget constraints or a focus on known genomic elements.
The choice between bulk RNA sequencing (RNA-seq) and microarray technologies represents a critical foundational decision in transcriptomic study design. This comparison is framed within a broader thesis that evaluating these technologies must extend beyond pure performance metrics to include cost, computational burden, and practical applicability in both research and clinical settings. While RNA-seq has emerged as the dominant platform due to its higher precision, wider dynamic range, and capability to detect novel transcripts [3], microarrays maintain significant advantages in cost-efficiency, data size, and analytical maturity [3]. Recent studies in 2025 continue to demonstrate that for traditional transcriptomic applications such as mechanistic pathway identification and concentration-response modeling, microarray remains a viable and often preferable method [3].
The evolution of next-generation sequencing (NGS) costs has fundamentally reshaped this technological landscape. There has been a 96% decrease in the average cost-per-genome since 2013 [60], making sequencing technologies increasingly accessible. However, a holistic cost assessment must consider the total cost of ownership, including instrument purchase, ancillary equipment, library preparation, sequencing reagents, and data analysis/storage infrastructure [60]. Understanding these trade-offs is essential for researchers, scientists, and drug development professionals to optimize their experimental pipelines and resource allocation.
Performance Benchmarking: A Quantitative Comparison
To objectively evaluate the two platforms, we analyzed data from a recent 2025 study that directly compared microarray and RNA-seq using the same samples from a cannabinoid exposure experiment [3]. The study employed concentration-response transcriptomic modeling, providing quantitative toxicogenomic information highly relevant for drug development applications.
Table 1: Experimental Outcomes Comparison Between Microarray and RNA-Seq [3]
| Performance Metric | Microarray (PrimeView) | Bulk RNA-Seq | Interpretation |
|---|---|---|---|
| Overall Gene Expression Patterns | Similar patterns with regard to compound concentration | Similar patterns with regard to compound concentration | High concordance in overall transcriptome response |
| Differentially Expressed Genes (DEGs) Detected | Standard number | Larger numbers with wider dynamic ranges | RNA-seq detects more transcriptional changes |
| Transcript Coverage | Predefined, known transcripts | Can detect novel transcripts, splice variants, and non-coding RNAs | RNA-seq offers discovery potential |
| Functional Pathway Identification (GSEA) | Equivalent performance | Equivalent performance | Both platforms identify similar impacted biological pathways |
| Transcriptomic Point of Departure (tPoD) | Same level | Same level | Equivalent performance in quantitative risk assessment |
Table 2: Economic and Practical Considerations [3] [61] [62]
| Consideration | Microarray | Bulk RNA-Seq |
|---|---|---|
| Cost per Sample (Approximate) | Lower | \$36.9 - \$173 (highly variable based on protocol and depth) [61] |
| Data Size per Sample | Smaller, more manageable | Larger, requiring significant storage and compute resources |
| Analytical Software & Public Databases | Well-established, mature | Evolving, but requires more specialized bioinformatics expertise |
| Computational Pipeline Cost | Minimal | \$10 - \$15 per sample industry standard; can be optimized to ~\$2-4 [62] |
| Hands-on Time | Standard protocol | ~3-4 days for all stages [61] |
Experimental Protocols and Methodologies
The comparative data presented in the previous section were derived from a rigorously controlled experimental system. The following detailed methodology outlines the key protocols used in the 2025 benchmark study [3], which serves as a model for such comparative analyses.
Cell Culture and Exposure Model
- Cell Source: Commercial induced pluripotent stem cell (iPSC)-derived hepatocytes (iCell Hepatocytes 2.0) were used as a biologically relevant model system.
- Culture Conditions: Cells were seeded at a density of 3 × 10^5 cells/cm^2 onto rat tail collagen type I-coated plates. They were maintained in plating medium (RPMI 1640 with B27 supplement, oncostatin M, dexamethasone, gentamicin, and proprietary medium supplement) for the first four days, then switched to maintenance medium without oncostatin M.
- Compound Exposure: On day 6 of culture, cells were exposed to varying concentrations of cannabichromene (CBC) and cannabinol (CBN) for 24 hours. Dosing solutions were prepared to maintain a constant DMSO concentration of 0.5% (v/v) across all treatments, including vehicle controls.
RNA Sample Preparation
- Cell Lysis and Homogenization: After exposure, cells were lysed in RLT buffer supplemented with 1% β-mercaptoethanol. Lysates were homogenized using QIAshredder columns.
- RNA Purification: Total RNA was purified using the EZ1 Advanced XL automated instrument with the EZ1 RNA Cell Mini Kit, including an on-column DNase digestion step to remove genomic DNA.
- Quality Control: RNA concentration and purity (260/280 ratio) were measured via NanoDrop UV-vis spectrophotometer. RNA integrity was further assessed using the Agilent 2100 Bioanalyzer to obtain RNA Integrity Numbers (RIN), a critical step for ensuring high-quality input material for both platforms.
Microarray Data Generation
- Platform: GeneChip PrimeView Human Gene Expression Arrays from Affymetrix.
- Sample Processing: 100 ng of total RNA was processed using the GeneChip 3' IVT PLUS Reagent Kit. This involved cDNA synthesis, in vitro transcription (IVT) to produce biotin-labeled cRNA, followed by fragmentation of the cRNA.
- Hybridization and Scanning: Fragmented cRNA was hybridized to microarray chips for 16 hours at 45°C. Chips were then stained, washed, and scanned using the GeneChip Scanner 3000 7G.
- Data Preprocessing: Scanned image (DAT) files were converted to cell intensity (CEL) files using Affymetrix Command Console software. The Robust Multi-array Average (RMA) algorithm in the Transcriptome Analysis Console (TAC) software was used for background adjustment, quantile normalization, and summarization of probe-level data.
RNA-seq Data Generation
- Library Preparation: Sequencing libraries were prepared from 100 ng of total RNA per sample using the Illumina Stranded mRNA Prep, Ligation Kit. This process includes purification of polyA-tailed mRNA, fragmentation, cDNA synthesis, and adapter ligation.
- Sequencing: The prepared libraries were sequenced on an Illumina platform to generate paired-end reads. The specific depth of sequencing (e.g., 20-50 million reads per sample) is a key cost and performance driver [61].
Data Analysis Workflow
The general workflow for RNA-seq data analysis, as taught in current bioinformatics courses, involves several standardized steps [63]:
- Quality Control: Assessing raw read quality using tools like FastQC.
- Trimming: Removing adapter sequences and low-quality bases.
- Alignment: Mapping reads to a reference genome using aligners such as STAR or HISAT2.
- Quantification: Generating counts of reads mapped to genes or transcripts using featureCounts or similar tools.
- Differential Expression: Identifying statistically significant changes in gene expression between conditions using packages like DESeq2 or edgeR.
- Functional Enrichment: Interpreting the biological meaning of DEGs through Gene Set Enrichment Analysis (GSEA) or tools like DAVID and Reactome [63].
Figure 1: Experimental workflow for the comparative analysis of microarray and RNA-seq technologies, from sample preparation through data analysis.
The Scientist's Toolkit: Essential Research Reagent Solutions
The following table details key reagents, kits, and instruments essential for executing the benchmark experiments described in this guide. These solutions represent current industry standards for generating high-quality transcriptomic data.
Table 3: Essential Research Reagents and Kits for Transcriptomic Analysis
| Item Name | Provider/Model | Function in Workflow |
|---|---|---|
| iCell Hepatocytes 2.0 | FUJIFILM Cellular Dynamics | Differentiated human hepatocytes; biologically relevant cell model for toxicogenomics and drug metabolism studies [3]. |
| EZ1 RNA Cell Mini Kit | Qiagen | Automated purification of high-quality total RNA, including DNase digestion step to remove genomic DNA contamination [3]. |
| Agilent 2100 Bioanalyzer | Agilent Technologies | Microfluidics-based system for assessing RNA integrity (RIN); critical quality control step before proceeding to downstream applications [3] [61]. |
| GeneChip PrimeView Array | Affymetrix | Microarray platform for whole-genome gene expression profiling using a hybridization-based approach [3]. |
| TruSeq Stranded mRNA Kit | Illumina | Library preparation kit for RNA-seq; selects for polyA-tailed mRNA and generates strand-specific libraries [61]. |
| NovaSeq 6000 System | Illumina | High-throughput sequencing instrument; enables multiplexing of hundreds of samples to reduce per-sample cost [61]. |
| BRB-seq Kit | Alithea Genomics | Ultra-affordable, high-throughput library prep kit using bulk RNA barcoding to dramatically reduce costs [61]. |
Signaling Pathways and Analytical Relationships
The interpretation of transcriptomic data, whether from microarray or RNA-seq, culminates in the mapping of gene expression changes onto biologically meaningful pathways. Gene Set Enrichment Analysis (GSEA) is a central method for this functional interpretation. The logical flow from raw data to biological insight, and the relationship between the two technological platforms, can be visualized as follows.
Figure 2: The convergent analytical pathway from platform-specific data to biological insight via functional enrichment.
This evaluation of 192 analytical combinations, framed within the specific context of bulk RNA-seq versus microarray comparison research, demonstrates that the optimal technological choice is not absolute but is dictated by experimental goals and resource constraints. The data confirms that RNA-seq provides superior discovery power through its wider dynamic range and ability to detect novel features [3]. However, for defined applications such as quantitative pathway analysis and concentration-response modeling—cornerstones of toxicogenomics and drug development—microarray platforms deliver equivalent functional conclusions and benchmark concentrations (tPoDs) at a lower total cost and with less computational overhead [3].
Future directions in transcriptomics will likely be shaped by further cost reductions in sequencing, the integration of single-cell and long-read technologies, and the increasing importance of efficient computational pipelines. Cloud-based solutions and open-source workflow managers like Kubernetes are already enabling reductions in computational costs of up to 85% for large-scale RNA-seq analyses [62]. Furthermore, the emergence of targeted RNA-seq panels offers a middle ground, providing deep coverage of specific genes of interest to bridge the gap between discovery and targeted application [64]. For researchers and drug development professionals, the decision matrix should, therefore, balance the need for discovery against practical constraints, acknowledging that both technologies remain viable within a modern transcriptomics toolkit.
Selecting the appropriate transcriptomic profiling technology is a critical first step in any gene expression study. The choice between bulk RNA sequencing (RNA-seq) and microarrays is not merely a technical decision but one that is profoundly influenced by the biological system under investigation. While RNA-seq has largely superseded microarrays in many applications due to its broader dynamic range and ability to detect novel transcripts, the optimal workflow remains dependent on species-specific genomic resources and research objectives. This guide provides an objective comparison of these technologies, supported by experimental data, to help researchers optimize their workflows based on the organism being studied.
RNA-seq and microarrays differ fundamentally in their operational principles. Microarrays rely on hybridization between labeled cDNA and predefined probes immobilized on a chip, requiring prior knowledge of the transcriptome for probe design [10]. In contrast, RNA-seq utilizes next-generation sequencing to directly determine cDNA sequences, generating discrete, digital read counts without the need for species- or transcript-specific probes [4] [10].
Table 1: Fundamental Technical Differences Between Microarrays and RNA-seq
| Feature | Microarray | Bulk RNA-Seq |
|---|---|---|
| Principle | Hybridization with predefined probes | Direct sequencing of cDNA |
| Prior sequence knowledge required | Yes | No |
| Dynamic range | ~10³ [4] | >10⁵ [4] |
| Data output | Analog fluorescence intensity | Digital read counts |
| Novel transcript detection | Limited to pre-designed probes | Comprehensive [4] [10] |
The following diagram illustrates the core methodological differences between these two technologies:
Performance Comparison Across Applications
Detection Capabilities and Analytical Performance
Multiple studies have systematically compared the analytical performance of RNA-seq and microarray technologies, revealing distinct advantages for each platform depending on the application.
Table 2: Performance Comparison of RNA-seq vs. Microarrays in Transcript Detection
| Performance Metric | Microarray | RNA-seq | Experimental Support |
|---|---|---|---|
| Protein-coding DEG detection | Baseline | 22% more genes detected in toxicogenomics study [26] | Rat liver toxicogenomics study [26] |
| Novel transcript discovery | Limited by probe design | 48,415 genes detected in neuroblastoma [12] | Neuroblastoma transcriptome study (n=498) [12] |
| Differential splicing analysis | Limited capability | Identifies 65.9% of DEGs with discordant transcript patterns [12] | Neuroblastoma subgroup analysis [12] |
| Clinical endpoint prediction | Comparable performance | Similar accuracy for validated endpoints [12] | MAQC-III/SEQC study of 360 predictive models [12] |
| Fusion gene detection | Limited | Comprehensive detection with specialized algorithms [42] | Clinical oncology validation [65] [42] |
Dynamic Range and Sensitivity
RNA-seq provides a significant advantage in dynamic range, exceeding 10⁵ compared to approximately 10³ for microarrays [4]. This expanded range allows RNA-seq to quantify both highly abundant and rare transcripts more accurately. In toxicogenomic studies, RNA-seq demonstrated superior sensitivity in detecting differentially expressed genes (DEGs) across multiple hepatotoxicants, identifying approximately 78% of DEGs found by microarrays plus additional genes that enriched known toxicity pathways [26]. The technology's ability to detect rare and low-abundance transcripts is particularly valuable for identifying weakly expressed genes or transcripts present at single-cell levels [4] [10].
Species-Specific Workflow Optimization
Model Organisms with Well-Defined Genomes
For well-studied model organisms such as human, mouse, and rat, both technologies can be effectively applied, though with different considerations. Microarrays provide a cost-effective solution for focused studies targeting known transcripts when high-throughput analysis of many samples is required. The established microarray platforms for these species benefit from extensive validation and standardized analysis pipelines.
However, even for model organisms, RNA-seq offers significant advantages for comprehensive transcriptome characterization. In neuroblastoma research, RNA-seq revealed that more than 48,000 genes and 200,000 transcripts are expressed in this malignancy, far exceeding the detection capacity of standard 44k microarrays [12]. The technology enabled researchers to detect differentially expressed transcript variants of cancer genes like NF1 and MDM4, which displayed discordant expression patterns that would have been missed by gene-level analysis [12].
For non-model organisms or species with incomplete genome assemblies, RNA-seq is unequivocally superior due to its independence from prior sequence knowledge. Microarray design requires comprehensive transcriptome information for probe selection, making it impractical for species without well-annotated genomes. RNA-seq not only enables gene expression quantification but simultaneously contributes to genome annotation and transcript discovery.
Reference-free assembly approaches in RNA-seq analysis allow researchers to reconstruct transcripts de novo, though this method is computationally demanding and requires deeper sequencing depth compared to reference-based alignment [66]. For non-model organisms, ribo-minus RNA selection is often preferable to poly-A selection since it preserves non-polyadenylated transcripts and does not rely on assumptions about transcript processing that may vary across species [66].
Clinical and Diagnostic Applications
In clinical diagnostics, particularly for Mendelian disorders and oncology, RNA-seq has demonstrated growing utility despite microarray's historical use. A clinically validated RNA-seq test for Mendelian disorders successfully analyzed 130 samples, providing essential functional data for accurate interpretation of diagnostic sequencing results [67]. The test utilized outlier analysis in gene expression and splicing patterns to identify pathogenic variants.
In oncology, combined RNA and DNA exome sequencing applied to 2,230 clinical tumor samples improved detection of clinically actionable alterations in 98% of cases, uncovered complex genomic rearrangements that would have remained undetected by DNA-only testing, and enhanced gene fusion detection [65]. This integrated approach enables direct correlation of somatic alterations with gene expression and recovery of variants missed by DNA-only testing.
Experimental Design and Protocol Considerations
Sample Preparation and Library Construction
The selection of appropriate library preparation methods is crucial for optimizing RNA-seq workflows. Researchers must choose between mRNA-only and whole transcriptome libraries, each with distinct advantages. mRNA sequencing (often via poly-A selection) focuses on protein-coding genes, while whole transcriptome approaches (typically involving rRNA depletion) provide broader coverage including non-coding RNAs [42].
For microarray analysis, the standard protocol involves extracting total RNA, reverse transcribing to cDNA with fluorescent labeling, hybridizing to the microarray chip, and scanning fluorescent signals [10]. Quality control steps are critical for both technologies, with RNA Integrity Number (RIN) scores ≥9 recommended for reliable results in RNA-seq studies [26].
Bioinformatics and Data Analysis Pipelines
RNA-seq data analysis involves multiple steps including trimming, alignment, counting, and normalization, with numerous algorithmic options at each stage. A systematic evaluation of 192 alternative methodological pipelines revealed that performance varies significantly based on the chosen combinations of algorithms [15]. For alignment, researchers can choose between traditional aligners (e.g., STAR, BWA) that provide detailed mapping information, pseudoaligners (e.g., Kallisto, Salmon) that offer faster processing with minimal accuracy trade-offs for quantification purposes, and reference-free assembly for organisms without reference genomes [66].
For microarray data, standard analysis includes background correction, normalization, and differential expression analysis using established methods. The complexity of RNA-seq analysis is substantially higher, requiring careful consideration of normalization approaches (e.g., TPM, FPKM, RPKM) to account for library size and gene length biases [66].
Table 3: Essential Research Reagents and Tools for Transcriptomics Workflows
| Reagent/Tool | Function | Application Notes |
|---|---|---|
| TruSeq Stranded mRNA Kit | Library preparation for RNA-seq | Optimized for mRNA sequencing; suitable for model organisms [65] |
| SureSelect XTHS2 Kit | Exome capture for RNA/DNA | Used in integrated WES+RNA-seq clinical assays [65] |
| AllPrep DNA/RNA Kits | Simultaneous nucleic acid isolation | Maintains integrity for both RNA-seq and microarray [65] |
| Poly-A Selection | mRNA enrichment | Focuses on protein-coding genes; may miss non-polyadenylated RNAs [66] |
| Ribo-minus Depletion | rRNA removal | Retains more RNA species; requires greater sequencing depth [66] |
| STAR Aligner | RNA-seq read alignment | Splice-aware alignment to reference genome [65] |
| Kallisto | Pseudoalignment for quantification | Fast processing suitable for large datasets [65] |
| DESeq2/edgeR | Differential expression analysis | Statistical methods for RNA-seq count data [66] |
Integrated Workflow Diagram
The following diagram illustrates a recommended workflow for selecting between microarray and RNA-seq technologies based on species-specific considerations and research goals:
The choice between microarray and RNA-seq technologies requires careful consideration of species-specific genomic resources, research objectives, and practical constraints. While RNA-seq offers superior capabilities for novel transcript discovery, detection of rare transcripts, and applications in non-model organisms, microarrays remain valuable for targeted studies in well-annotated species, particularly when processing large sample cohorts with limited budgets. As the field advances, integrated approaches combining multiple technologies show particular promise, with combined RNA and DNA sequencing demonstrating enhanced detection of clinically actionable alterations in oncology and Mendelian disease diagnostics. By aligning technological capabilities with species-specific requirements and research goals, investigators can optimize their transcriptomic workflows to maximize biological insights while efficiently utilizing available resources.
This guide provides an objective comparison between bulk RNA-seq and microarray technologies, focusing on the critical decision-making factors of computational resources, time, and budget. While RNA-seq offers a superior technical profile for novel discovery, microarrays present a compelling, cost-effective alternative for focused gene expression studies, especially in contexts with limited computational infrastructure. The choice between platforms should be guided by specific research goals, budget constraints, and analytical capabilities.
Gene expression analysis is a cornerstone of modern biological research, toxicology, and drug development. For years, hybridization-based microarrays were the primary platform for transcriptomic applications, using predefined probes to measure fluorescence intensity of known transcripts [3]. Since the mid-2000s, bulk RNA sequencing (RNA-seq) has emerged as a powerful alternative, utilizing next-generation sequencing to count reads aligned to a reference genome, thereby quantifying expression [3] [26]. The fundamental distinction lies in their operational principles: microarrays depend on hybridization to known sequences, whereas RNA-seq employs direct sequencing, enabling discovery of novel transcripts [10].
Selecting the appropriate platform requires balancing multiple factors. As one analysis notes, "Considering the relatively low cost, smaller data size, and better availability of software and public databases for data analysis and interpretation, microarray is still a viable method of choice for traditional transcriptomic applications" [3]. In contrast, RNA-seq is favored for its discovery power and quantitative precision, albeit with higher computational demands [4]. This guide provides a detailed cost-benefit analysis to inform this critical decision.
Technical Comparison & Performance Data
Key Technical Differences
Table 1: Technical Specifications of Microarray vs. RNA-seq
| Feature | Microarray | Bulk RNA-seq |
|---|---|---|
| Fundamental Principle | Hybridization with labeled probes to predefined sequences [10] | Direct, high-throughput sequencing of cDNA [10] |
| Dependency on Prior Sequence Knowledge | Required [10] | Not required [10] |
| Dynamic Range | ~10³ (limited by background noise and signal saturation) [4] | >10⁵ (digital counting provides a wider range) [4] |
| Ability to Detect Novel Transcripts | No | Yes (including novel genes, splice variants, and gene fusions) [3] [4] |
| Specificity & Sensitivity | Lower, especially for low-abundance transcripts [4] | Higher, can detect rare and low-abundance transcripts [4] |
| Types of RNA Detected | Primarily predefined coding RNAs | Comprehensive, including mRNA, and various non-coding RNAs (lncRNA, miRNA) [3] [26] |
Experimental Concordance and Performance
Independent comparative studies reveal significant but not complete concordance between the platforms. Research on rat livers exposed to hepatotoxicants found that approximately 78% of differentially expressed genes (DEGs) identified by microarrays overlapped with those from RNA-seq data, with a high Spearman’s correlation ranging from 0.7 to 0.83 [26]. Both technologies successfully identified relevant pathological pathways, such as Nrf2 signaling and hepatic cholestasis [26].
A 2025 study on cannabinoids concluded that despite RNA-seq identifying larger numbers of DEGs with a wider dynamic range, the two platforms displayed equivalent performance in identifying impacted functions and pathways through gene set enrichment analysis (GSEA). Furthermore, transcriptomic point of departure (tPoD) values derived through benchmark concentration (BMC) modeling were on the same levels for both platforms [3].
Detailed Cost and Resource Analysis
Direct and Indirect Cost Factors
Table 2: Comparative Analysis of Costs and Resources
| Factor | Microarray | Bulk RNA-seq |
|---|---|---|
| Per-Sample Cost | Lower [68] | Higher [68] |
| Data Storage Needs | Smaller data size (intensity files) [3] | Large file sizes (FASTQ, BAM; require extensive storage) [26] [69] |
| Computational Infrastructure | Minimal; well-established, simple software [3] [70] | Extensive; requires high-performance computing and complex bioinformatic pipelines [26] [15] |
| Analysis Time & Complexity | Shorter; streamlined, standardized analysis [70] | Longer; computationally intensive and time-consuming analytics [26] |
| Personnel Skill Level | Standard molecular biology and statistics | Requires specialized bioinformatics expertise [26] |
| Sample Preparation Protocol | Relatively simple [3] | More complex library preparation [15] |
Sample Size Considerations and Impact on Budget
Sample size is a critical driver of total project cost. A 2025 large-scale murine study demonstrated that underpowered experiments (e.g., N < 5) yield highly misleading results with high false positive rates and lack of true discoveries [14]. The research established that to consistently achieve a false positive rate below 50% and sensitivity above 50% for a 2-fold expression difference, a sample size of 6-7 mice per group is required. For significantly better results that recapitulate a large gold-standard experiment (N=30), a sample size of 8-12 is recommended [14]. These findings have direct budget implications, as the higher per-sample cost of RNA-seq is magnified with adequate sample sizes.
Experimental Protocols for Technology Comparison
To ensure a fair and accurate comparison between platforms, the following experimental design and protocols, derived from cited literature, should be employed.
Sample Preparation and Experimental Design
- Cell Culture & Treatment: Use a relevant in vitro model, such as iPSC-derived hepatocytes. Culture cells following manufacturer protocols in standardized conditions [3].
- Chemical Exposure: Expose cells to varying concentrations of the test compound(s) and a vehicle control (e.g., DMSO) in triplicate for a set period (e.g., 24 hours) [3].
- RNA Extraction: Lyse cells and purify total RNA using a commercial kit with a DNase digestion step to remove genomic DNA contamination. Assess RNA concentration, purity (via Nanodrop), and integrity (using an Agilent Bioanalyzer to obtain RNA Integrity Number - RIN) [3] [26]. Using the same high-quality RNA samples (RIN ≥ 9) for both platforms is crucial for a valid comparison [3] [26].
Platform-Specific Data Generation Protocols
Microarray Protocol
- cRNA Synthesis: Process total RNA (e.g., 100 ng) using a kit like the GeneChip 3' IVT PLUS Reagent Kit. This involves reverse transcription, conversion to double-stranded cDNA, and in vitro transcription (IVT) to produce biotin-labeled complementary RNA (cRNA) [3].
- Fragmentation and Hybridization: Fragment the labeled cRNA and hybridize it to the microarray chip (e.g., GeneChip PrimeView Human Gene Expression Array) for 16 hours [3].
- Washing and Scanning: Wash and stain the chips on a fluidics station, then scan them using a dedicated scanner [3].
- Data Extraction: Use software (e.g., Affymetrix GeneChip Command Console) to generate cell intensity (CEL) files. Normalize data using a standard algorithm like the Robust Multi-chip Average (RMA) [3].
Bulk RNA-seq Protocol
- Library Preparation: Use a stranded mRNA library prep kit (e.g., Illumina TruSeq Stranded mRNA Prep). Enrich for polyadenylated mRNA and reverse transcribe to create cDNA libraries with adapters [3] [26].
- Sequencing: Pool normalized libraries and sequence on a platform such as the Illumina NextSeq500 or HiSeq2000 to a sufficient depth (e.g., 25-100 million paired-end reads per sample) [26] [15].
- Primary Data Analysis:
- Quality Control: Check raw sequencing data (FASTQ files) with tools like FastQC [70] [15].
- Trimming: Use algorithms like Trimmomatic or Cutadapt to remove adapter sequences and low-quality bases [15].
- Alignment: Map quality-filtered reads to a reference genome (e.g., hg19) using a splice-aware aligner like Rsubread or OSA [26] [70].
- Quantification: Generate raw read counts for each gene based on genomic annotations [70].
Downstream Data Analysis Workflow
The analysis pathways for both platforms converge on common goals: identifying differentially expressed genes (DEGs) and performing functional enrichment.
The Scientist's Toolkit: Essential Research Reagents and Materials
Table 3: Key Reagents and Materials for Transcriptomics Workflows
| Item | Function | Example Products/Catalogs |
|---|---|---|
| Total RNA Extraction Kit | Isolate high-quality, intact RNA from cells or tissues. | RNeasy Plus Mini Kit (Qiagen), Qiazol (for extraction) [3] [26] |
| RNA Quality Assessment System | Evaluate RNA integrity (RIN) prior to library prep or labeling. | Agilent 2100 Bioanalyzer with RNA Nano Kit [3] [26] |
| Microarray Labeling & Hybridization Kit | Convert RNA to labeled cDNA/cRNA and prepare for hybridization. | GeneChip 3' IVT PLUS Reagent Kit [3] |
| Microarray Chip | Solid support with immobilized probes for targeted gene expression. | GeneChip PrimeView Human Gene Expression Array [3] |
| RNA-seq Library Prep Kit | Fragment RNA, reverse transcribe to cDNA, and add sequencing adapters. | Illumina TruSeq Stranded mRNA Prep Kit [3] [26] |
| Sequence Alignment & Quantification Software | Map sequencing reads to a reference genome and assign to genes. | Rsubread, OSA4 (Omicsoft) [26] [70] |
| Differential Expression Analysis Tool | Statistically identify genes with significant expression changes. | edgeR, limma-voom pipeline [70] |
The decision between bulk RNA-seq and microarrays is not one-size-fits-all and must be aligned with project-specific goals and constraints.
- Choose Bulk RNA-seq when: The research aim involves discovery—such as identifying novel transcripts, splice variants, or gene fusions [10] [4]. It is also the preferred choice for projects requiring the widest dynamic range and highest sensitivity for low-abundance transcripts, or when studying organisms without a well-annotated genome [4]. This choice necessitates a budget for higher sequencing costs and dedicated computational resources and bioinformatics expertise [26].
- Choose Microarrays when: The research is focused on profiling known transcripts in a well-annotated organism, such as for routine toxicogenomic screening, pathway analysis, or concentration-response modeling [3]. Microarrays are highly suitable for projects with limited budgets, smaller data storage capabilities, and where analysis simplicity and speed are prioritized [3] [68]. They remain a robust and viable platform for these traditional applications.
In summary, RNA-seq offers unparalleled comprehensiveness for discovery-driven projects that can support its greater demands. Microarrays provide a cost-effective, efficient, and analytically straightforward solution for focused gene expression studies, continuing to hold significant value in many research and development contexts.
Evidence-Based Decisions: Concordance Studies and Performance Validation
This guide provides an objective comparison of RNA sequencing (RNA-seq) and microarray technologies, focusing on their correlation and performance when integrating data across multiple studies. For researchers in drug development and basic science, the choice between these platforms involves balancing cost, data richness, and analytical feasibility. Recent evidence demonstrates that while RNA-seq offers a more comprehensive view of the transcriptome, both technologies can achieve remarkably similar endpoints in functional analysis and clinical prediction when best-practice methodologies are applied. The critical challenge of cross-platform data integration is now being addressed by innovative bioinformatic solutions.
Performance Metrics and Quantitative Comparison
Technical Capability and Data Concordance
Table 1: Fundamental technological differences between RNA-seq and microarrays
| Feature | RNA-seq | Microarray | Experimental Evidence |
|---|---|---|---|
| Dynamic Range | >10⁵ [4] | ~10³ [4] | Discrete read counts vs. fluorescence signal saturation [4] |
| Novel Transcript Detection | Yes (novel genes, splice variants, non-coding RNAs) [3] [12] | No (limited to predefined probes) [3] | RNA-seq identified 48,415 expressed genes in neuroblastoma vs. 21,101 on arrays [12] |
| DEG Concordance | 69-80% of microarray DEGs [12] | Baseline for common genes | Microarrays detected 11,688 DEGs; RNA-seq detected 80.1% of them plus many more [12] |
| Specificity & Sensitivity | Higher, especially for low-abundance transcripts [4] | Lower, limited by background noise and saturation [3] [4] | RNA-seq provides digital counting, wider dynamic range [4] |
Practical Performance in Application
Table 2: Performance comparison in applied research contexts
| Application Context | RNA-seq Performance | Microarray Performance | Correlation & Concordance |
|---|---|---|---|
| Clinical Endpoint Prediction | Does not significantly outperform microarrays [12] | Equivalent performance for clinical endpoint prediction [12] | Prediction accuracy most strongly influenced by the clinical endpoint itself, not the technology platform [12] |
| Concentration-Response Modeling | Identifies larger numbers of DEGs with wider dynamic ranges [3] | Produces equivalent transcriptomic point of departure (tPoD) values [3] | Both platforms revealed similar overall gene expression patterns and tPoD values for cannabinoids [3] |
| Functional Pathway Analysis | Identifies more non-coding RNAs and DEGs [3] | Equivalent performance in identifying impacted functions and pathways through GSEA [3] | Similar final results for impacted functional pathways despite initial data discordance [3] |
| Data Integration Complexity | Challenging to integrate with microarray data directly [71] | Difficult to integrate with RNA-seq data directly [71] | Systemic variations exist; raw data not directly comparable without correction [71] |
Detailed Experimental Protocols and Methodologies
Side-by-Side Technology Comparison Protocol
The most robust comparisons emerge from studies that profile the same biological samples using both technologies. The following protocol, derived from a 2025 study on cannabinoids, outlines this direct comparison approach [3].
- Cell Culture & Exposure: Use a relevant cell model (e.g., iPSC-derived hepatocytes). Expose cells to a range of concentrations of the test compound(s) and a vehicle control in replicate [3].
- RNA Extraction: Purify total RNA from all samples, ensuring high quality and integrity (e.g., RIN > 8) using an automated purification system [3].
- Parallel Processing:
- Microarray Pathway: Process RNA (e.g., 100 ng) using a standardized kit (e.g., GeneChip 3' IVT PLUS). Hybridize to the array platform (e.g., GeneChip PrimeView). Scan arrays and preprocess data (e.g., with Robust Multi-array Average (RMA) algorithm) to obtain normalized log2-expression values [3].
- RNA-seq Pathway: Prepare sequencing libraries from the same RNA samples (e.g., using Illumina Stranded mRNA Prep). Sequence on an appropriate platform to a sufficient depth [3].
- Data Analysis:
- Differential Expression: Identify DEGs for each platform using established pipelines.
- Functional Analysis: Perform Gene Set Enrichment Analysis (GSEA) on DEG lists from both platforms.
- Quantitative Modeling: Conduct Benchmark Concentration (BMC) modeling to derive transcriptomic points of departure (tPODs) from both datasets [3].
Cross-Platform Data Integration Protocol (Rank-In)
Integrating existing datasets from different technologies requires specialized methods. The Rank-In algorithm enables integrative analysis across microarray and RNA-seq data [71].
Figure 1: Rank-In workflow for cross-technology data integration.
- Step 1: Data Preprocessing
- Microarray Data: Log-transform raw expression intensities. Map probe IDs to gene IDs, taking the arithmetic mean for multiple probes per gene [71].
- RNA-seq Data: Calculate expression values (e.g., FPKM, TPM, TMM). Filter genes with zero counts across all profiles. Apply log2(x + 1) transformation [71].
- Step 2: Rank-In Transformation
- For each transcriptomic profile, rank all genes from lowest to highest expression intensity.
- Divide the ranked genes into 100 groups with equal numbers of genes.
- Calculate a weight for each group based on the slope of expression intensity within that group. This creates a weighted internal gene ranking for each profile [71].
- Step 3: Remove Nonbiological Effects
Experimental Power and Sample Size Considerations
Underpowered experiments are a major source of irreproducible results. A 2025 large-scale murine study established empirical sample size guidelines [14].
- Experimental Design: Profile large cohorts (e.g., N=30 per genotype) of genetically modified and wild-type mice across multiple tissues. Use this large-N dataset as a gold standard for benchmarking [14].
- Down-Sampling Analysis: Randomly sub-sample smaller sets (e.g., N=3 to N=29) from the full cohort. Perform differential expression analysis on these subsets and compare the results to the gold standard [14].
- Performance Metrics:
- Sensitivity: Percentage of gold-standard DEGs detected in the sub-sampled signature.
- False Discovery Rate (FDR): Percentage of sub-sampled signature genes missing from the gold standard [14].
- Key Findings:
- N ≤ 5: Highly misleading, with high FDR and poor sensitivity.
- N = 6-7: Minimum to consistently reduce FDR to <50% and sensitivity to >50% for 2-fold changes.
- N = 8-12: Significantly better recapitulation of full experiment results. "More is always better" for both metrics within the tested range [14].
The Scientist's Toolkit: Essential Research Reagents and Solutions
Table 3: Key reagents, tools, and software for comparative transcriptomic studies
| Item | Function/Application | Example Products/Tools |
|---|---|---|
| Reference RNA Samples | Standardized materials for platform calibration and cross-study comparison | Universal Human Reference RNA, Human Brain Reference RNA [71] |
| RNA Quality Assessment | Ensure RNA integrity for reliable results; critical for both technologies | Agilent 2100 Bioanalyzer with RNA 6000 Nano Kit (provides RIN) [3] |
| Microarray Platforms | Whole-genome expression profiling using hybridization | Affymetrix GeneChip PrimeView Human Gene Expression Array [3] |
| RNA-seq Library Prep Kits | Prepare sequencing libraries from RNA samples | Illumina Stranded mRNA Prep [3] |
| Deconvolution Tools | Estimate cell-type proportions from bulk transcriptomic data | DECEPTICON, CIBERSORT, EPIC [72] |
| Cross-Platform Integration Software | Enable integrative analysis of mixed microarray and RNA-seq data | Rank-In [71] |
| Meta-Analysis Packages | Combine p-values from multiple related studies for increased power | metaRNASeq R package [73] |
Figure 2: DECEPTICON workflow for tumor microenvironment deconvolution.
The correlation between RNA-seq and microarray data is substantial for core gene expression applications, with both platforms often leading to similar biological interpretations and predictive models. The choice between them involves trade-offs: RNA-seq offers unparalleled discovery power for novel transcripts and splicing variants, while microarrays remain a cost-effective and robust solution for focused gene expression studies, especially in contexts with established analytical pipelines.
The growing emphasis on data integration is paving the way for more sophisticated multi-omic studies. Future methodologies that seamlessly combine historical microarray data with contemporary RNA-seq datasets will maximize the value of existing resources and enhance the statistical power of transcriptomic investigations, ultimately accelerating discovery in basic research and drug development.
Gene expression analysis is a cornerstone of modern molecular biology, crucial for understanding cellular processes, development, health, and disease [41]. For decades, microarray technology was the primary platform for transcriptome profiling. However, with the advent of next-generation sequencing, RNA sequencing (RNA-seq) has increasingly become the dominant technology, comprising 85% of all submissions to the Gene Expression Omnibus (GEO) repository as of 2023 [41] [13]. Despite this shift, a critical question remains: how concordant are the differentially expressed genes (DEGs) identified by these two platforms?
This guide provides an objective, data-driven comparison of DEG detection performance between microarray and RNA-seq technologies. We synthesize evidence from recent studies to evaluate the overlap, correlation, and functional consistency of results, providing researchers and drug development professionals with a clear framework for technology selection and data interpretation within the broader context of bulk RNA-seq versus microarray comparison research.
Fundamental Technological Differences
Microarray technology relies on a hybridization-based approach, where fluorescently labeled cDNA binds to complementary sequences immobilized on a solid surface, with fluorescence intensity representing expression levels [41] [13]. In contrast, RNA-seq utilizes next-generation sequencing of cDNA molecules, providing a digital readout of transcript abundance through direct sequencing [74] [4].
These fundamental methodological differences translate to distinct advantages and limitations for each platform. RNA-seq offers a wider dynamic range, higher specificity and sensitivity, and the ability to detect novel transcripts, gene fusions, and other previously unknown changes [45] [4]. Microarrays provide a more established, cost-effective solution with simpler data analysis requirements and smaller data sizes [3].
Experimental Comparison Framework
To ensure fair comparisons, studies must utilize the same biological samples processed through both platforms, followed by consistent statistical approaches for differential expression analysis. The following diagram illustrates a standardized workflow for such comparative studies:
Quantitative Comparison of DEG Detection
Overlap in Identified DEGs
Multiple studies have systematically compared the DEGs identified by both platforms. The following table summarizes key findings from recent comparative studies:
| Study Context | Total DEGs (RNA-seq) | Total DEGs (Microarray) | Overlapping DEGs | Overlap % of Microarray DEGs | Overlap % of RNA-seq DEGs |
|---|---|---|---|---|---|
| HIV Study (2025) [41] | 2,395 | 427 | 223 | 52.2% | 9.3% |
| Neuroblastoma (2015) [12] | 7,827 | 11,688* | 5,488 | ~47% | ~70% |
| Toxicogenomics (2025) [3] | Wider dynamic range | Limited dynamic range | Similar enriched pathways | - | - |
| Rat Liver Toxicity [45] | More protein-coding DEGs | Fewer protein-coding DEGs | ~78% of array DEGs overlapped | 78% | - |
*Note: The neuroblastoma study reported microarray-detected DEGs first, hence the overlap calculation differs.
Correlation of Expression Measurements
Beyond simple DEG overlap, the correlation of expression values between platforms provides additional insight into their concordance:
- A 2025 study reported a median Pearson correlation coefficient of 0.76 between microarray and RNA-seq gene expression profiles when analyzed with consistent non-parametric statistical methods [41] [13].
- A toxicogenomics study found that both platforms revealed similar overall gene expression patterns with regard to compound concentration, despite RNA-seq detecting larger numbers of DEGs with wider dynamic ranges [3].
- In rat toxicogenomic studies, Spearman's correlation coefficients ranged from 0.7 to 0.83 between platforms for detected DEGs [45].
Experimental Protocols and Methodologies
Standardized RNA Processing Protocols
To ensure valid comparisons, studies typically isolate high-quality RNA from the same original samples for both platforms:
- RNA Isolation: Total intracellular RNA is isolated from samples (e.g., whole blood collected in PAXgene tubes or liver tissue) using standardized kits with globin mRNA depletion when necessary [41] [45].
- Quality Control: RNA quality is assessed using Agilent Bioanalyzer for RNA Integrity Number (RIN) above 7 [41] [3].
- Platform-Specific Processing:
- Microarray: Globin-reduced RNA is poly(A) selected, amplified, and labeled using platform-specific kits (e.g., GeneChip 3' IVT Express Kit) and hybridized to arrays [41].
- RNA-seq: Globin-reduced RNA is processed with poly(A) selection and library preparation kits (e.g., NEBNext Ultra II RNA Library Prep Kit) followed by sequencing on platforms such as Illumina HiSeq [41] [74].
Data Processing and Statistical Analysis
Consistent data processing and statistical approaches are critical for minimizing platform-specific biases:
- Microarray Data Processing: Raw signal intensities are background-corrected, quantile-normalized, and summarized using Robust Multi-Array Averaging (RMA). Expression values are converted to log2 scale for downstream analysis [41] [13].
- RNA-seq Data Processing: Raw reads undergo quality control (FastQC), adapter trimming (Trimmomatic), alignment to reference genomes (STAR, HISAT2), and gene-level quantification (featureCounts) [74] [15].
- Differential Expression Analysis: Non-parametric Mann-Whitney U tests with multiple comparison corrections (Benjamini-Hochberg) applied consistently to both datasets enhance concordance [41].
Functional Concordance in Pathway Analysis
While the number of identified DEGs often differs substantially between platforms, their functional interpretations show greater consistency:
| Study | Perturbed Pathways (RNA-seq) | Perturbed Pathways (Microarray) | Shared Pathways | Functional Concordance |
|---|---|---|---|---|
| HIV Study (2025) [41] | 205 | 47 | 30 | High concordance in shared pathways |
| Cannabinoid Study (2025) [3] | More pathways detected | Fewer pathways detected | Significant overlap | Equivalent performance in identifying impacted functions |
| Rat Hepatotoxicants [45] | Additional pathway enrichment | Core pathways detected | High overlap | Both platforms identified key toxicity mechanisms |
Pathway analysis consistently demonstrates that while RNA-seq typically identifies more perturbed pathways due to its broader gene detection capability, the core biological mechanisms identified by both platforms show significant functional concordance [41] [3] [45].
The Scientist's Toolkit
Essential Research Reagents and Platforms
The following table details key materials and their functions for conducting comparative transcriptomic studies:
| Category | Specific Product/Platform | Function in Research |
|---|---|---|
| RNA Isolation | PAXgene Blood RNA Kit | Stabilizes RNA in whole blood samples [41] |
| GLOBINclear Kit | Depletes globin mRNA from blood samples [41] | |
| Microarray Platform | GeneChip Human Genome U133 Plus 2.0 Array | Measures expression of 54,675 probes [41] |
| GeneChip 3' IVT Express Kit | Amplifies and labels RNA for microarray [41] | |
| RNA-seq Library Prep | NEBNext Ultra II RNA Library Prep Kit | Prepares sequencing libraries from RNA [41] |
| TruSeq Stranded mRNA Prep | Creates strand-specific RNA-seq libraries [45] | |
| Sequencing Platform | Illumina HiSeq 3000/NextSeq500 | Generates high-throughput sequencing data [41] [45] |
| Quality Control | Agilent Bioanalyzer | Assesses RNA Integrity Number (RIN) [41] [3] |
Factors Influencing DEG Concordance
Statistical and Analytical Considerations
The choice of statistical methods significantly impacts observed concordance between platforms:
- Normalization Techniques: Appropriate normalization for each platform's data characteristics is essential. RNA-seq count data often requires variance-stabilizing transformation, while microarray data typically uses quantile normalization [41] [15].
- Differential Expression Algorithms: Consistent use of non-parametric statistical methods (e.g., Mann-Whitney U test) across both platforms reduces discrepancies in DEG identification [41].
- Multiple Testing Correction: Benjamini-Hochberg false discovery rate control applied uniformly to both datasets improves comparability [41].
Sample Quality and Experimental Design
Technical factors substantially influence platform concordance:
- Sample Quality: High-quality RNA (RIN > 7) is critical for reliable comparisons [41] [3].
- Replication: Adequate biological replicates (minimum 3-6 per condition) enhance detection of consistent DEGs [74] [49].
- Sequencing Depth: RNA-seq sensitivity depends on sufficient sequencing depth (typically 20-50 million reads per sample) [74] [15].
The evidence from multiple comparative studies indicates that while RNA-seq typically detects more DEGs due to its wider dynamic range and higher sensitivity, there is substantial concordance in the core biological findings between properly analyzed microarray and RNA-seq data.
For researchers and drug development professionals, technology selection should consider:
- Use Case Requirements: RNA-seq is superior for novel transcript discovery, while microarrays remain viable for focused hypothesis testing [3] [4].
- Resource Constraints: Microarrays offer cost advantages for large-scale studies when the transcriptome of interest is well-annotated [3].
- Analytical Capabilities: RNA-seq requires more extensive bioinformatics infrastructure and expertise [45].
Both platforms can provide biologically valid results when experiments are well-designed and properly analyzed. The integration of legacy microarray data with newer RNA-seq datasets represents a valuable approach for expanding cohort sizes and validating findings across technological platforms [41] [12].
This guide provides an objective comparison of pathway analysis outcomes derived from bulk RNA-seq and microarray technologies. While these platforms differ significantly in their technical principles, leading to variations in raw data output, their application for pathway enrichment analysis reveals a strong convergence in biological interpretation. Evidence from multiple studies indicates that when analyzed with consistent statistical approaches, both methods can identify a core set of significantly perturbed biological pathways, despite differences in the initial lists of differentially expressed genes. This synthesis explores the technical foundations of each platform, examines their performance characteristics in pathway discovery, and highlights methodologies that enhance comparability for integrated analysis.
Pathway analysis has become an essential methodology for extracting biological meaning from high-throughput gene expression data, serving as a bridge between raw molecular measurements and functional interpretation [75]. The process reduces complexity by grouping thousands of individual genes into smaller sets of functionally related genes, thereby providing greater explanatory power than simple lists of differentially expressed genes [75]. The two primary technologies generating input data for pathway analysis—microarrays and RNA-seq—differ fundamentally in their operational principles, which inevitably influences their analytical outcomes.
Microarray technology relies on hybridization between fluorescently labeled cDNA samples and immobilized DNA probes on a solid surface [10]. The resulting fluorescence intensity provides a relative measure of transcript abundance [27]. This technology depends on prior knowledge of the target sequences, as probes are designed based on existing genomic annotations [10]. Key limitations include background hybridization at low expression levels and signal saturation at high expression levels, which constrict its dynamic range to approximately 10³ [4] [27].
RNA-seq technology utilizes next-generation sequencing to directly determine the nucleotide sequence of cDNA molecules [10]. This approach generates digital read counts that reflect transcript abundance, offering a wider dynamic range (>10⁵) and eliminating the need for pre-designed probes [4]. Additional advantages include the ability to detect novel transcripts, alternative splicing events, gene fusions, and sequence variations without relying on existing annotations [4] [10].
Table 1: Fundamental Technological Comparisons Between Microarray and RNA-seq
| Feature | Microarray | RNA-Seq |
|---|---|---|
| Principle | Hybridization-based | Sequencing-based |
| Prior Knowledge Required | Yes | No |
| Dynamic Range | ~10³ [4] | >10⁵ [4] |
| Data Output | Fluorescence intensity (continuous) | Read counts (digital) |
| Novel Transcript Detection | Limited | Yes [4] |
| Background Signal | Higher [27] | Lower [27] |
| Probe/Reference Genome Dependency | Yes [10] | Optional [76] |
The following diagram illustrates the fundamental workflow differences between these technologies and their convergence toward pathway analysis:
Pathway Analysis Methodologies and Experimental Evidence
Pathway Analysis Approaches
Knowledge base-driven pathway analysis methods have evolved through three generations, each addressing limitations of its predecessor [75]. Understanding these methodologies is crucial for interpreting comparative studies between microarray and RNA-seq platforms.
First Generation: Over-Representation Analysis (ORA) ORA represents the initial approach to functional analysis, statistically evaluating whether a particular pathway contains more differentially expressed genes than expected by chance [75]. Using variations of hypergeometric, chi-square, or binomial tests, ORA methods identify enriched pathways from a list of differentially expressed genes typically selected by an arbitrary threshold (e.g., fold-change > 2 or p-value < 0.05) [75]. While widely used, ORA has limitations including: (1) discarding information about the extent of gene regulation by treating all genes equally; (2) losing information from genes that fall marginally below significance thresholds; and (3) assuming independence between genes and pathways, which contradicts biological reality [75].
Second Generation: Functional Class Scoring (FCS) FCS methods address key ORA limitations by considering coordinated changes across all genes in a pathway, not just those passing an arbitrary significance threshold [75]. These approaches account for the magnitude and direction of gene expression changes, offering improved sensitivity in detecting subtle but coordinated pathway alterations [75].
Implementation in Analysis Tools Modern pathway analysis platforms like Reactome implement these statistical approaches while incorporating pathway topology [77]. The platform performs both over-representation analysis (using hypergeometric distribution) and pathway topology analysis, which considers connectivity between molecules represented in pathway steps [77]. This approach can indicate whether experimental data matches the start, end, or specific branches of pathway processes, providing more nuanced biological insights than simple enrichment statistics [77].
Experimental Evidence of Platform Concordance
Multiple studies have systematically compared the pathway analysis outcomes between microarray and RNA-seq platforms, demonstrating substantial biological concordance despite technical differences.
A 2020 study systematically evaluated platform comparability by transforming high-dimensional transcriptomics data into pathway enrichment scores using gene set collections [27]. This approach significantly increased correlations between platforms, filtering out technical noise while preserving biological information. The researchers demonstrated that logistic regression models trained on microarray-derived pathway enrichment scores could effectively predict breast cancer subtypes using RNA-seq data, confirming that biological information is retained through this transformation [27].
A comprehensive 2012 study on HrpX regulome in Xanthomonas citri subsp. citri provided compelling evidence for complementary use of both technologies [78]. The research found that while 72% of known HrpX target genes were detected by both RNA-seq and microarray, the remaining 28% were exclusively detected by one method, with each technology uniquely identifying novel differentially expressed genes [78]. This demonstrates that combining both approaches provides a more comprehensive biological picture than either method alone.
A 2025 study analyzing whole blood samples from 35 participants further confirmed these findings, reporting a high correlation (median Pearson correlation coefficient = 0.76) in gene expression profiles between platforms [41]. While RNA-seq identified more differentially expressed genes (2395 vs. 427), there was significant concordance in the overlap, with 223 shared DEGs representing 52.2% of microarray DEGs [41]. Pathway analysis revealed 205 perturbed pathways by RNA-seq and 47 by microarray, with 30 pathways shared between platforms [41].
Table 2: Comparative Performance in Pathway Analysis from Experimental Studies
| Study | Sample Type | Shared DEGs | Platform-Specific DEGs | Pathway Concordance |
|---|---|---|---|---|
| HrpX Regulome (2012) [78] | Bacterial strains | 72% known targets | 28% detected by only one platform | Complementary coverage |
| HIV Study (2025) [41] | Human whole blood | 223 DEGs shared | Microarray: 204 unique; RNA-seq: 2172 unique | 30 shared pathways of 47 (microarray) and 205 (RNA-seq) |
| Cancer Cell Line (2020) [27] | Cancer cell lines | N/A | N/A | Enhanced correlation after enrichment transformation |
The following diagram illustrates how pathway analysis synthesizes data from both platforms to yield biological insights:
Enhancing Cross-Platform Comparability in Pathway Analysis
Methodological Approaches for Data Integration
The observed discrepancies between microarray and RNA-seq results stem from multiple factors, including technical variations, data processing pipelines, and analytical approaches [41]. However, methodological strategies can significantly enhance cross-platform comparability for pathway analysis.
Gene Set Enrichment Transformation Transforming high-dimensional gene expression data into pathway enrichment scores represents a powerful approach for increasing platform concordance [27]. This method calculates enrichment scores based on a priori defined gene sets collections, converting thousands of individual gene measurements into a smaller collection of pathway-level scores for each sample [27]. The enrichment score represents the degree to which genes within each set are coordinately expressed, effectively filtering out platform-specific technical noise while preserving biological signal [27].
Consistent Statistical Frameworks Applying consistent non-parametric statistical methods across both platforms reduces discrepancies in differential expression analysis [41]. One study demonstrated that using Mann-Whitney U tests with Benjamani-Hochberg false discovery rate correction for both microarray and RNA-seq data produced highly concordant results, with significant overlap in identified pathways despite differences in raw gene-level detection [41].
Reference-Based Mapping and Annotation Standardizing gene identifier mapping between platforms minimizes technical variations unrelated to biological signals [27]. This involves using robust annotation pipelines that map platform-specific identifiers to common reference databases, with careful handling of genes with multiple mappings to avoid ambiguous assignments [27].
Practical Implementation Framework
For researchers seeking to integrate historical microarray data with contemporary RNA-seq datasets, the following practical framework enhances pathway analysis consistency:
Data Transformation: Apply single-sample gene set enrichment analysis (ssGSEA) or related methods to convert both datasets to pathway enrichment scores before comparative analysis [27].
Platform-Aware Normalization: Utilize variance-stabilizing transformation for RNA-seq count data and robust multi-array averaging (RMA) for microarray data to achieve comparable distributions [41].
Pathway-Centric Statistical Testing: Implement consistent non-parametric methods (e.g., Mann-Whitney U) for both platforms when identifying differentially expressed pathways [41].
Multi-Database Validation: Conduct pathway analysis using multiple knowledge bases (KEGG, Reactome, GO) to identify consensus biological themes robust to platform differences [75] [77].
Essential Research Reagents and Tools
Successful pathway analysis requires specific laboratory reagents and computational tools that ensure data quality and analytical robustness. The following table details essential solutions for generating and analyzing transcriptomic data.
Table 3: Essential Research Reagent Solutions for Pathway Analysis Studies
| Category | Specific Product/Platform | Function in Pathway Analysis Workflow |
|---|---|---|
| RNA Isolation | PAXgene Blood RNA Kit [41] | Maintains RNA integrity from whole blood samples for reliable expression profiling |
| Globin Reduction | GLOBINclear Kit [41] | Depletes globin mRNA from blood samples to improve detection of low-abundance transcripts |
| Microarray Platform | GeneChip Human Genome U133 Plus 2.0 Array [41] | Comprehensive gene coverage with 54,675 probes for genome-wide expression analysis |
| RNA-seq Library Prep | NEBNext Ultra II RNA Library Prep Kit [41] | Prepares high-quality sequencing libraries with minimal bias for accurate transcript quantification |
| Sequencing Platform | Illumina HiSeq 3000 [41] | Generates 50 million paired-end reads per sample for deep transcriptome coverage |
| Pathway Analysis Software | Qiagen's Ingenuity Pathway Analysis (IPA) [41] | Identifies statistically enriched pathways and biological functions in expression datasets |
| Online Pathway Tools | Reactome Pathway Database [77] | Open-access platform for over-representation and pathway topology analysis with visualization |
Microarray and RNA-seq technologies, despite their fundamental methodological differences, demonstrate significant convergence in pathway analysis outcomes when appropriate analytical approaches are employed. Technical variations in raw data generation can be effectively mitigated through pathway-centric transformation methods that filter platform-specific noise while preserving biological signals. The strategic application of gene set enrichment analysis, consistent statistical frameworks, and robust pathway databases enables researchers to integrate data across platforms, leveraging the complementary strengths of both technologies. For the scientific community, this synthesis confirms that historical microarray data remains biologically relevant and can be effectively integrated with contemporary RNA-seq datasets through pathway-level analysis, thereby maximizing the utility of existing resources while advancing biological discovery.
In the field of gene expression analysis, the transition from microarray technology to RNA sequencing (RNA-seq) has created a critical need for rigorous performance validation. While both platforms provide powerful tools for transcriptome profiling, each presents distinct technical characteristics that can influence gene expression measurements. qRT-PCR has emerged as the preferred reference method for validating transcriptomic data due to its superior sequence specificity, wide dynamic range, and well-established quantitative precision [79]. This guide provides an objective comparison of bulk RNA-seq and microarray performance using qRT-PCR as the validation standard, presenting experimental data and methodologies to assist researchers in evaluating these technologies for their specific applications.
The fundamental challenge in comparing transcriptomic platforms lies in establishing reliable ground truth for gene expression levels. qRT-PCR addresses this challenge through its dual-level specificity (primers and probe) and ability to accurately quantify transcripts across 6-8 orders of magnitude [79], a range that exceeds the capabilities of most microarray platforms. Furthermore, the digital counting nature of RNA-seq provides a theoretically quantitative framework, but requires validation to account for potential biases in library preparation and sequencing depth [80].
Performance Comparison: RNA-seq vs. Microarray
Comprehensive Technical Metrics
Multiple studies have systematically compared the performance of RNA-seq and microarray technologies using qRT-PCR validation. The table below summarizes key performance metrics based on experimental data:
Table 1: Performance comparison between RNA-seq and microarray platforms using qRT-PCR as reference standard
| Performance Metric | RNA-seq | Microarray | Validation Method | Key Findings |
|---|---|---|---|---|
| Dynamic Range | >105 [4] | ~103 [4] | qRT-PCR (6-8 orders of magnitude) [79] | RNA-seq provides 2 orders of magnitude greater range |
| Detection Sensitivity | Higher sensitivity for low-abundance transcripts [4] | Limited by background fluorescence and saturation [3] [4] | TaqMan qRT-PCR on 1,375 genes [79] | RNA-seq detects higher percentage of differentially expressed genes, especially at low expression levels |
| Differential Expression Concordance | 2395 DEGs identified [13] | 427 DEGs identified [13] | 223 shared DEGs between platforms [13] | RNA-seq detects more DEGs; substantial overlap in functional pathways |
| Platform Reproducibility | High reproducibility after appropriate normalization [80] | CV range: 6-22% (single-color) to 10-18% (dual-color) [79] | qRT-PCR CV significantly lower across dynamic range [79] | Both platforms show good intra-platform reproducibility |
| Transcriptome Coverage | Can detect novel transcripts, splice variants, and non-coding RNAs [3] [80] | Limited to predefined probes [3] | qRT-PCR designed for specific targets [79] | RNA-seq provides unbiased transcriptome characterization |
| Pathway Analysis Concordance | 205 perturbed pathways identified [13] | 47 perturbed pathways identified [13] | 30 shared pathways between platforms [13] | High functional concordance despite different DEG numbers |
Experimental Evidence from Comparative Studies
A 2025 study utilizing consistent statistical approaches found a high correlation (median Pearson correlation coefficient = 0.76) in gene expression profiles between microarray and RNA-seq when analyzed with consistent non-parametric methods [13]. Despite RNA-seq identifying 2,395 differentially expressed genes (DEGs) compared to 427 DEGs from microarray, the platforms shared 223 common DEGs and revealed 30 common perturbed pathways [13]. This suggests that while RNA-seq offers greater sensitivity, both technologies can yield biologically concordant results when properly analyzed.
Earlier large-scale validation using 1,375 genes assessed by TaqMan qRT-PCR demonstrated that microarrays provide acceptable reliability for genome-wide screening, though validation of putative expression changes remains advisable [79]. The study found that 97.4% of detectable genes on Applied Biosystems arrays and 98.7% on Agilent arrays fell within a 2-fold change between technical replicates, indicating good technical reproducibility for both platforms [79].
Methodological Framework for Platform Validation
qRT-PCR Experimental Protocol
Well-validated qRT-PCR protocols are essential for generating reliable reference data. The following workflow outlines the key steps for establishing qRT-PCR as a validation method:
Diagram 1: qRT-PCR validation workflow for transcriptomic data
Key Validation Parameters for qRT-PCR Assays
Establishing a rigorously validated qRT-PCR assay requires careful attention to multiple technical parameters. The MIQE (Minimum Information for Publication of Quantitative Real-Time PCR Experiments) guidelines provide a framework for ensuring assay quality and reproducibility [81] [82]. Critical validation parameters include:
Table 2: Essential qRT-PCR validation parameters and their specifications
| Validation Parameter | Specification | Purpose | Acceptance Criteria |
|---|---|---|---|
| Dynamic Range | 6-8 orders of magnitude [79] [82] | Ensure linear response across expected expression range | R² ≥ 0.980 [82] |
| Amplification Efficiency | PCR efficiency calculation | Confirm optimal reaction kinetics | 90-110% [82] |
| Inclusivity | Detection of all target variants | Verify detection of intended targets | Detection of all relevant isoforms/sequences [82] |
| Exclusivity | Cross-reactivity testing | Ensure no amplification of non-targets | No amplification of similar non-target sequences [82] |
| Limit of Detection (LOD) | Lowest detectable concentration | Determine sensitivity | Consistent detection at low template levels [82] |
| Limit of Quantification (LOQ) | Lowest quantifiable concentration | Establish quantitative range | CV < 25% at low concentrations [82] |
| Reference Gene Validation | Stability across experimental conditions | Ensure accurate normalization | Stability confirmed by geNorm, NormFinder [83] |
Reference Gene Selection Strategy
Proper normalization is critical for accurate qRT-PCR results. Rather than relying on traditional housekeeping genes assumed to be stable, current best practices recommend identifying optimal gene combinations that balance each other across experimental conditions [83]. A novel approach utilizes comprehensive RNA-seq databases to identify stable gene combinations in silico before experimental validation [83]. This method has been shown to outperform standard reference genes by selecting a fixed number of genes whose individual expressions balance each other across all experimental conditions of interest [83].
Experimental Design for Platform Comparison
Sample Preparation and Platform Analysis
A robust experimental design for platform comparison begins with careful sample selection and processing. The following workflow outlines a standardized approach for comparing RNA-seq and microarray performance:
Diagram 2: Experimental design for transcriptomic platform comparison
Research Reagent Solutions for Platform Validation Studies
Table 3: Essential research reagents and materials for transcriptomic platform validation
| Reagent/Material | Function | Application Notes |
|---|---|---|
| TaqMan Gene Expression Assays | qRT-PCR validation with dual-level specificity (primers + probe) [79] | Provides standardized assays for consistent results across laboratories |
| RNA Extraction Kits (PAXgene) | Maintain RNA integrity from complex samples [13] | Particularly important for blood samples; includes globin reduction |
| Globin Reduction Kits | Deplete abundant globin mRNAs from blood samples [13] | Improves detection sensitivity for other transcripts in blood-derived RNA |
| Library Prep Kits (Stranded mRNA) | RNA-seq library preparation with strand specificity [13] | Maintains directional information for accurate transcript annotation |
| Microarray Platforms (Affymetrix, Agilent) | Genome-wide expression profiling using hybridization [79] | Different platforms show varying signal-to-noise ratios and reproducibility |
| RNA Integrity Assessment (Bioanalyzer) | Quality control for input RNA (RIN > 7 recommended) [13] | Critical for both microarray and RNA-seq data quality |
| Reference Gene Panels | Normalization of qRT-PCR data across experimental conditions [83] | Combination of multiple stable genes outperforms single reference genes |
Analysis and Interpretation of Validation Data
Statistical Approaches for Platform Assessment
When comparing platform performance against qRT-PCR data, several statistical measures provide objective assessment. The coefficient of variation (CV) between technical replicates indicates platform reproducibility, with qRT-PCR typically demonstrating significantly lower CV values across the dynamic range compared to microarray platforms [79]. Correlation coefficients (e.g., Pearson r) between platform measurements and qRT-PCR results quantify agreement, with one study reporting a median correlation of 0.76 between RNA-seq and microarray [13]. For differential expression, concordance analysis of significantly changed genes identifies the overlap between platforms, with typical findings of substantial but incomplete overlap [13].
Recent evidence suggests that applying consistent non-parametric statistical methods to both microarray and RNA-seq data can reduce discrepancies and enhance the concordance of downstream pathway analyses [13]. This approach addresses the different data distributions generated by each technology (continuous fluorescence intensities for microarrays versus discrete count data for RNA-seq) and may provide more comparable results for functional interpretation.
Functional Concordance Despite Technical Differences
Despite differences in the number of detected DEGs, both RNA-seq and microarray technologies often identify similar biological pathways as significantly perturbed [13]. This functional concordance suggests that while RNA-seq offers greater sensitivity for detecting individual gene expression changes, both platforms can yield biologically consistent conclusions when analyzed appropriately. This is particularly relevant for applications where pathway-level insights rather than individual gene changes are the primary research focus.
qRT-PCR validation provides essential ground truth for objectively evaluating the performance of transcriptomic platforms. Based on current evidence:
RNA-seq offers advantages in dynamic range, sensitivity, and ability to detect novel transcripts, making it preferable for discovery-phase research [4].
Microarray technology remains a cost-effective option for focused studies where the transcriptome is well-annotated, with smaller data sizes and established analytical pipelines [3].
qRT-PCR validation remains essential for confirming expression changes of key targets regardless of the discovery platform used [79].
Functional pathway analysis shows substantial concordance between platforms despite differences in individual gene detection [13].
The choice between RNA-seq and microarray should consider research goals, budget constraints, and analytical capabilities. Both platforms can generate valuable biological insights when implemented with appropriate experimental design and validation protocols.
Gene expression analysis is a cornerstone of modern molecular biology, toxicology, and clinical research. For decades, microarray technology was the predominant platform for transcriptome profiling. However, the advent of RNA sequencing (RNA-seq) has dramatically shifted the landscape, with RNA-seq now comprising approximately 85% of all submissions to the Gene Expression Omnibus repository as of 2023 [13]. Despite this trend, microarray technology remains a viable and widely used platform, particularly in specific application contexts.
This guide provides an objective comparison of the real-world performance of bulk RNA-seq and microarray technologies, with a specific focus on clinical and toxicological applications. We present experimental data, detailed methodologies, and analytical workflows to help researchers, scientists, and drug development professionals select the appropriate technology for their specific research needs.
Fundamental Technological Differences
The fundamental operational principles of microarrays and RNA-seq differ significantly. Microarrays utilize a hybridization-based approach where fluorescently labeled cDNA molecules bind to complementary DNA probes fixed on a solid surface [3] [10] [13]. The resulting fluorescence intensity provides a quantitative measure of gene expression. This technology requires prior knowledge of the target sequences for probe design.
In contrast, RNA sequencing (RNA-seq) employs next-generation sequencing to directly determine the nucleotide sequences of cDNA molecules [4] [10]. This approach generates digital read counts that reflect transcript abundance without requiring pre-defined probes, enabling discovery of novel transcripts.
Comprehensive Performance Metrics
Experimental comparisons between the two technologies reveal distinct performance characteristics. The table below summarizes key metrics based on recent comparative studies:
Table 1: Performance comparison between microarray and RNA-seq technologies
| Performance Metric | Microarray | Bulk RNA-Seq | Experimental Context |
|---|---|---|---|
| Dynamic Range | ~10³ [4] [10] | >10⁵ [4] [10] | Technical capability of each platform |
| DEGs Identified | 427 DEGs (9.4% of total) [13] | 2395 DEGs (52.7% of total) [13] | Study of 35 human blood samples |
| Shared DEG Detection | 223 DEGs shared between platforms [13] | 223 DEGs shared between platforms [13] | Same set of 35 human blood samples |
| Pathways Identified | 47 perturbed pathways [13] | 205 perturbed pathways [13] | Pathway analysis of HIV+ vs HIV- youth |
| Shared Pathway Detection | 30 pathways shared between platforms [13] | 30 pathways shared between platforms [13] | Consistent functional enrichment despite different DEG numbers |
| Transcriptomic Point of Departure (tPoD) | Equivalent tPoD values [3] | Equivalent tPoD values [3] | Toxicogenomic study of cannabinoids (CBC, CBN) |
| Correlation Between Platforms | Median Pearson correlation = 0.76 [13] | Median Pearson correlation = 0.76 [13] | Direct comparison using same blood samples |
Analysis of Discordance and Concordance
Despite different numbers of identified differentially expressed genes (DEGs), both platforms show significant concordance in downstream biological interpretation. A study comparing transcriptomic benchmark concentration (BMC) modeling for toxicogenomic assessment found that "transcriptomic point of departure (tPoD) values derived by the two platforms through BMC modeling were on the same levels for both CBC and CBN" [3]. This suggests that for traditional toxicogenomic applications like mechanistic pathway identification and concentration-response modeling, both technologies can yield equivalent conclusions.
Similarly, in a clinical study comparing youth with and without HIV, despite RNA-seq identifying 5.6 times more DEGs than microarray, "30 pathways were shared" between the platforms in subsequent pathway analysis [13]. This demonstrates that while RNA-seq offers greater sensitivity, both platforms can identify core biological processes.
Experimental Protocols and Methodologies
Detailed Workflow Comparison
The following diagram illustrates the key procedural differences and similarities in sample processing for microarray and RNA-seq technologies:
Key Methodological Considerations
Sample Preparation and RNA Requirements
Both technologies typically start with 100-500 ng of total RNA [3] [13]. For microarray analysis, RNA is reverse-transcribed into cDNA and labeled with fluorescent dyes (typically Cy3 or Cy5) [3] [10]. For RNA-seq, library preparation involves either poly(A) selection to enrich for mRNA or ribosomal RNA depletion to capture both coding and non-coding RNAs [3] [42].
Data Generation and Processing
Microarray data processing involves multiple critical steps: background correction, quantile normalization, and summarization using algorithms like Robust Multi-Array Averaging (RMA) [3] [13]. The final output is a continuous fluorescence intensity value for each probe set, typically log2-transformed for analysis.
RNA-seq data processing includes quality control (e.g., FastQC), adapter trimming, alignment to a reference genome/transcriptome, and generation of count data using tools like HTSeq or featureCounts [13]. Normalization methods account for sequencing depth and other technical factors, with common approaches including TPM (Transcripts Per Million) and variance-stabilizing transformations [13].
Essential Research Reagents and Materials
Successful gene expression profiling requires specific reagents and tools throughout the experimental workflow. The following table details key solutions for both platforms:
Table 2: Essential research reagents and materials for microarray and RNA-seq workflows
| Category | Specific Product/Technology | Function in Workflow | Platform |
|---|---|---|---|
| RNA Isolation | PAXgene Blood RNA Kit [13], QIAshredder [3] | Total RNA purification from cells/tissues | Both |
| RNA Quality Control | Agilent Bioanalyzer with RNA 6000 Nano Kit [3] | Assess RNA Integrity Number (RIN) | Both |
| Microarray Platform | GeneChip PrimeView Human Gene Expression Array [3] | Pre-defined probe sets for hybridization | Microarray |
| Microarray Processing | GeneChip 3' IVT PLUS Reagent Kit [3] | cDNA synthesis, labeling, and amplification | Microarray |
| Microarray Instrumentation | GeneChip Scanner 3000 [3] | Fluorescence signal detection | Microarray |
| RNA-seq Library Prep | Illumina Stranded mRNA Prep [3] | cDNA library construction for sequencing | RNA-seq |
| RNA-seq Poly(A) Selection | Poly(A) mRNA Magnetic Isolation Module [13] | Enrichment of mRNA from total RNA | RNA-seq |
| RNA-seq Platform | Illumina HiSeq 3000 [13] | High-throughput sequencing | RNA-seq |
| Globin Reduction | GLOBINclear Kit [13] | Depletion of globin transcripts (blood samples) | Both |
| Data Analysis Software | Affymetrix TAC [3], DESeq2 [13], Seurat [48] | Data processing and differential expression | Both |
Applications in Clinical and Toxicological Research
Toxicogenomics and Risk Assessment
In concentration-response toxicogenomic studies, both platforms have demonstrated comparable performance in identifying transcriptomic points of departure (tPoD), which are critical for quantitative risk assessment [3]. A 2025 study comparing the effects of cannabinoids (CBC and CBN) on iPSC-derived hepatocytes found that "despite the many varieties of non-coding RNA transcripts and larger numbers of differentially expressed genes (DEGs) with wider dynamic ranges identified by RNA-seq, the two platforms displayed equivalent performance in identifying functions and pathways impacted by compound exposure through gene set enrichment analysis (GSEA)" [3].
This equivalent performance in pathway identification, combined with lower costs and smaller data storage requirements, suggests that "microarray is still a viable method of choice for traditional transcriptomic applications such as mechanistic pathway identification and concentration response modeling" [3].
Clinical Biomarker Discovery
RNA-seq demonstrates advantages in clinical biomarker discovery due to its ability to detect novel transcripts, splice variants, and low-abundance transcripts [4] [42]. In oncology, RNA-seq can reveal "gene fusions, splicing variants, mutations/indels in addition to differential gene expression, thus providing a more complete genetic picture than DNA sequencing" [42].
However, the replicability of RNA-seq findings can be challenging, particularly with small cohort sizes. A 2025 study noted that "differential expression and enrichment analysis results from underpowered experiments are unlikely to replicate well" [49]. The authors recommended "at least six biological replicates per condition are necessary for robust detection of DEGs, increasing to at least twelve replicates when it is important to identify the majority of DEGs" [49].
Clinical Predictive Modeling
Both technologies have been successfully employed in developing predictive models for clinical outcomes. In pediatric B-cell acute lymphoblastic leukemia, researchers used RNA-seq data to construct a programmed cell death-related relapse prediction model comprising seven key genes [48]. Similarly, in ovarian cancer, bulk RNA-seq combined with single-cell RNA-seq analysis enabled development of a random forest model predicting platinum chemotherapy response with high accuracy (AUC of 0.993 in test cohort) [84].
Both microarray and RNA-seq technologies offer distinct advantages for clinical and toxicological applications. RNA-seq provides superior sensitivity, dynamic range, and ability to detect novel transcripts. However, microarray technology remains a cost-effective and reliable option for focused transcriptomic applications, particularly in contexts where the goal is pathway identification rather than novel transcript discovery.
The choice between platforms should be guided by specific research objectives, budget constraints, and analytical capabilities. For comprehensive biomarker discovery and detection of novel transcripts, RNA-seq is preferable. For targeted toxicogenomic studies and pathway analysis in well-annotated genomes, microarray technology remains a valid and practical choice. As sequencing costs continue to decline, RNA-seq will likely become increasingly dominant, but microarray data will continue to provide value, particularly for leveraging existing datasets and conducting meta-analyses.
Conclusion
RNA-seq generally offers superior capabilities for discovery-driven research with its wider dynamic range, higher sensitivity, and ability to detect novel transcripts and isoforms. However, microarrays remain a cost-effective and standardized option for focused studies where the transcriptome is well-annotated and clinical prediction is the primary goal. The choice between platforms should be guided by research objectives, budget, and computational resources rather than technological momentum. Future directions include the growing integration of both legacy and new transcriptomic data into machine learning models, the continued refinement of RNA-seq analysis pipelines, and the expanding application of these technologies in regulatory decision-making and personalized medicine. Both platforms, when applied appropriately, will continue to yield valuable biological insights and drive innovation in biomedical research.
References
- 1. of Comparison -based and hybridization -based gene... sequencing [https://pubmed.ncbi.nlm.nih.gov/17555589/]
- 2. Comparison of hybridization-based and sequencing-based ... [https://pmc.ncbi.nlm.nih.gov/articles/PMC1899500/]
- 3. An updated comparison of microarray and RNA-seq for ... [https://pmc.ncbi.nlm.nih.gov/articles/PMC12016467/]
- 4. RNA-Seq vs Microarrays | Compare technologies [https://www.illumina.com/science/technology/next-generation-sequencing/beginners/advantages/rna-seq-vs-arrays.html]
- 5. Applications of single-cell RNA sequencing in drug discovery ... [https://pmc.ncbi.nlm.nih.gov/articles/PMC10141847/]
- 6. Advances in high-throughput drug screening based on ... [https://www.sciencedirect.com/science/article/pii/S2090123225006897]
- 7. A real-world multi-center RNA-seq benchmarking study ... [https://www.nature.com/articles/s41467-024-50420-y]
- 8. Hybridization capture vs amplicon sequencing | IDT [https://www.idtdna.com/page/support-and-education/decoded-plus/targeted-sequencing-hybridization-capture-or-amplicon-sequencing/]
- 9. Amplicon Sequencing . vs Capture: The Hybridization of... Comparison [https://www.cd-genomics.com/diseasepanel/amplicon-sequencing-vs-hybridization-capture-the-comparison-of-target-enrichment-methods-for-disease-panel.html]
- 10. Microarray vs. RNA Sequencing [https://www.cd-genomics.com/resource-microarray-vs-rna-sequencing.html]
- 11. The Role of Microarray in Modern Sequencing: Statistical ... [https://www.preprints.org/manuscript/202505.0172]
- 12. Comparison of RNA-seq and microarray-based models for ... [https://genomebiology.biomedcentral.com/articles/10.1186/s13059-015-0694-1]
- 13. The Role of Microarray in Modern Sequencing [https://www.mdpi.com/2673-6284/14/3/55]
- 14. Optimized murine sample sizes for RNA sequencing ... [https://www.nature.com/articles/s41467-025-65022-5]
- 15. Systematic comparison and assessment of RNA-seq ... [https://www.nature.com/articles/s41598-020-76881-x]
- 16. Augmenting precision medicine via targeted RNA-Seq ... [https://www.nature.com/articles/s41698-025-00993-8]
- 17. Evaluation of Long-Read RNA Sequencing Procedures for ... [https://pmc.ncbi.nlm.nih.gov/articles/PMC12469794/]
- 18. Systematic assessment of long-read RNA-seq methods for ... [https://www.nature.com/articles/s41592-024-02298-3]
- 19. Long-read RNA-sequencing reveals transcript-specific ... [https://pmc.ncbi.nlm.nih.gov/articles/PMC12308531/]
- 20. Baylor Genetics Presents New Data on Clinical and ... [https://www.baylorgenetics.com/news/baylor-genetics-presents-new-data-on-clinical-and-diagnostic-utility-of-rna-sequencing-for-rare-disease-at-ashg-2025-annual-meeting/]
- 21. Experimental validation of methods for differential gene ... [https://bmcgenomics.biomedcentral.com/articles/10.1186/s12864-015-1767-y]
- 22. The Standardization and Regulation of Microarrays - PMC [https://pmc.ncbi.nlm.nih.gov/articles/PMC2347363/]
- 23. Advantages of RNA-seq Compared to RNA Microarrays for ... [https://pmc.ncbi.nlm.nih.gov/articles/PMC5787041/]
- 24. Comparison of RNA-seq and microarray-based models for ... [https://pubmed.ncbi.nlm.nih.gov/26109056/]
- 25. Development and validation of an RNA-seq-based ... [https://www.nature.com/articles/s41598-022-12199-0]
- 26. Comparison of RNA-Seq and Microarray Gene Expression ... [https://pmc.ncbi.nlm.nih.gov/articles/PMC6349826/]
- 27. Increased comparability between RNA-Seq and microarray ... [https://pmc.ncbi.nlm.nih.gov/articles/PMC7549825/]
- 28. [Tutorial] Bulk RNA-seq DE analysis [https://informatics.fas.harvard.edu/resources/tutorials/differential-expression-analysis/]
- 29. Bulk RNAseq Methodology and Analysis Guide [https://www.cores.emory.edu/eicc/_includes/documents/sections/resources/RNAseq_Methodology.html]
- 30. limma powers differential expression analyses for RNA ... [https://pmc.ncbi.nlm.nih.gov/articles/PMC4402510/]
- 31. The hitchhikers' guide to RNA sequencing and functional ... [https://pmc.ncbi.nlm.nih.gov/articles/PMC9851315/]
- 32. A comprehensive workflow for optimizing RNA-seq data analysis [https://bmcgenomics.biomedcentral.com/articles/10.1186/s12864-024-10414-y]
- 33. Primary Data Analysis of RNA-Seq data| RNA Lexicon [https://www.lexogen.com/blog/rna-lexicon-data-analysis-and-quality-control-primary-analysis/]
- 34. Introduction to RNA-seq Analysis - SCINet - USDA [https://scinet.usda.gov/events/2025-05-13-rna-seq]
- 35. RNA Sequencing in Drug Discovery and Development [https://www.lexogen.com/blog/rna-sequencing-in-drug-discovery-and-development/]
- 36. A rapid and inexpensive labeling method for microarray gene ... [https://pmc.ncbi.nlm.nih.gov/articles/PMC2790446/]
- 37. The Principles and Workflow of SNP Microarray [https://www.cd-genomics.com/the-principles-and-workflow-of-snp-microarray.html]
- 38. Microarray vs RNA Sequencing: Which Gene Expression ... [https://www.labmanager.com/microarray-vs-rna-sequencing-which-gene-expression-analysis-technique-is-more-effective-33683]
- 39. ExpressYourself: a modular platform for processing and ... [https://pmc.ncbi.nlm.nih.gov/articles/PMC169034/]
- 40. Electronic hybridization detection in microarray format and ... [https://www.nature.com/articles/srep04194]
- 41. The Role of Microarray in Modern Sequencing [https://pmc.ncbi.nlm.nih.gov/articles/PMC12285979/]
- 42. From bulk, single-cell to spatial RNA sequencing [https://www.nature.com/articles/s41368-021-00146-0]
- 43. Challenges and Considerations in Bulk RNA-seq [https://alitheagenomics.com/blog/challenges-and-considerations-in-bulk-rna-seq]
- 44. Understanding Bulk and Single-Cell RNA Sequencing [https://www.cd-genomics.com/resource-bulk-rna-sequencing-vs-single-cell-rna-sequencing.html]
- 45. Comparison of RNA-Seq and Microarray Gene Expression ... [https://www.frontiersin.org/journals/genetics/articles/10.3389/fgene.2018.00636/full]
- 46. Comparison of RNA-Seq and microarray in the prediction of ... [https://pmc.ncbi.nlm.nih.gov/articles/PMC10920353/]
- 47. A meta-analysis of bulk RNA-seq datasets identifies ... [https://www.nature.com/articles/s41598-024-75431-z]
- 48. Integrating bulk RNA-seq and scRNA-seq data to explore ... [https://www.nature.com/articles/s41598-025-86148-y]
- 49. Replicability of bulk RNA-Seq differential expression and ... [https://journals.plos.org/ploscompbiol/article?id=10.1371/journal.pcbi.1011630]
- 50. A systematic benchmark of Nanopore long-read RNA ... [https://www.nature.com/articles/s41592-025-02623-4]
- 51. Precision and Accuracy in Quantitative Measurement of Gene ... [https://pmc.ncbi.nlm.nih.gov/articles/PMC12603356/]
- 52. Top Bioinformatics Tools for RNA Sequencing Data Analysis [https://riveraxe.com/top-bioinformatics-tools-for-rna-sequencing-data-analysis-best-value-for-your-research/]
- 53. Integrative analysis of bulk and single-cell RNA ... [https://www.frontiersin.org/journals/medicine/articles/10.3389/fmed.2025.1552029/full]
- 54. Over 1000 tools reveal trends in the single-cell RNA-seq ... [https://pmc.ncbi.nlm.nih.gov/articles/PMC8555270/]
- 55. Powerful scRNA-seq Data Analysis Tools in 2025 [https://www.nygen.io/resources/blog/single-cell-scrna-seq-multi-omics-data-analysis-tools]
- 56. Unveiling tissue heterogeneity through genomic interaction ... [https://www.sciencedirect.com/science/article/pii/S0002929725003556]
- 57. Microarray vs. RNA-Seq: When to Use Which and How ... [https://dromicsedu.com/blog-details/microarray-vs-rna-seq-when-to-use-which-and-how-to-analyze-both]
- 58. Normalization of Microarray Data: Single-labeled and Dual ... [https://www.sciencedirect.com/science/article/pii/S1016847823174188]
- 59. Public RNA-Seq and scRNA-Seq Databases [https://bigomics.ch/blog/ultimate-guide-to-public-rnaseq-and-sc-rna-seq-databases/]
- 60. Cost of NGS | Comparisons and budget guidance [https://www.illumina.com/science/technology/next-generation-sequencing/beginners/ngs-cost.html]
- 61. Budgeting for an mRNA-seq project? How much does RNA ... [https://alitheagenomics.com/blog/budgeting-for-an-mrna-seq-project-here-are-the-main-cost-drivers-to-keep-an-eye-on]
- 62. Cost-Effective Strategies for RNA-Seq Pipeline Computing [https://www.elucidata.io/blog/cost-effective-strategies-for-large-scale-bulk-rnaseq-pipeline-computing]
- 63. RNA-Seq - Bioinformatics for Beginners, January 2025 [https://bioinformatics.ccr.cancer.gov/docs/bioinformatics-for-beginners-2025/index.md.bak1/]
- 64. Augmenting precision medicine via targeted RNA-Seq ... [https://pmc.ncbi.nlm.nih.gov/articles/PMC12166063/]
- 65. Clinical and analytical validation of a combined RNA ... [https://www.nature.com/articles/s43856-025-00934-3]
- 66. Chapter 12 Bulk RNA-seq | Choosing Genomics Tools [https://hutchdatascience.org/Choosing_Genomics_Tools/bulk-rna-seq-1.html]
- 67. Article Clinical validation of RNA sequencing for Mendelian ... [https://www.sciencedirect.com/science/article/pii/S0002929725000527]
- 68. Chapter 11 RNA Methods Overview | Choosing Genomics ... [https://hutchdatascience.org/Choosing_Genomics_Tools/rna-methods-overview.html]
- 69. A Framework for Comparison and Assessment of Synthetic ... [https://pmc.ncbi.nlm.nih.gov/articles/PMC9778097/]
- 70. Comparison Between Expression Microarrays and RNA ... [https://pmc.ncbi.nlm.nih.gov/articles/PMC7611373/]
- 71. Rank-in: enabling integrative analysis across microarray ... [https://pmc.ncbi.nlm.nih.gov/articles/PMC8464058/]
- 72. DECEPTICON: a correlation-based strategy for RNA-seq ... [https://pmc.ncbi.nlm.nih.gov/articles/PMC12107245/]
- 73. Comparing Data Across RNA-Seq Studies [https://www.rna-seqblog.com/comparing-data-across-rna-seq-studies/]
- 74. From bench to bytes: a practical guide to RNA sequencing ... [https://www.frontiersin.org/journals/genetics/articles/10.3389/fgene.2025.1697922/full]
- 75. Ten Years of Pathway Analysis: Current Approaches and ... [https://journals.plos.org/ploscompbiol/article?id=10.1371/journal.pcbi.1002375]
- 76. From RNA-seq reads to differential expression results [https://genomebiology.biomedcentral.com/articles/10.1186/gb-2010-11-12-220]
- 77. Analysis Tools - Reactome Pathway Database [https://reactome.org/userguide/analysis]
- 78. RNA-seq and microarray complement each other in ... [https://pmc.ncbi.nlm.nih.gov/articles/PMC3534599/]
- 79. Large scale real-time PCR validation on gene expression ... [https://bmcgenomics.biomedcentral.com/articles/10.1186/1471-2164-7-59]
- 80. Comprehensive comparative analysis of RNA sequencing ... [https://pmc.ncbi.nlm.nih.gov/articles/PMC3821180/]
- 81. Consensus guidelines for the validation of qRT-PCR ... [https://pmc.ncbi.nlm.nih.gov/articles/PMC8792405/]
- 82. Quantitative PCR validation for research scientists: Part 1 of 2 [https://virologyresearchservices.com/2023/01/13/quantitative-pcr-validation-part-1-of-2/]
- 83. A stable combination of non-stable genes outperforms ... [https://www.nature.com/articles/s41598-024-82651-w]
- 84. Integrating bulk RNA-seq and scRNA-seq analyses with ... [https://www.nature.com/articles/s41598-025-99930-9]